ISSN 1546-9239
© 2008 Science Publications
Correspondence author: Dr. Seyed Morteza Marandi, Civil Engineering Department, Bahonar University, Kerman, Iran
Numerical Investigation Into The Behavior of Circular Pad Shallow Foundations
Supported By Geogrid Reinforced Sand
1
S.M. Marandi,
1M. H. Bagheripour,
1R. Rahgozar and
2A.R. Ghirian
1
Department of Civil Engineering, Bahonar University, Kerman, Iran
2Civil Engineer Senior Expert, Tehran, Iran
Abstract: This study seeks to widen the pool of knowledge on the use and characteristics of geosynthetics, specifically in the area of circular foundations supported by geosynthetic reinforced sand. The main objective of the work was to increase the awareness of circular foundation systems and thus increase the accuracy of current laboratory methods. Also, compare the results with that of previous papers on the subject and to provide new model curves to estimate the bearing capacity of circular foundations. In this respect, the foundation and the soil underneath was modeled using four nots isoparameters finite element aid, while, for geogrid reinforcement, the four nots one-dimentional finite element model was used. The sand behavior was based on demolition elasto-plastic drucker-prager criteria and for the reinforcement the linear criteria was used. The paper investigates the effects of the reinforcement placing properties, soil properties, reinforcement properties, and the geometric properties of circular foundations. The results showed that; the bearing capacity ratio at a settlement level for geogrid reinforced sand is effected considerably by parameters such as: reinforcement placement, reinforcement layers, reinforcement strength, geometric properties of circular foundations, and effects of using granular soils. Based on the results achieved, a number of design curves have been developed to assist with the estimation (design) of field bearing capacity of shallow foundations supported by geogrid reinforced soil. Keeping in mind the settlement limitations in real space, the curves have been developed for normal settlement levels up to a settlement ratio of 2.5%.
Keywords: Circular foundation; geosynthetics; bearing capacity, settlement level. INTRODUCTION
The use of geosynthetics in civil engineering has flourished in recent years due to its ability to improve soil properties in some manner. Specific to this study, the use of geogrid to improve the bearing capacity and settlement performance of shallow pad foundations has proven to be a cost effective foundation system. In this application geogrid has allowed the use of shallow foundations where traditionally more expensive deep foundations such as piles have been used.
Soil reinforcement including geosyntetics, galvanised steel mesh and anchoreed steel cable are used to improve the bearing capacity, and decrease the settlement in soil structures such as embankments, retaining walls, bridge abutments and foundations. The settlement and bearing capacity characteristics of foundations are dependent on many varied and interconnected parameters and conditions and predicting these relationships has been the subject of many studies.
The circular foundation, which is predominantly used in axi -symetric structures and has economic advantages over boxed foundationsm has received little research attention.
Over the last two decades, considerable advances have been made into the understanding of the behavior of reinforced soil foundations and on the applications and limitations of using geosynthetics to improve the performance of shallow foundations. Detailed investigations have been performed using small scale laboratory test models and a (limited) number of in-situ tests [1, 2, 3, 4, 5, 6, 7, 8 ]
356 geogrid reinforcement, consider found action conditions and lack of research into geogrid reinforced circular foundations, more research is required to understand this emerging technology.
The main objective of the work was to undertake numerical investigation into the strength and settlement characteristics of circular pad foundations strengthened by using underlying geogrid reinforced granular soil. The paper investigated the various areas such as : the effect of reinforcement placement and determination of optimum placement depth and number of reinforcement layers; the effects of reinforcement strength and identification of the optimal strength; the effects of using granular soils and their benefits to shallow foundations; and the geometric properties and advantages of circular foundations.
The results are presented and analysed with the aim of increasing the awareness of circular foundation systems and thus increase the accuracy of current laboratory methods. Also, new model curves are developed to estimate the bearing capacity of circular foundations.
The Theoretical Model: The controlling, and inter-related, parameters in foundation design are bearing capacity and settlement. Hence; it is important to evaluate the bearing capacity of circular foundations at various settlements in comparison to the settlement achieved at ultimate load.
To evaluate the increase in bearing capacity, the ratio of bearing capacity of reinforced soil to that of the unreinforced soil, the bearing capacity ratio (BCR) is usually used. For numerical simulation, the bearing capacity is introduced as a non-dimensional ultimate bearing capacity ratio, BCRu, as follows:
( )
u R u u
q
q
BCR
=
(1)Where, qu(R) and qu = the ultimate bearing capacity
with, and without geogrid, reinforcement respectively. At present, most shallow foundations are designed for a limited settlement in real scale. To model this scenario BCRs will be determined at various settlement levels (e.g. s/B = 2.5%, 5% and 7.5%). The
BCR at a settlement level of
S
≤
S
u can be introduced as:( )
q
q
BCR
S=
R (2)Where, BCRS = ultimate bearing capacity ratio at a settlement level of S, and q(R) and q=ultimate bearing capacity with, and without, reinforcement respectively at a settlement level of S.
The physical model for this investigation consists of a reinforced soil–foundation system with failure boundary radiating downward and outward from the foundation contact surface which shows disipation of the stresses with depth. The parameters used in the model are: B = Circular foundation diameter, N = Number of geogrid layers, b = Geogrid width, and Df = The foundation embedment depth.
The reinforced depth is d and can be calculated as:
(
N
)
h
u
d
=
+
−
1
(3) The increase in foundation bearing capacity can arise from two factors: stiffness increase due to the reinforcement, and friction strength.The value of bearing capacity ratio (BCRu and BCRs) for a given foundation supported by geogrid reinforcement sand depends on non-dimensional parameters such as: the top layer of geogrid depth ratio (u/B), geogrid reinforcement thickness ratio (h/B), the reinforcement depth ratio (d/B), geogrid width ratio (b/B), and number of geogrid layers (N).
Based on analatical results, the optimum, and critical, ratios for the effective parameters on bearing capacity can be used. These are defined as: (1) the optimum depth ratio, (u/B)opt as the point at which
further increases in u/B occur the BCR decreases (assuming other parameters remain constant), or the maximum BCR, (2) the critical depth ratio (u/B)cr as the
point at which, if further increases in
u
B
occur. Surface failure appears beneath the foundation in the soil layer above geogrid, and practically, reinforcement does not have any effect on foundation bearing capacity, and (3) for other effective bearing capacity parameters, there are optimal values, i.e. the rat ios of (h/B)opt, (b/B)opt, (d/B)opt, and (N)opt and these can bedetermined.
In finite element grids for geogrid reinforced soil, the reinforced element is shown as a horozontal line. The dimensions and boundary conditions of the geometric model are selected far enough from the foundation so as to diminish their effects on the analysis. Due to axisymetry of the model, only half of the model is used as any effects in this area are simply reflected into the other half of the model.
Foundation and soil are mo deled with four nots isoparametric finite element aid and for geogrid reinforcement, four nots one dimentional finite element model is used.
non-357 Table 1: Model technical material properties
Material Criteria
φ
(deg.)C
(kN/m2)
ψ
(deg.)γ
(kN/m3)E
(kN/m2)
υ
KR(kN/m)
TR (kN/m)
Foundation Elastic - - - 24.0 2×10⁷ 0.3 - -
Sand Drucker-Prager
35 1 0 17.4 37000 0.3 - -
Geogrid Elastic - - - 0.2 4000 100
linear behavior is as per modeled by Drucker and Prager[9], with a homogeneous uniform load imposed on foundation. To reach the required accuracy in calculations, uniform load is increased by increments until foundation failure.
The material properties are presented in Table 1 and represent the general standard characteristics of silicon based of poor grading.
For investigation the effect of a certain parameter (shown in Table 1) on the foundation bearing capacity, the values of other parameters are assumed remain constant.
For the numerical analysis, a circular foundation with diameter of 2m and thickness of 0.4m is used. The foundation is placed on the ground surface, on top of the reinforcement soil (embedment depth of zero,
0
= f
D ).
Investigations were carried out on various parameters such as : (1) The reinforcement placement properties including; the first layer geogrid reinforcement depth ratio from the foundation base (u/B), the geogrid reinforcement thickness ratio (h/B), the number of geogrid reinforcement layers (N), the total reinforced depth ratio (d/B), and the geogrid width ratio (b/B). (2) The reinforced soil properties including; internal angle of friction (
φ
), dilation angle of soil (ψ
), soil unit weight (γ
), soil modulus of elasticity (E), and Poisson ratio (ν
), (3) The reinforcement properties including; reinforcement tensile strength (T), and the elastic normal stiffness of reinforcement (K). (4) The geometric properties of foundation including; the width of foundation (B), and the foundation embedment depth (Df).Due to the concentic loading; the ultimate bearing capacity of the foundation (qu) was calculated based on Terzaghi[17] laboratory and practical observations for
vertical loads on unreinforced circular foundations as follows:
γ
γ
γ
D
N
BN
CN
q
u=
1
.
3
C+
f q+
0
.
3
(4) Where,γ
= unit weight of sand, B = foundation diameter,D
f = foundation embedment depth, and C = cohesion of sand.N
C,N
q andN
γ = coefficients of bearing capacity which, are calculated from the following equations.(
−
1
)
cot
ϕ
=
qc
N
N
(5)(
)
+
=
2
45
tan
2tanϕ
ϕ
π
e
N
q (6)(
)
ϕ
γ
=
1
.
5
N
q−
1
tan
N
(7) In equations (5), (6), and (7),ϕ
is angle of internal friction of sand. The ultimate bearing capacity of foundation is calculated based on various values ofϕ
and compared with finite element analysis results. The first part of the investigation was checking that results from the finite element analysis accurately depicted results achieved when using the Terzaghi model[17]. The comparison of results is made, and the finite element analysis is observed to provide an accurate model.PLACEMENT OF REINFORCEMENT
Reinforcement Depth - Analysis was undertaken of the variation of BCR versus the reinforcement depth ratio for a circular surface foundation with one layer of reinforcement. The results are shown in Figure 1, noting that the curves have been plotted for various settlement levels. The results indicate that, at the same
u/B, the BCRs increases as the settlement ratio (s/B) increases. The results also show that; at a u/B ratio of 1.2 the s/B and BCRs stabilise to a relatively constant value.
358
0.8 1.2 1.6 2.0 2.4
0.0 0.4 0.8 1.2 1.6 2.0 2.4
u/B
BCRS
BCRs(s/B=2.5%) BCRs(s/B=5%) BCRs(s/B=7.5%) BCRu
Fig. 1: BCR versus u/B for N=1, b/B=6, TR=100 k N/m, KR=4000 k N/m
1.0 1.4 1.8 2.2 2.6
0.0 0.1 0.2 0.3 0.4 0.5 0.6 0.7
u/B
BCR
BCRs(s/B=2.5%) BCRs(s/B=5%) BCRs(s/B=7.5%) BCRu
Fig. 2: BCR versus optimum u/B for N=1, b/B=6,
TR=100 kN/m, KR=4000 kN/m
0 20 40 60 80 100
0.0 0.4 0.8 1.2 1.6 2.0
u/B
Tensile force (kN/m)
BCRs(s/B=2.5%) BCRs(s/B=5%) BCRs(s/B=7.5%) BCRu
Fig. 3: Tensile force versus u/B for N=1, b/B=6,
KR=4000 kN/m
0.8 1.2 1.6 2.0 2.4
0.0 0.4 0.8 1.2 1.6 2.0 2.4
u/B
BCR
S/B=2.5% S/B=5% S/B=7.5% Ultimate Load
Fig. 4: BCR versus u/B for N=4, h/B=0.3, b/B=6,
TR=100 k N/m, KR=4000 k N/m
1.0 1.4 1.8 2.2 2.6
0.0 0.1 0.2 0.3 0.4 0.5 0.6 0.7
u / B
S/B=2.5% S/B=5% S/B=7.5% Ultimate Load
Fig. 5: BCR versus optimum u/B for N=4, h/B=0.3,
b/B=6, TR=100 k N/m, KR=4000 k N/m
1.0 1.4 1.8 2.2 2.6 3.0
0.0 0.1 0.2 0.3 0.4 0.5 0.6 0.7
h/B
BCR
BCRs(s/B=2.5%) BCRs(s/B=5%) BCRs(s/B=7.5%) BCRu
Fig. 6: BCR versus h/B for N=4, u/B=0.2, b/B=6,
TR=100 k N/m, KR=4000 k N/ m
1.0 1.1 1.2 1.3 1.4 1.5 1.6 1.7
0 1 2 3 4 5 6 7
b/B
BCR
BCRs(s/B=2.5%) BCRs(s/B=5%) BCRs(s/B=7.5%) BCRu
Fig. 7: BCR versus b/B for N=1, u/B=0.2, TR=100 k N/m, KR=4000 k N/m
0 20 40 60 80 100 120
0 1 2 3 4 5 6 7
b/B
Tensile force
(kN/m)
BCRs(s=2.5%) BCRs(s=5%) BCRs(s=7.5%) BCRu
359
1.0 1.4 1.8 2.2
0 1 2 3 4 5 6
N
BCR
BCRs(s/B=2.5%) BCRs(s/B=5%) BCRs(s/B=7.5%) BCRu
Fig. 9: BCR versus N forφ=30o, u/B=0.2, h/B=0.3,
b/B=6, TR=100 k N/m, KR=4000 k N/m
1.0 1.2 1.4 1.6 1.8 2.0 2.2
0.0 0.2 0.4 0.6 0.8 1.0 1.2 1.4 1.6
d/B
BCR
BCRs(s=2.5%) BCRs(s=5%) BCRs(s=7.5%) B C R u
Fig. 10:BCR versus d/B for φ=30o, u/B=0.2, h/B=0.3,
b/B=6, TR=100 k N/m, KR=4000 k N/m
0 100 200 300 400 500 600 700 800
0.0 0.1 0.2 0.3 0.4
Settlement (m)
Load per unit area
(kN
/m
2)
Unrein. N=1 N=2
N=3 N=4 N=5
Fig. 11: Load-settlement curves for foundations with and without reinforcement for u/B=0.2,
h/B=0.3, b/B=6
predict the formation of reinforcement failure due to the creation of pressure imposed from wedge failure produced underneath of foundation, (2) For condition
( )
0.4 2.
0 ≤ u Bopt.≤ , the load is distributed into the area below the foundation, and creates a proper reinforcement pull-out strength under surcharge pressure. It is in this region that the maximum benefit (load transmission) of the reinforcement can be achieved, and (3) for critical depth ratio, (u/B)cr, of
1.1-1.2, the plastic failure zone below the reinforcement
layer does not expand and creates the failure above the layer. Hence, placing the reinforcement layer below the critical depth is ineffective. Where u/B greater than (u/B)cr, the reinforcement layer acts as a semi-rigid
plane, and the soil wedge failure develops above reinforcement layer. Extending the BCR versus depth ratio curve, for u/B greater than (u/B)cr, it can be
observed that, for uB≈2, the bearing capacity ratio will be ≈1. This value is consistent with laboratory data obtained by Pfeifle and Das[10].
1.0 1.1 1.2 1.3 1.4 1.5 1.6 1.7
0 25 50 75 100
Tensile force (kN/m)
BCRs
Footing Dia. = 1m Footing Dia. = 1.5m
Footing Dia. = 2m
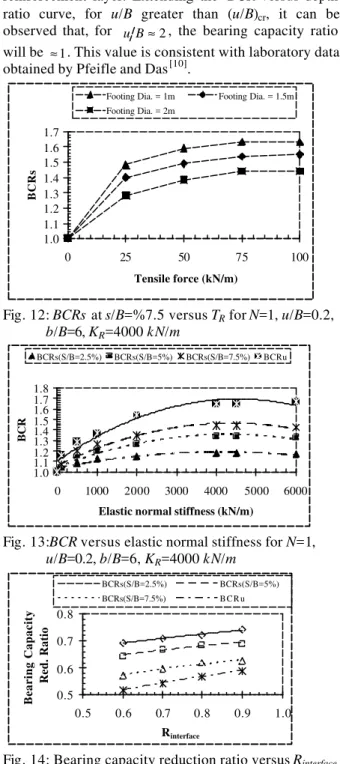
Fig. 12: BCRs at s/B=%7.5 versus TR for N=1, u/B=0.2, b/B=6, KR=4000 k N/m
1.0 1.1 1.2 1.3 1.4 1.5 1.6 1.7 1.8
0 1000 2000 3000 4000 5000 6000
Elastic normal stiffness (kN/m)
BCR
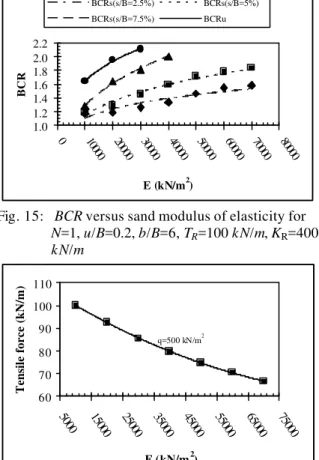
BCRs(S/B=2.5%) BCRs(S/B=5%) BCRs(S/B=7.5%) BCRu
Fig. 13:BCR versus elastic normal stiffness for N=1,
u/B=0.2, b/B=6, KR=4000 k N/m
0.5 0.6 0.7 0.8
0.5 0.6 0.7 0.8 0.9 1.0
Rinterface
Bearing Capacity
Red. Ratio
BCRs(S/B=2.5%) BCRs(S/B=5%) BCRs(S/B=7.5%) B C R u
360
1.0 1.2 1.4 1.6 1.8 2.0 2.2
0 10000 20000 30000 40000 50000 60000 70000 80000
E (kN/m2)
BCR
BCRs(s/B=2.5%) BCRs(s/B=5%) BCRs(s/B=7.5%) BCRu
Fig. 15: BCR versus sand modulus of elasticity for
N=1, u/B=0.2, b/B=6, TR=100 k N/m, KR=4000
k N/m
q=500 kN/m2
60 70 80 90 100 110
5000 15000 25000 35000 45000 55000 65000 75000
E (kN/m2)
Tensile force (kN/m)
Fig. 16: Tensile force versus sand modulus of elasticity for N=1, u/B=0.2, b/B=6, KR=4000 k N/m
1 2 3 4
0 1 2 3 4 5
N
BCR
U
T=20 T=35 T=60 T=100
Fig. 17a: Design curve models for multiple reinforcement layer for b/B=1, u/B=0.2,
h/B=0.3, footing width=2m, min. friction angle =30º
The optimal u/B is shown in Figure 2. The numerical analysis shows that; the maximum BCR is achieved at a depth ratio of 0.2. It also shows that the BCRs increases with increasing settlement.
1 2 3 4
0 1 2 3 4 5
N
BCR
U
T=20 T=35 T=60 T=100
Fig. 17b: Design curve models for multiple reinforcement layer for b/B=2.5, u/B=0.2, h/B=0.3, footing width=2m, min. friction angle =30º
1.0 1.1 1.2 1.3 1.4 1.5 1.6 1.7
0.0 0.1 0.2 0.3 0.4 0.5 0.6
u/B
BCR
U
T=100 T=60 T=35 T=20
Fig. 18a: Design curve models for one layer reinforcement for b/B=2, N =1, footing width=2m, min. friction angle =30º
1.0 1.2 1.4 1.6
0.0 0.1 0.2 0.3 0.4 0.5 0.6
u/B
BCR
U
T=100 T=60 T=35 T=20
Fig. 18b: Design curve models for one layer reinforcement for b/B=3, N =1, footing width=2m, min. friction angle =30º
The results of an analysis of tensile force versus
361 reinforcement tensile force approaches zero. This may indicate that; the stress bubbles do not penetrate further than 2B below the foundation base.
1.0 1.1 1.2 1.3 1.4 1.5 1.6 1.7
0 0.1 0.2 0.3 0.4 0.5 0.6
u/B
BCRu
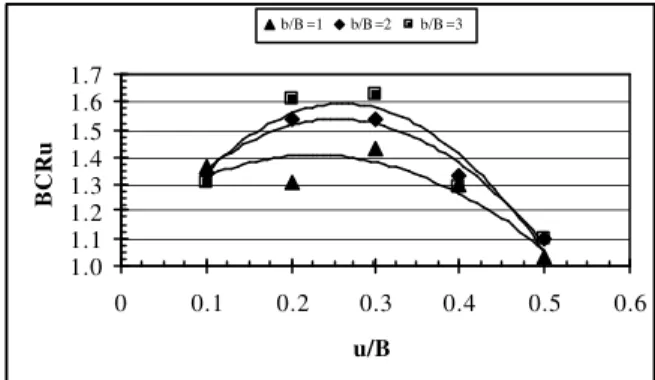
b/B =1 b /B =2 b/B =3
Fig. 19a: Design curve models for geogrid reinforcement for TR = 20 kN/m, N =1, footing width=2m, min.
friction angle =30º
1.0 1.1 1.2 1.3 1.4 1.5 1.6 1.7
0 0.1 0.2 0.3 0.4 0.5 0.6
u/B
BCRu
b/B =1 b/B =2 b/B =3
Fig. 19b: Design curve models for geogrid reinforcement for
TR = 35 kN/m, N =1, footing width=2m, min.
friction angle =30º
1.0 1.1 1.2 1.3 1.4 1.5 1.6 1.7
0 0.1 0.2 0.3 0.4 0.5 0.6
u/B
BCRu
b/B =1 b/B =2 b/B =3
Fig. 19c: Design curve models for geogrid reinforcement for
TR = 60 kN/m, N =1, footing width=2m, min.
friction angle =30º
The Effect of Multiple Layers of Reinforcement: The results of numerical assessment of multiple layers (four
layers in this example) of geogrid reinforcement are shown in Figures 4 and 5. The plot curves indicate that; the BCR reaches a maximum (for various settlement levels) at an optimum depth ratio of 0.2. While Figure 4 shows decrease in BCR with increase in depth ratio, the variation of BCR for
( )
u B ≤0.3 is insignificant. Also, when the depth ratio increases above 0.9; the variation of BCR with differing settlement levels is insignificant. Hence, the critical depth ratio can be selected as≈
0
.
9
. These results confirm the findings by Sing[11], which were based on the study of square footings on sand reinforced with mild steel grids (optimum depth ratio was about 0.25). However, the results are in contrast with reports of other researches [7, 12, 13], which, most likely is due to difference in material properties and the geometric dimensions of the foundation and reinforcement. Hence, it may be concluded that; reporting a single value of u/B for optimum bearing capacity of geogrid reinforced soil is flawed as reported by other researchers such as; Adams and Colin[2], Yetimuglu et al.[4], and Guido et al.[8].1.0 1.1 1.2 1.3 1.4 1.5 1.6 1.7
0 0.1 0.2 0.3 0.4 0.5 0.6
u/B
BCRu
b/B =1 b/B =2 b/B =3
Fig. 19d: Design curve models for geogrid reinforcement for TR = 100 kN/m, N =1, footing width=2m, min.
friction angle =30º
Spacing of Reinforcement: The results of the assessment of multiple layers of reinforcement also showed that; there exists an optimum verical spacing distance (or height ratio h/B) (or a range of values) between the reinforcement layers. The variation of BCR
362 vertical spacing was different for different geogrids. However, the disagreement with the findings reported[7,
12, 13] may be due to the difference in the material
properties and the geometric dimensions of the foundation and geogrid used in the present study.
The influece of vertical spacing between the reinforcement layers on BCR may also be related to the variation of applied normal forces on reinforcement, as, with an increase in depth below the foundation base; the friction forces, and thus the reinforcement pull-out resistance, decrease accordingly. As shown in figure 6, for the case of h/B < 0.5, the wedge shear failure penetrates into the reinforcement zone; provoking the reinforcement, and resulting in an increase in bearing capacity.
Reinforcement Width: The variation of BCR versus reinforcement width ratio (b/B) for various settlement levels and conditions is shown in Figure 7. For a given settlement level; BCR increases with b/B. At b/B = 3, the curve tends to convex upward and levels off to a constant value. Hence, b/B = 3 can be considered the optimum reinforcement width ratio [(b/B)opt]. The
numerical analysis showed that the value of (b/B)opt = 3
remains the same for multiple reinforcement layers. This result is slightly higher than that reported by Guido et al.[8], who obtained (b/B)opt = 2.5 for square
foundations.
The mechanism of the reinforced soil system can be described as; with increase in reinforcement length; the friction forces derived from imposed normal forces on a unit length of reinforcement increases; which results in an increase in the reinforcement friction strength. Furthermore, below the foundation base, there is a zone of shear deformation at the interface between zones 1 and 2. The creation of an effective tensile strength in the reinforcement requires; a portion of the reinforcement to be anchored beyond this zone to develop sufficient friction to resist pull-out.
Curves plotting reinforcement tensile force versus
b/B for various settlement levels are shown in Figure 8. The results indicate that; at b/B = 2 to 2.5, the tensile force reaches a maximum and levels off to a constant value.
Plots of BCRu/BCR, with averages extracted from Figure 7 versus b/B indicates that; for all values of b/B, the BCRs
≈
0.80BCRu.Effects of Multiple Layers of Reinforcement: The effect of the number of reinforcement layers on bearing capacity ratio (BCR) and tensile force TR, at various
depths, illustrates that; for a given settlement level; the
BCR increases with increasing layers of reinforcement. Furthermore, it appears that, the variation of the number of reinforcement layers (N) has a dramatic effect on bearing capacity (moreso that the variation of other parameters).
The plots of BCRu and BCRs versus the number of layers of reinforcements (N) is presented in Figure 9. Results indicate that; for a given settlement level, the plot curves tend to convex upward and level off to a constant value for N
≥
3. This result is equivalent to that of reinforcemernt depth ratio, d/B = 0.9≈
1 shown in Figure 10. It appears that; the increase in BCR for depth beyond 0.9≈
1B is not significant, or in practical terms, placing the reinforcement at a depth greater thanB; does not improve the bearing capacity.
The load-settlement curve for the circular foundation supported by differing numbers of reinforcement layers is shown in Figure 11. The results show that; the curves for N = 3, 4, and 5 coincide with each other. This suggests that the optimum number of layers of reinforcement, N = 3. This confirm the works of Akinmusuru and Akinbolade[12], and Guido et al.[8], who reported that; the rate of increase in BCR would decrease beyond 3 layers of reinforcement. However, the results disagree with the findings reported by Yetimoglu et al.[4], which suggested that the optimal number of reinforcement layers, N = 4, corresponding to a reinforcement depoth of 1.5 B; Omar et al.[14], and Booshehrian and Hatef[15] who also found that the optimum number of layers of reinforcement, N = 4. The differences in results may be due to the differences in the material properties and the geometric dimensions of the geogrid they used in their studies.
Generation of Tensile Forces in the Reinforcement: The variation of tensile force with the reinforcement embedment depth ratio (z/B) shows that, for a given embedment depth ratio, all layers of reinforcement coincide with each other. This means, that the optimum embedment depth ratio for any number of layers of reinforcement is the same. The results indicate that; the tensile forces generated at reinforcement embedment depth ratio of 1.5, is 20 k N/m. If the right end of the curve is extrapolated, it intersects the x-axis at
( )
z B ≈2 which; represents the reinforcement tensile force of0
≈
363
q P≈0.286
∆ (for d B≈2.4 below center of foundation) (8)
q
P≈0.087
∆ (for d B≈5.1 below center of foundation) (9)
Where: ∆p=pressure increment on foundation
and, q=load per unit area of the foundation.
The results of using the Bossinesque theory show that the optimal reinforcement depth is where
28 . 0
≈
∆p q .
The Variation of BCRu/BCRs versus number of layers of reinforcement (N) indicates that, inspite of some scatter in results, the linear correlation indicates that; for any number of layers of reinforcement, the
u
S BCR
BCR ≈0.80 . Based on stress distribution below the circular foundations, it appears that; with an increase in reinforcement depth ratio; the normal force decreases and subsequently; the friction between the soil and reinforcement decrease. Thus, placing the reinforcement at a lower embedment depth; does not increase the bearing capacity as friction forces for circular foundations at 2B approaches zero.
Overall the parameter improvement gained by using multiple layers of reinforcerment may be attributable to the increase in shearing strength and the geogrid-sand system acts as a composit material and prevents the distribution of soil wedge failure below the foundations base.
Reinforcement Effect on Settlement: To evaluate the effects of reinforcement on the deformation of load-settlement curves for foundations supported by sand with, and without, reinforcement; Figure 11 can be used. The load-settlement curves indicate that; the type of failures differ between the reinforced, and unreinforced, cases. The load-settlement curve slope for the unreinforced foundation experiences relatively dramatic failure (i.e. levelling of the curve) at a settlement of 0.1m. In soil mechanics this type of failure is referred to as general shear failure. In contrast, the foundation with multiple layers of reinforcement experiences gradual failure, as illustrated by the gradual levelling of the curve. This type of failure is called local shear failure.
The mechanism of interaction between the soil and reinforcement occur in such a way that; with transferral of stress from the soil to the reinforcement, the increase in friction and passive strengths against pulling out result in an improvement of the bearing capacity of the foundation. In this example the use of reinforcement increases the ultimate bearing capacity over the
unreinforced foundation by up to 300% (1.5≤BCRu≤3), which; is equivalent in this example of settlements of 100 to 400 mm. This level of settlement would not be acceptable in construction practice, therefore the bearing capacity with controlled settlement can be limited to
u
s BCR
BCR =0.8 . When limiting settlement (e.g. ≤%2.5) the reinforcement acts to immediately, and over the long term, decreases the soil strain which; results in the improvement to the soil properties (refer to Figure 11).
THE REINFORCEMENT PROPERTIES
The investigation of the reinforcement properties of tensile strength (TR) and elastic normal stiffness of reinforcement (KR) are critical components in understanding the contribution of the reinforcement to the strengthening of the foundation system.
Reinforcement Tensile Strength: The varation of bearing capacity ratio (BCR) of foundations with diameters of 1.0m, 1.5m and 2.0m versus reinforcement tensile stress for one layer of reinforcement was analysed and the results are shown in Figure 12. The results indicate that; with a given foundation diameter; and an increase in the allowable tensile force from 25
k N/m to 100 k N/m, the BCR increases. At a tensile force of approximately 75 k N/m; the increase in BCR levels off to (an almost) constant value for all foundations diameters tested. The results suggest that in practical works, and for foundations with “ordinary” dimentions; increasing the tensile strength of the reinforcement above a certain level does necessarily result in an increase BCR.
364 footings). The difference in results is most likely due to differences in the geogrid material properties and the geometric dimensions of the geogrid used.
The variation of tensile force versus elastic normal stiffness indicates that, at a given settlement level; the curve tends to take a convex upward shape and levels off at elastic normal stiffness of 4000 k N/m. Hence, it seems that, the maximum strength of reinforcement is used at this point.
Development of Friction Between Reinforcement and Soil: Due to the difference in embankment gradation of the soil supporting the foundation and the size of the voids in the geogrid mesh it is physically impossible to achieve 100% friction at the soil / geogrid interface. The actual level of friction development is thus an important parameter and is determined through the pull-out test. For the purposes of this investigation the decreased in friction between the soil and reinforcement is denoted as a coefficient ratio of the angle of internal friction ( =δ ϕ
erface
Rint ). Also, the effect of decreased bearing capacity resulting from the decreased friction development, is denoted as a non-dimensional decreased bearing capacity coefficient which; is the ratio of the bearing capacity of reinforced foundation 1<Rinterface=1.
The variation of the two dimensionless parameters, the bearing capacity reduction ratio versus coefficient of internal angle of friction ratio is plotted in Figure 14. In this example, the value of Rinterface is estimated between 0.6 to 0.9. The results indicate that; with a given settlement level, and an increase in Rinterface, the reduction coefficient of settlement increases. This condition is similar for all settlement levels. The variation of (created) normal and shear strengths in the reinforcement verses Rinterface shows that; with Rinterface
≈
0.6; the effective normal stress is almost three fold of the shearing stress, while with increasing in Rinterface;the differences between both stresses decrease in such a way that; at Rinterface
≈
0.9, the difference is about 60%.Soil Properties: In reinforced soil foundations granular soils (silicous sands) are used to replace the existing soil and form part of the reinforced soil system due to their beneficial, and generally consistent, properties of durability, good drainage, constructability and increased interaction between the soil and reinforcement. The granular soil used is considered to well graded. The parameters evaluated as part of this
investigation include internal angle of friction (
φ
), modulus of elasticity (E), unit weight (γ
), dilation angle (ψ), and Poisson ratio (ν
) (based on AASHTO specifications) is used.Friction Angle: The sand angle of internal friction (
φ
) varied from 24 to 46 degrees and its effect on foundation behavior, bearing capacity ratio, and reinforcement created tensile forces was evaluated.The variation of load per unit area versus internal angle of friction (f) for various settlement levels indicates that; with a given settlement level, an increase in f results in a corresponding increase in the foundation load bearing capacity. The results also show that; an increase in the level of settlement, results in an increase in the load bearing capacity. Extrapolating the initial, and final, results using tangents gives point with minimum curvature, or optimal internal angle of friction f = 38 degree.
In order to achieve an internal angle of friction of 38 to 40 degrees, the soil requires a USCS classification
GW (well graded gravel) or GP (poorly graded gravel) and relative compaction above 85% (as defined by AASHTO). However, the soil particle size is limited by the size of the geogrid mesh opening. As the soil particles increase in size the movement of the particles through the geogrid opening is reduced, relative friction reduces and the pull-out strength of the reinforcement decreases, thus decreasing the ultimate bearing capacity of the foundation. Also, based on geosynthetic manufacturer’s recommendations for using a soil type such as GP, the bearing capacity of reinforced soil structures decreases by up to 10% due to the mechanical interference during the installation of the geogrid. Thus it is suggested that the optimal internal angle of friction is between 35 to 38 degrees.
365 Based on the results achieved above, the reinforced soil can be economically designed. By increasing the strength of the soil a lower geogrid tensile strength can be used. Cost savings can be achieved as generally the sourcing, placement and compaction of soils is more cost effective than expensive geosynthetics.
In unreinforced foundations increasing the dilation angle (?) from zero to ultimate f results in a corresponding increase in the bearing capacity. Even though, in loose soils; the increase in volume (dilation) is not observable; for f less than, or equal to, the average f (e.g.
φ
<
27
o), using the ? is not physically justified. However, for higher values of f, the value of? is limited to a maximum of f/3 or f/2. In this research the value of ? was estimated to be between 4 to 16 degrees and; its effect on reinforced soil beneath the foundation base was evaluated.
The varation of BCR versus dilatancy angle, ?
shows that, for a given settlement level, with increase in
?, the BCR increases. Also the plots curves indicate that; at a given ?, with increase in settlement level, the
BCR increases accordingly. However, the increase in
BCR is very moderate up to 8 degrees but for ?
≥
8 degrees, the increase of BCR is much steep.The investigation of surcharge load per unit area versus the unit weight of the sand (density) for various settlement levels indicates that; at a given settlement level the increase in unit weight of the soil results in an increase in the foundation bearing capacity. Also the resultant curve indicates that; at a given soil unit weight, an increase in settlement level, the bearing capacity increases. Overall however, the increase in bearing capacity with increase in unit weight is insignificant.
The variation of reinforcement tensile force versus sand unit weight shows that; at a given unit weight, with increase in the level of settlement, the reinforcement tensile force increases (settlement/increase in tensile force) 2.5%/107%, 5%/44%, and 7.5%/21%. This result suggests that increasing the settlement level ratio increases the tensile force but the ratio of increase in tensile force reduces as settlement level increases. Overall however, increasing the sand unit weight does not, significantly change the reinforcement tensile force.
The variation of BCRS/BCRu versus sand unit weight for various settlement levels indicates that, at a given unit weight, the ratio of BCRS/BCRu increases with increasing levels of settlement. The plot curves
also indicate that; the BCRS/BCRu decreases slightly with increase in soil unit weight. The results of the investigation shows that the average bearing capacity / settlement levels relationship is: 70%/2.5%, 80%/5%, and 86%/7.5% respectively.
The variation of BCR versus modulus of elasticity (E) for sand for various settlement levels is shown in Figure 15. The results show that; increasing E increases the BCR values. The plot curves also indicate that; given the same E an increase in the settlement level results in an increase BCR. Also, at a given E, slope of the curves become much steeper as the settlement level increase.
The investigation into the variation of reinforcement tensile force versus E (at constant load) is shown in Figure 16. The results show that; (with the application of a constant load of 500 kN/m2); the reinforcement tensile force decreases with increase in
E. The increase in E can be attributed to the increase in the sand stiffness; (i.e. Greater load carrying capacity) causing the tensile force to decrease. Furthermore, increase in the soil stiffness; causes a decrease in deformation (settlement) and; related decrease in the level of strain experienced by the reinforcement. Thus, with increasing E the activation of the reinforcement is reduced, resulting in a decrease in the generation of tensile force.
The Poisson ratio (
ν
) which; is defined as the ratio of unit lateral strain to unit longitudinal strain has considerable influence on bearing capacity ratio (BCR). The results of the investigation into the variation of Poisson ratio versus BCR shows that; at a given Poisson ratio, the BCR increases with increase in settlement. The curve plots also indicate that increasing the Poisson ratio results in a corresponding increase in the BCR.The Geometric Properties Of Circular Foundations: To investigate the effects of foundation dimensions and the foundation embedment depth; investigation was undertaken varying these parameters in the numerical model and comparing the results against changes in
BCR.
366 The reason seems to be that; with increase in dimension of foundation, the normal force which creates friction strength between soil and reinforcement is decreased. Hence, the reinforcement tensile force decreases and the reinforcement is not activated bringing it in line with the unreinforced soil
The variation of BCR for a settlement ratio (s/B) of 7.5% for varying tensile forces versus foundation diameter shows that; at a given diameter as the tensile force increases so does the BCR. The plot curves also indicate that, with increase in diameter and at a given tensile force, the BCR decreases with steep downward slope from diameter 0.5m to diameter 1.5m, at which point the rate decreases. This shows similar behavior to the laboratory works of Das and Omar[14] who worked on strip foundations.
The variation of BCR versus embedment depth ratio (Df/B) for various settlement levels indicates that, at a given Df/B, with increase in settlement level, the BCR value increases. The results also indicate that, for a given settlement level, with increase in Df/B, the BCR values increase correspondingly.
Modelling Curves: Based on the results achieved in this study a number of design curves have been developed to assist with the estimation (design) of field bearing capacity of shallow foundations supported by geogrid reinforced soil. Keeping in mind the settlement limitations in real space, the curves have been developed for normal settlement levels up to a settlement ratio (s/B) of 2.5%. The new models are presented in Figures 17a, 17b, 18a to 18c and 19a to 19d. The internal angle of friction of 30 degrees has been used and the results are based on the ultimate bearing capacity ratio (BCRU). This means that for any design with a controlling settlement condition; the
BCRU can be used. Furthermore, based on analytical results obtained in this study; the relationship
u
s BCR
BCR ≈0.80 can be used for all presented models. Model curves plotted in figures 36a and 36b show the variation of BCRu versus number of geogrid reinforcement layers for various tensile forces and for width ratios (b/B) of 1 and 2.5. These models indicate that; with increasing the width ratio towards its optimum value and with increasing tensile forces, the
BCRu increases.
Figures 19a and 19b show the variation of BCRu versus depth ratio to the upper layer of geogrid (u/B) for various tensile force and for width ratios (b/B) of 2 and 3. These models indicate that; with increasing the b/B, the value of BCRu will increase accordingly, and for a
certain optimum depth ratio, the maximum BCRu can be determined.
The variation of BCRu versus u/B for reinforcement width ratios of 1, 2, and 3 is shown in figures 19a to 19d. From these models and for optimum u/B and b/B; the ultimate bearing capacity will be determined.
RESULTS AND DISCUSSIONS
This study was carried out to investigate and analyse the parameters that govern the behavior of circular foundations supported by geogrid reinforced sand. The effects of the reinforcement placing properties, soil properties, reinforcement properties, and the geometric properties of the circular foundations were investigated. This paper presents the results of a two dimentional, non-linear, finite element in plane-stain condition analyses, and a comparison of the results with other researches. Base on the numerical model investigation, the following conclusions can be drawn:
One layer of geogrid reinforcement:
1. For u/B less than 0.2; the soil mass above the geogrid layer does not create enough friction strength to prevent the reinforcement from pulling out and may cause reinforcement failure
2. The BCR value reached to its maximum at an optimum u/B of 0.1 to 0.3 and the critical depth ratio was ≈0.9 (which; is consistent with
rectangular footing as reported by Yetimoglu et al., 1994)
3. At u/B ≈2; the reinforcement tensile force reaches to an insignificant value. This may indicate that; the stress bubbles do not penetrate further than 2B
below the foundation base
4. The optimum b/B found was 3. This value is the same for multiple reinforcement layers and is greater than that reported by Guido et al., 1985, who optained the value of 2.5 for square footings 5. It was found that; choosing a more rigid
reinforcement does not always lead to a better results in terms of BCR. The optimal (including a consideration for economics) allowable design stress for the reinforcement is 100 k N/m. Also, the applied load on foundations supported by reinforced soil is a function of friction strength between the soil, the reinforcement, and the reinforcement tensile strength
367 foundation. The results suggest that the optimum value for elastic normal stiffness is 4000 k N/m. This contradicts the result of 1000 k N/m as found by Yetimoglu et al.[4] who worked on rectangular footings. The disagreement may be attributed to the difference in geogrid material properties and the geometric dimensions of the geogrid used
7. The dilatancy angle (?) for reinforced soil foundations causes an increase in BCR for any all settlement levels and for
ψ ≤
φ
4
, there is no significant change in BCR.8. For settlement ratios (s/B) of 2.5% to 5%, 5% to 7.5% and 7.5% to BCRu, there is 107%, 44%, and 21% (respectively) increase in tensile force. This means that; increasing the settlement level ratio, the increamental increase in tensile force is less. However, with increasing unit weight, there is no significant change in reinforcement tensile force 9. The average bearing capacity for settlement levels
of 2.5%, 5%, and 7.5% is 70%, 80%, and 86% of ultimate bearing capacity respectively
10. With application of a constant load; the reinforcement tensile force decreases with increasing the value of E. This is due to the increase of sand stiffness; causing the tensile force to decrease. Also, an increase of soil stiffness; causes a decrease in deformation (settlement) and; a corresponding decrease in the reinforcement strain.
11. When the granular soil Poissons ratio varies from 0.2 to 0.4 the rate of BCR increase, for increasing settlement levels, is very high with a (parallel) average slope of 65 degrees.
12. The BCR decreases with increase in foundation diameter. The reason seems to be that; with increase in dimension of foundation, the normal force which creates friction strength between soil and reinforcement is decreased. Hence, the reinforcement tensile force decreases and the reinforcement is not activated bringing it in line with the unreinforced soil
13. The value of BCR, at a given tensile force, is at its maximum for a foundation diameter of 1.5m. (i.e. circular foundations with a diameter greater than 1.5m do not effect the BCR). This appears to be similar to the laboratory works of Das and Omar[14] who worked on strip foundation.
Multiple layers of geogrid reinforcement :
1. The optimum value for h/B is approximately 0.3. This value is slightly higher than the 0.25 suggested by Singh[11] and 0.20 suggested by Yetimouglu et al.[4]. Furthermore, for the case of
h/B less than 0.5, the wedge failure shear penetrates into reinforcement zone; activating the reinforcement; and causing an increase in the bearing capacity
2. The optimum number of layers of reinforcement to achieve the maximum BCR is 3. This confirm the works of Akinmusuru and Akinbolade[12], and Guido et al.[8] who reported that; the rate of increase in BCR would decrease beyond 3 layers of reinforcement. However, the results disagree with the findings reported by Yetimoglu et al.[4] who reported that; the optimum number of reinforcement layers was 4, corresponding to a reinforcement depth of 1.5B, and Omar et al.[14], Booshehrian and Hatef[15] who found that; the optimum number of layers of reinforcement to achieve the maximum BCR was 4. These differences; may be due to the differences in the material properties and the geometric dimensions of the geogrid used in the different studies
3. For any number of reinforcement layers and settlement ratio levels up to 2.5%, the
u
S BCR
BCR ≈0.80 . It appears that; with an increase in the reinforcement depth ratio, the normal force in the soil decreases; resulting in a corresponding decrease in the friction between the soil and reinforcement. Hence, placing the reinforcement at a greater embedment depth; does not increase the bearing capacity. The friction forces for circular foundations at a depth of 2B approches zero. Overall, the improvement in the foundation properties due to the reinforcement is attributed to the fact that the shearing strength of the soil column below the foundation is increased and the geogrid-sand system acts as a composit material and prevents the distribution of soil wedge failure below the foundations base.
368 ACKNOWLEDGMENT
We would like to express our sincere appreciation to Mr. Ted McDonnell for his valuable role in this research.
REFERENCES
1. Shin, E.C., Das, B.M., Lee, E.C. and Atalar, C. 2002. Bearing capacity of strip footing on geogrid reinforced sand. Geotechnical and Geological Engineering Journal. Vol. 20, pp.169-180
2. Adams, M.T. and Collin, J.C. 1997. Large model spread footing load tests on geosyntetic reinforced soil foundation. Journal of Geotechnical and Geoenvironmental Engineering. ASCE, Vol. 123, No. 1, pp. 66-72
3. Das, B.M. 1995. Principles of foundation engineering. 3rd Editions, PWS-Kent, Boston, M.A., USA
4. Yetimoglu, T., Wu, J.T.H., and Saglamar, A. 1994. Bearing capacity of rectangular footings on geogrid-reinforced sand. Journal of Geotechnical Engineering. ASCE, Vol. 120, No. 12, pp.2083-2099
5. Khing, K.H., Das, B.M., Puri, V.K., Cook, E.E. and Yen, S.C. 1993. The bearing capacity of a strip foundation on geogrid-reinforced sand. Geotextiles and Geomembrane. Vol. 12, No. 4. pp.351-361 6. Omar, M.T., Das, B.M., Yen, S.C., Puri, V.K. and
Cook, E.E. 1993. Ultimate bearing capacity of rectangular foundations on geogrid-reinforced sand. Geotechnical Testing Journal. ASTM, Vol. 15, No. 2, pp.246-252
7. Guido, V.A., Dong, K.G., and Sweeny, A. 1986. Comparison of geogrid and geotextile reinforced earth slabs. Canadian Geotechnical Journal. Vol. 23, No.1, pp. 435-440
8. Guido, V.A., Biesiadecki, G.L., and Sullivan, M.J. 1985. Bearing capacity of a geotextile reinforced foundation. Proc. 11th Int. Conf. Soil Mechanic and Foundation Engineering, San Francisco, California. Vo1. 3, pp. 1777-1780
9. Drucker D.C. and Prager, W. 1952. Soil mechanics and plastic analysis of limit design. Quart. Applied Mathematics. Vol. 10, No. 2
10. Pfeifle, T.W., and Das, B.M. 1979. Model test for bearing capacity in sand. Journal of Geotechnical Engineering. ASCE, Vol. 105, pp.1112-1116 11. Singh, H.R. 1988. Bearing capacity of reinforced
soil beds. Ph.D. Thesis . Indian Institute of Science, Bangalore, India
12. Akinmusuru, J.O., and Akinbolade, J.A. 1981. Stability of loaded footings on reinforced soil. Journal of Geotechnical Engineering. ASCE, Vol. 107, No. 6, pp.819-827
13. Guido, V.A., Knueppel, J.D., and Sweeny, A. 1987. Plate loading test on geogrid reinforced earth slabs. Proceedings Geosynthetics’ 87 Conference, New Orleans. pp216-225
14. Omar, M.T., Das, B.M., Puri, V.K, Cook, E.E., and Yen, S.C. 1994. Bearing capacity of foundation on geogrid-reinforced sand. Proc. 7th Int. Conf. on Mechanic and Foundation Engineering, Balkemia Rotterdam, The Netherland. Vol. 3, pp.1279-1282 15. Booshehrian, J.H. and Hatef, N. 2003.
Experimental and numerical investigation of the bearing capacity of model circular and ring footing on reinforced sand. Journal of Geotextiles and Geomembranes. Vol. 21, pp.241-256
16. Das, B.M., Omar, M.T. 1994. The effects of foundation width on model tests for bearing capacity of sand with geogrid reinforcement. Geotechnical and Geological Engineering Journal. Vol.12, No. 2, pp.133-141