Bacterial Genomes
Chuan Zhou1., Qin Ma2., Guojun Li1
*
1School of Mathematics, Shandong University, Jinan, China,2Computational Systems Biology Laboratory, Department of Biochemistry and Molecular Biology and Institute of Bioinformatics, University of Georgia, Athens, Georgia, United States of America
Abstract
About half of the protein-coding genes in prokaryotic genomes are organized into operons to facilitate co-regulation during transcription. With the evolution of genomes, operon structures are undergoing changes which could coordinate diverse gene expression patterns in response to various stimuli during the life cycle of a bacterial cell. Here we developed a graph-based model to elucidate the diversity of operon structures across a set of closely related bacterial genomes. In the constructed graph, each node represents one orthologous gene group (OGG) and a pair of nodes will be connected if any two genes, from the corresponding two OGGs respectively, are located in the same operon as immediate neighbors in any of the considered genomes. Through identifying the connected components in the above graph, we found that genes in a connected component are likely to be functionally related and these identified components tend to form treelike topology, such as paths and stars, corresponding to different biological mechanisms in transcriptional regulation as follows. Specifically, (i) a path-structure component integrates genes encoding a protein complex, such as ribosome; and (ii) a star-structure component not only groups related genes together, but also reflects the key functional roles of the central node of this component, such as the ABC transporter with a transporter permease and substrate-binding proteins surrounding it. Most interestingly, the genes from organisms with highly diverse living environments, i.e., biomass degraders and animal pathogens of clostridia in our study, can be clearly classified into different topological groups on some connected components.
Citation:Zhou C, Ma Q, Li G (2014) Elucidation of Operon Structures across Closely Related Bacterial Genomes. PLOS ONE 9(6): e100999. doi:10.1371/journal. pone.0100999
Editor:Valerie de Cre´cy-Lagard, University of Florida, United States of America ReceivedApril 1, 2014;AcceptedJune 1, 2014;PublishedJune 24, 2014
Copyright:ß2014 Zhou et al. This is an open-access article distributed under the terms of the Creative Commons Attribution License, which permits unrestricted use, distribution, and reproduction in any medium, provided the original author and source are credited.
Data Availability:The authors confirm that all data underlying the findings are fully available without restriction. Supporting Information files; All data are
Funding:This work was supported by 61272016 (http://www.nsfc.gov.cn/). GL received the funding. The funders had no role in study design, data collection and analysis, decision to publish, or preparation of the manuscript.
Competing Interests:The authors have declared that no competing interests exist. * Email: [email protected]
.These authors contributed equally to this work.
Introduction
Operons are basic transcription units in prokaryotic genomes and genes in an operon tend to be transcribed into a single mRNA and have related biological functions [1–3]. Operons undergo lots of changes in their content during evolution [4,5], which results in different operon structures across multiple organisms. Only a few operons are known to be conserved across distantly related organisms [3,6–8], which could be used for making functional inferences. Since more and more genomes have been completely sequenced and are accessible publicly, substantial amount of operons are predicted by high-accuracy programs [9–14] and are organized into well-maintained databases [15–19], such as DOOR2.0, which contains predicted operons for more than 2,000 prokaryotic genomes.
As proposed by Price MN [7], both operon creation and destruction could lead to large changes in gene expression patterns. Efficiently predicting conserved operons and analyzing their structures across a set of genomes can give us valuable clues to the functions and expression patterns of involved genes. Genomic co-localized gene pairs, which is a key factor in the prediction of operons [12,13,17], are used to analyze operon
conservation across a set of organisms [7,20]. However, the information alone could not capture the overall structural changes of a group of functionally related genes. For example, even though such a gene pair is identified in several operons from different organisms, these operons may have different structures by gaining or losing new genes due to specific requirements in transcriptional regulation [7]. Meanwhile, various similarity scores are defined between operons from different organisms [13–16] and could be used to identify conserved operon groups, however, they cannot decipher the complex operon topological linkages across a set of bacterial genomes.
metabolic or regulatory pathways; and (iii) different operon linkage patterns emerge in identified COCs, which corresponds to different relationships among the underlying genes.
Materials and Methods
Data
We downloaded 40 fully sequenced clostridial genomes from NCBI GenBank [22] as of December 2012, and their operons were retrieved from the DOOR2.0 database [15] (we only consider operons containing more than one genes). Out of these 40 organisms, 13 are biomass degraders [23–28], 21 are pathogens [29–35] and six are less characterized other kind [29,36,37]. Since above 40 genomes belong to 19 species, we selected one representative genome from each species (see Table 1 for details). A total of 41,738 OGGs were predicted using our in-house program GOST [38] following by the clustering tool MCL [39]. The ID for each OGG is assigned as its ranking in the output of MCL. It is worth noting that, in different OGGs, the ratio of genes between biomass degraders and pathogens varies and relative details can be found in File S1.
Construction of operon alignment graph
Firstly, we introduce some terminologies in graph theory, which will be used in the following model. A directed graphDconsists of a non-empty node set, V(D), and an edge set, A(D), connecting ordered pairs of nodes. For an edge (u,v),uis its tail andvis its head and the two nodes are called adjacent. A node is incident to an edgeeif it is the head or tail of the edge. The degree of a node is the number of edge incident with it. Without considering the direction of edges, a connected component ofDis a maximal sub-graph in which any pair of nodes is connected by at least one path
and if a connected graphDdoesn’t contain a cycle, it’s called a tree [40].
We defined an operon alignment graphGas a directed graph based on 19 clostridial genomes, with each node representing an OGG and a pair of nodes being connected by an edge if a pair of genes, from the two corresponding OGGs respectively, was immediate neighbors in an operon in at least one genome. Intuitively, an operon should correspond to a directed path in this graph as the single-gene operons are excluded in our study (see Figure 1). Specifically, considering three OGGsa,bandc, where genesa1, b1and c1were from these three groups respectively, if these three genes formed an operon A in a specific genome following the ordera1-b1-c1along the genome, we added two edges (a,b) and (b,c) in the operon alignment graph, and the gene pair (a1,b1) is called being mapped to edge (a,b) and operonAis called being mapped to the path (a,b,c). It is worth noting that the edge (a,c) will not be created asa1andc1are not consecutively located along the genome. The weight of an edge was defined as the number of gene pairs mapped to this edge, as multiple gene pairs could be mapped to the same edge when multiple genomes are considered in the model construction. After all gene pairs were added, we removed all isolated nodes (don’t incident with any edge) in the current graph, which led to the final operon alignment graphG.
Identification of connected operon components
In an operon alignment graph, the COCs were identified through removing the edges of weight one, which were considered to be not conserved in our model. Obviously, a COC is composed by a set of OGGs, whose genes prefer to stay in same operons across multiple related genomes. Here we only considered the COCs containing at least two OGGs. The conservation score of a
Table 1.The 19 clostridial organisms for constructing the operon alignment graph.
ID Type Organism #gene
#multi-gene operon
#gene in multi-gene operon
1 B thermocellum_ATCC_27405_uid57917 3173 596 1794
2 B beijerinckii_NCIMB_8052_uid58137 5020 872 2378
3 B phytofermentans_ISDg_uid58519 3902 722 1950
4 B cellulolyticum_H10_uid58709 3390 678 2146
5 B saccharolyticum_WM1_uid51419 4154 893 2874
6 B cellulovorans_743B_uid51503 4254 796 2279
7 B lentocellum_DSM_5427_uid49117 4182 842 2717
8 B clariflavum_DSM_19732_uid82345 3892 763 2157
9 B BNL1100_uid84307 3920 812 2610
10 B acetobutylicum_EA_2018_uid159515 3916 757 2346
11 P perfringens_13_uid57681 2723 490 1433
12 P tetani_E88_uid57683 2439 512 1558
13 P difficile_630_uid57679 3739 760 2335
14 P botulinum_H04402_065_uid162091 3691 721 2049
15 O novyi_NT_uid58643 2315 444 1432
16 O kluyveri_DSM_555_uid58885 3913 766 2356
17 O ljungdahlii_DSM_13528_uid50583 4184 848 2530
18 O sticklandii_DSM_519_uid59585 2573 517 1908
19 O SY8519_uid68705 2613 545 1750
Bfor biomass degrader,Pfor animal pathogen, andOfor the others. doi:10.1371/journal.pone.0100999.t001
COC was defined as the average weight of all its edges. Intuitively, the more conserved a COC is, the more operons were mapped to it. For example, the two COCs 1 and 2 in Figure 1 have conservation scores 2.5 and 2, respectively. We sorted all identified COCs in the decreasing order of the number of component OGGs, and used this ranking index as the ID of corresponding COC.
Functional enrichment analysis for COCs
For the nodes of a COC, we could do functional enrichment analysis of the corresponding genes with DAVID [41]. More specifically, given a set of OGGs, we picked their genes from a certain genome as templates, such as Clostridium thermocellum (C. thermocellum), which will be submitted to DAVID as the input gene list with this genome as background genome. Thep-values were calculated in terms of a Bonferroni-corrected modified Fisher’s exact test under the null hypothesis that this set of genes was not enriched with certain biological functions.
Cis-regulatorymotif analysis for COCs
Thecis-regulatory motif analyses were done with the BoBro2.0 toolkit [42,43] and a DNA motif analysis web server DMINDA [44]. For a specific COC, we collected all the leading genes of the involved operons, then picked the upstream intergenic regions of these genes as promoter sequences, with length at most 300 bps. In this study, we were particularly interested in biomass degraders and animal pathogens. Hence, thede-novomotif finding and motif comparison analyses were carried out regarding these two promoter groups [42,45].
Results
Construction of operon alignment graph of 19 clostridial genomes
In the 19 clostridial genomes, from 47% to 74% genes are in multi-gene operon. See Figure 2 and Table 1 for details. The
operon alignment graph, constructed using these genomes, contains 22,026 nodes (about 61.7% of all OGGs), 18,924 edges and forms 4,383 connected components. The largest component contains 6,350 OGGs and 7,275 edges (see Figure S1), and each of other components contains less than 400 OGGs. About 82% of edges are of weight one in this graph (Figure S2), which means that only one operon could be mapped to that edge. We suspect that such non-conserved relationship may be newly formed according to diverse living environment of Clostridia. These results show that the operon alignment graph is sparsely connected (the number of nodes is even larger than that of edges) and genes only tend to group with specific members through the operon linkage, which is consistent with the fact that operons often encode functionally linked proteins.
While the degrees of most of the nodes (97.7%) are less than six, only 117 nodes have degrees larger than ten (Figure S3). Such large-degree property of these nodes suggests that the genes in these orthologous groups tend to form operons with various kinds of genes which are involved in diverse biological functions. Functional analysis with DAVID shows that nucleoside binding proteins are significantly enriched in the large-degree gene set (p -value 5e-3), indicating that they can functionally work together with different kinds of proteins (see details in file S2).
Most of COCs adapt a tree structure and have a main functional theme
While the operon alignment graph gives us a global view of operon linkage patterns, we use COC to describe conserved operon connectivity among genes. We identified 157 COCs containing more than five OGGs, and 63% of them were trees; while 98% of all other COCs were trees. These tree structures are consistent with the sparseness of the operon alignment graph. We observed that genes in each COC usually had a main functional theme (the top eight COCs are listed in Table 2). As we show in the following examples, COCs can efficiently group functional Figure 1. Methodology outline.(A) Five orthologous gene groups and operons from four different genomes are given as an example; (B) Operon alignment graph with edge weight indicating the number operon pairs can be aligned to the edge; (C) The connected operon components are identified by removing the edges of weight one.
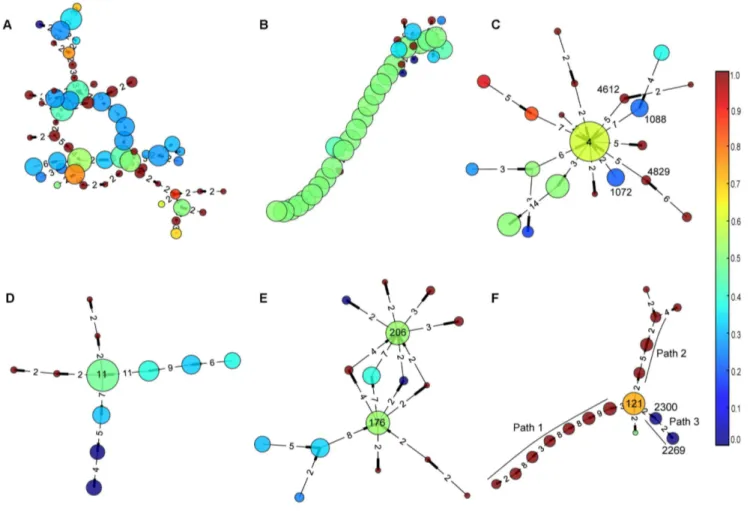
related genes together and be used to infer unknown gene functions. In Figure 3, we showcased some COCs, where node size is proportional to the number of genes in the OGG, the larger the more genes, color indicates the percentage of biomass degrader genes, red for more biomass degrader genes and blue for more pathogen genes, and the weights of edges are shown as numbers. More details can be found in File S3 and S4.
The largest COC contains 58 OGGs (Figure 3A). The DAVID analysis shows that, for the subset of genes contained in C. thermocellum, one functional cluster (enrichment score 8.54) contains about 73% of all genes (p-value 1.02e-11); and the GO TERM annotations suggest that these genes are mainly involved in porphyrin metabolic and biosynthetic process. Meanwhile for genes in Clostridium difficile 630 (C. difficile), one functional cluster (enrichment score 21.89,p-value 3.62e-29) contains more than 85% of all genes, which are related to porphyrim metabolic process and biosynthetic.
We have also identified 46 COCs with a simple path structure, which is an extremely simplified tree, such as COC#6 (Figure 3B) with 36 nodes and average weight as high as 9.93. DAVID analysis suggests that 81% of genes from C. thermocellum (enrichment score 22.6, p-value 3.00e-34) and 85% from C. difficile (enrich-ment score 24.3,p-value 1.07e-38) in COC#6 mainly correspond to ribosomal proteins. More detailed analysis with NCBI annotations shows that 30S ribosomal proteins S3, S5, S8, S10, S14, S17, S19 and 50S, ribosomal proteins L2, L3, L4, L5, L6, L14, L15, L16, L18, L22, L23, L24, L29, L30 and L36 are all contained in this group. Some other genes, such as translation initiation factor IF-1 is in this group too, which further confirms that this group is related to mRNA translation. It has been observed that most highly conserved operons tend to code protein complexes [20], and COC#6 supports this well because it include highly conserved operons that code proteins for ribosome, which is
known to be a large and complex molecular machine, found within all living cells.
Star-structure COCs and their central nodes
About 22 COCs have one or two central node(s) with most of the other nodes connect to it, which form a star structure. COC #13 (Figure 3C) has such a structure, with central node#4 being adjacent with more than ten nodes. We found that node#4 is an ABC transporter or ABC transporter like protein family, with one exception being a hypothetical protein. While the nodes surrounding it are mainly proteins related to ABC transporter, such as node #1088 and #1072 stand for amino acid ABC transporter permease, nodes#4612 and#4829 stand for polar amino acid ABC transporter inner membrane subunit. In the operons being mapped to COC #13, more ABC transporter related proteins could be found, such as extracellular amino acid-binding proteins and ABC transporter substrate-acid-binding proteins. See more details in File S3. Over all, the main theme of COC#13 is ABC transporter and related proteins, with ABC transporter proteins at the central position, which suggests this kind of protein has a central role in the formation of ABC transporter.
Another star shaped COC #54 is shown in Figure 3D. The central node #11 represents rod shape-determining protein MreB/Mbl; other rod shape-determining proteins MreC and MreD, and some membrane proteins surround it. Interestingly, the DNA repair protein RadC also appears in this COC and has a strong relation with node #11, which suggests some functional relationship between them. See more details in File S3.
Finally, in COC#29 (Figure 3E), there are four paths of length two connecting to node#176 and#206, which are ATP synthase F1 subunit alpha and beta, correspondingly. These surrounding nodes are all ATP synthase subunits gamma, but belong to different OGGs; we suspect they could have similar functions with different mechanisms. All other nodes in this COC are ATP Figure 2. Gene count and in-operon ratio for each organism.Genome IDs are listed in Table 1 and the operons are retrieved from DOOR2.0 database.
doi:10.1371/journal.pone.0100999.g002
synthase subunits except hypothetical proteins, which could give clues to annotate these genes as ATP synthase related. More details can be found in File S3.
The genes from biomass degraders and pathogens can be clearly separated in some COCs
Some OGGs are enriched with genes from biomass degraders and some others from pathogens (File S1). In eight specific COCs, these two kinds of nodes can clearly form different paths and are Figure 3. Six typical connected operon components.The size of node is proportional to the number of genes in corresponding orthologous gene group, the larger the more genes. The color indicates the proportion of genes from biomass degraders or pathogens in this group, where red color means more biomass-degrader genes while blue color represents more pathogen genes. The weights of edges are shown as numbers on the components. COC#1 in (A) is the largest COC, which contains 58 nodes, most of the genes are related to porphyrin metabolism; COC#6 in (B) contains a long path structure and mainly contains ribosomal proteins; COC#13,#54,#29 in (C), (D) and (E) respectively form the star structure; and COC#27 in (F) shows the biomass-degrader genes and pathogen genes as different topological parts.
doi:10.1371/journal.pone.0100999.g003
Table 2.COCs have a main functional theme through gene enrichment analysis.
COC id #node #edge
Edge average weight
Node maximum degree
Functional annotation from
DAVID enrichment score
1 58 66 3.09 7 porphyrin metabolic process 8.54
2 52 54 3.87 7 pyrimidine biosynthesis 4.41
3 51 51 4.9 5 Taxis 9.22
4 41 44 4.52 8 rRNA processing 1.84
5 40 44 3.18 8 nucleotide catabolic process 2.89
6 36 43 9.93 8 ribosomal protein 22.64
7 29 33 2.88 9 * *
8 25 24 2.25 4 metal ion binding 2.67
(*) no cluster identified.
connected by large-degree node(s), hence easily being classified. For example, in COC#27 (Figure 3F), two paths, namely path 1 and path 2, are formed by nodes mainly contain genes from biomass degraders, while path 3 with two nodes contain genes from pathogens. Node #121, connecting these 3 paths, corre-sponds to nitrogenase iron proteins. In path 3, node #2300 contains protein NifE2, nitrogenase cofactor scaffold and assemble proteins, however, 83% are hypothetical proteins; node #2269 contains NifE1 and nitrogenase vanadium-cofactor synthesis protein VnfN, also 83% are hypothetical proteins. In controversy, genes in paths 1 and 2 are mostly known proteins related to nitrogenase. Such as nitrogen regulatory protein P-II, nitrogenase cofactor biosynthesis protein NifB, molybdenum-iron protein subunit alpha and beta are found in path 1; while nitrogenase molybdenum-iron protein alpha and beta chains are found in path 2; these proteins are not found in pathogens, more details in File S3.
We suspect that the ability to fix atmospheric nitrogen gas (carried out by nitrogenase) is not as strongly needed in pathogens as in biomass degraders, so some related genes might be mutated or lost in pathogens due to genome reduction [46] during evolution. To infer the regulatory mechanism of these genes, we didde novomotif finding for groups of operons (genes) from biomass degraders and pathogens with BoBro2.0 as described in the METHODS section. The most significant motifs from these two groups are shown in Figure 4. The consensus of the motif from biomass degrader is ‘TTAATAATATTA’, and the one from pathogen is ‘AATTTTAATAATATTAAA’; the first is actually a sub-pattern of the second, but with higher information content (9.39versus5.16). It suggests that the same regulatory mechanism might be adopted by these two groups of genes, but the regulatory sequences are degenerating along with the losing of nitrogenase related genes in pathogens.
Discussion
Operon structures provide important clues for functional annotation of proteins [9]. However, which genes are placed together in operons varies substantially across bacterial organisms, and recently evolved operons are not suitable for inferring function of genes [7,47]. In our model, genes are linked by conserved operons from closely related genomes, which provide strong evidence for their functional relationship. Moreover, different linkage patterns could reflect the different roles of the underlying proteins. Overall, our model gives new insights on the organizing principles of genes in operons across closely related genomes and provides valuable clues for elucidating transcriptional regulation and predicting the function of genes.
Supporting Information
Figure S1 The largest connected component in the operon alignment graph of the 19 clostridial genomes.
(TIF)
Figure S2 Distribution of edge weight in the operon alignment graph.
(TIFF)
Figure S3 Distribution of node degree in the operon alignment graph.
(TIFF)
File S1 Orthologous gene groups of 19 clostridial organisms.All the orthologous gene groups are predicted with our in-house orthology identification tool GOST followed by the clustering program MCL.
(XLSX)
File S2 DAVID functional enrichment analysis for large-degree nodes.For each node, we pick the gene fromC. thermocellumas template for the functional analysis in DAVID. (XLSX)
File S3 GenBank annotations for selected COCs.
(XLSX)
File S4 COC details.Each COC file contains the nodes, edges and operons, from the 19 genomes, that could be align to this COC.
(RAR)
Acknowledgments
We want to thank the members of Computational Systems Biology Laboratory (CSBL) at the University of Georgia for their helpful discussions on the design of this model.
Author Contributions
Conceived and designed the experiments: CZ QM. Performed the experiments: CZ. Analyzed the data: CZ. Contributed to the writing of the manuscript: CZ QM GL.
References
1. Jacob F, Monod J (1961) On the Regulation of Gene Activity. Cold Spring Harb Symp Quant Biol 26: 193–211. doi:10.1101/SQB.1961.026.01.024. 2. de Daruvar A, Collado-Vides J, Valencia A (2002) Analysis of the Cellular
Functions of Escherichia coli Operons and Their Conservation in Bacillus subtilis. J Mol Evol 55: 211–221. doi:10.1007/s00239-002-2317-1.
3. Omelchenko MV, Makarova KS, Wolf YI, Rogozin IB, Koonin EV (2003) Evolution of mosaic operons by horizontal gene transfer and gene displacement in situ. Genome Biol 4: 1–18. doi:10.1186/gb-2003-4-9-r55.
4. Okuda S, Katayama T, Kawashima S, Goto S, Kanehisa M (2006) ODB: a database of operons accumulating known operons across multiple genomes. Nucleic Acids Res 34: D358–D362. doi:10.1093/nar/gkj037.
5. Mao F, Dam P, Chou J, Olman V, Xu Y (2009) DOOR: a database for prokaryotic operons. Nucleic Acids Res 37: D459–D463. doi:10.1093/nar/ gkn757.
6. Itoh T, Takemoto K, Mori H, Gojobori T (1999) Evolutionary instability of operon structures disclosed by sequence comparisons of complete microbial genomes. Mol Biol Evol 16: 332–346.
Figure 4. Motifs related to genes in COC 27. The first motif is identified from the promoters of genes in biomass degraders; and the other one is for pathogen.
doi:10.1371/journal.pone.0100999.g004
7. Price MN, Arkin AP, Alm EJ (2006) The Life-Cycle of Operons. PLoS Genet 2: e96. doi:10.1371/journal.pgen.0020096.
8. Wolf YI, Rogozin IB, Kondrashov AS, Koonin EV (2001) Genome Alignment, Evolution of Prokaryotic Genome Organization, and Prediction of Gene Function Using Genomic Context. Genome Res 11: 356–372. doi:10.1101/ gr.161901.
9. Brouwer RWW, Kuipers OP, van Hijum SAFT (2008) The relative value of operon predictions. Brief Bioinform 9: 367–375. doi:10.1093/bib/bbn019. 10. Taboada B, Verde C, Merino E (2010) High accuracy operon prediction
method based on STRING database scores. Nucleic Acids Res 38: e130–e130. doi:10.1093/nar/gkq254.
11. Zheng Y, Szustakowski JD, Fortnow L, Roberts RJ, Kasif S (2002) Computational Identification of Operons in Microbial Genomes. Genome Res 12: 1221–1230. doi:10.1101/gr.200602.
12. Li G, Che D, Xu Y (2009) A UNIVERSAL OPERON PREDICTOR FOR PROKARYOTIC GENOMES. J Bioinform Comput Biol 07: 19–38. doi:10.1142/S0219720009003984.
13. Dam P, Olman V, Harris K, Su Z, Xu Y (2007) Operon prediction using both genome-specific and general genomic information. Nucleic Acids Res 35: 288– 298. doi:10.1093/nar/gkl1018.
14. Ermolaeva MD, White O, Salzberg SL (2001) Prediction of operons in microbial genomes. Nucleic Acids Res 29: 1216–1221. doi:10.1093/nar/29.5.1216. 15. Mao X, Ma Q, Zhou C, Chen X, Zhang H, et al. (2013) DOOR 2.0: presenting
operons and their functions through dynamic and integrated views. Nucleic Acids Res 42: D654–D659. doi:10.1093/nar/gkt1048.
16. Okuda S, Yoshizawa AC (2011) ODB: a database for operon organizations, 2011 update. Nucleic Acids Res 39: D552–D555. doi:10.1093/nar/gkq1090. 17. Pertea M, Ayanbule K, Smedinghoff M, Salzberg SL (2009) OperonDB: a
comprehensive database of predicted operons in microbial genomes. Nucleic Acids Res 37: D479–D482. doi:10.1093/nar/gkn784.
18. Taboada B, Ciria R, Martinez-Guerrero CE, Merino E (2011) ProOpDB: Prokaryotic Operon DataBase. Nucleic Acids Res 40: D627–D631. doi:10.1093/nar/gkr1020.
19. Salgado H, Peralta-Gil M, Gama-Castro S, Santos-Zavaleta A, Muniz-Rascado L, et al. (2012) RegulonDB v8.0: omics data sets, evolutionary conservation, regulatory phrases, cross-validated gold standards and more. Nucleic Acids Res 41: D203–D213. doi:10.1093/nar/gks1201.
20. Dandekar T, Snel B, Huynen M, Bork P (1998) Conservation of gene order: a fingerprint of proteins that physically interact. Trends Biochem Sci 23: 324–328. doi:10.1016/S0968-0004(98)01274-2.
21. Zhou C, Ma Q, Mao Z, Yanbin Y, Ying X (2014) New Insights into Clostridia through Comparative Analyses of Their 40 Genomes. BioEnergy Res. doi: 10.1007/s12155-014-9486-9.
22. Benson DA, Karsch-Mizrachi I, Lipman DJ, Ostell J, Wheeler DL (2008) GenBank. Nucleic Acids Res 36: D25–D30. doi:10.1093/nar/gkm929. 23. Hemme CL, Mouttaki H, Lee YJ, Zhang G, Goodwin L, et al. (2010)
Sequencing of Multiple Clostridial Genomes Related to Biomass Conversion and Biofuel Production. J Bacteriol 192: 6494–6496. doi:10.1128/JB.01064-10. 24. No¨lling J, Breton G, Omelchenko MV, Makarova KS, Zeng Q, et al. (2001) Genome Sequence and Comparative Analysis of the Solvent-Producing Bacterium Clostridium acetobutylicum. J Bacteriol 183: 4823–4838. doi:10.1128/JB.183.16.4823-4838.2001.
25. Wang Y, Li X, Mao Y, Blaschek HP (2011) Single-nucleotide resolution analysis of the transcriptome structure of Clostridium beijerinckii NCIMB 8052 using RNA-Seq. BMC Genomics 12: 479. doi:10.1186/1471-2164-12-479. 26. Miller DA, Suen G, Bruce D, Copeland A, Cheng JF, et al. (2011) Complete
Genome Sequence of the Cellulose-Degrading Bacterium Cellulosilyticum lentocellum. J Bacteriol 193: 2357–2358. doi:10.1128/JB.00239-11. 27. Feinberg L, Foden J, Barrett T, Davenport KW, Bruce D, et al. (2011) Complete
Genome Sequence of the Cellulolytic Thermophile Clostridium thermocellum DSM1313. J Bacteriol 193: 2906–2907. doi:10.1128/JB.00322-11.
28. Ko¨pke M, Held C, Hujer S, Liesegang H, Wiezer A, et al. (2010) Clostridium ljungdahlii represents a microbial production platform based on syngas. Proc Natl Acad Sci 107: 13087–13092. doi:10.1073/pnas.1004716107.
29. Yokoyama S, Oshima K, Nomura I, Hattori M, Suzuki T (2011) Complete Genomic Sequence of the O-Desmethylangolensin-Producing Bacterium Clostridium rRNA Cluster XIVa Strain SY8519, Isolated from Adult Human Intestine. J Bacteriol 193: 5568–5569. doi:10.1128/JB.05637-11.
30. Skarin H, Ha˚fstro¨m T, Westerberg J, Segerman B (2011) Clostridium botulinum group III: a group with dual identity shaped by plasmids, phages and mobile elements. BMC Genomics 12: 185. doi:10.1186/1471-2164-12-185. 31. Seedorf H, Fricke WF, Veith B, Bru¨ggemann H, Liesegang H, et al. (2008) The
genome of Clostridium kluyveri, a strict anaerobe with unique metabolic features. Proc Natl Acad Sci 105: 2128–2133. doi:10.1073/pnas.0711093105. 32. Bettegowda C, Huang X, Lin J, Cheong I, Kohli M, et al. (2006) The genome
and transcriptomes of the anti-tumor agent Clostridium novyi-NT. Nat Biotechnol 24: 1573–1580. doi:10.1038/nbt1256.
33. Hill KK, Smith TJ, Helma CH, Ticknor LO, Foley BT, et al. (2007) Genetic Diversity among Botulinum Neurotoxin-Producing Clostridial Strains. J Bacteriol 189: 818–832. doi:10.1128/JB.01180-06.
34. Myers GSA, Rasko DA, Cheung JK, Ravel J, Seshadri R, et al. (2006) Skewed genomic variability in strains of the toxigenic bacterial pathogen, Clostridium perfringens. Genome Res 16: 1031–1040. doi:10.1101/gr.5238106.
35. Bru¨ggemann H, Ba¨umer S, Fricke WF, Wiezer A, Liesegang H, et al. (2003) The genome sequence of Clostridium tetani, the causative agent of tetanus disease. Proc Natl Acad Sci 100: 1316–1321. doi:10.1073/pnas.0335853100. 36. Pagani I, Liolios K, Jansson J, Chen IMA, Smirnova T, et al. (2011) The
Genomes OnLine Database (GOLD) v.4: status of genomic and metagenomic projects and their associated metadata. Nucleic Acids Res 40: D571–D579. doi:10.1093/nar/gkr1100.
37. Brazier JS, Duerden BI, Hall V, Salmon JE, Hood J, et al. (2002) Isolation and identification of Clostridium spp. from infections associated with the injection of drugs: experiences of a microbiological investigation team. J Med Microbiol 51: 985–989.
38. Li G, Ma Q, Mao X, Yin Y, Zhu X, et al. (2011) Integration of sequence-similarity and functional association information can overcome intrinsic problems in orthology mapping across bacterial genomes. Nucleic Acids Res 39: e150–e150. doi:10.1093/nar/gkr766.
39. van Dongen S (2001) Graph clustering by flow simulation. Available: http:// dspace.library.uu.nl/handle/1874/848. Accessed 2014 Mar 26.
40. Bang-Jensen J, Gutin G (2007) Theory, algorithms and applications. Springer Monogr Math Springer-Verl Lond Ltd Lond. Available: http://link.springer. com/content/pdf/10.1007/978-1-84800-998-1.pdf. Accessed 2014 Mar 26. 41. Huang DW, Sherman BT, Lempicki RA (2008) Systematic and integrative
analysis of large gene lists using DAVID bioinformatics resources. Nat Protoc 4: 44–57. doi:10.1038/nprot.2008.211.
42. Ma Q, Liu B, Zhou C, Yin Y, Li G, et al. (2013) An integrated toolkit for accurate prediction and analysis of cis-regulatory motifs at a genome scale. Bioinformatics 29: 2261–2268. doi:10.1093/bioinformatics/btt397.
43. Li G, Liu B, Ma Q, Xu Y (2011) A new framework for identifying cis-regulatory motifs in prokaryotes. Nucleic Acids Res 39: e42. doi:10.1093/nar/gkq948. 44. Qin M, Hanyuan Z, Xizeng M, Chuan Z, Bingqing L, et al. (2014) DMINDA:
An integrated web server for DNA motif identification and analyses. Nucleic Acids Res. In press.
45. Crooks GE, Hon G, Chandonia JM, Brenner SE (2004) WebLogo: A Sequence Logo Generator. Genome Res 14: 1188–1190. doi:10.1101/gr.849004. 46. Moran NA (2002) Microbial Minimalism: Genome Reduction in Bacterial
Pathogens. Cell 108: 583–586. doi:10.1016/S0092-8674(02)00665-7. 47. Rocha EPC (2006) Inference and Analysis of the Relative Stability of Bacterial