Evolutionary Signature in Eukaryotes Genome Networks
Ricardo M. Ferreira1., Jose´ Luiz Rybarczyk-Filho1., Rodrigo J. S. Dalmolin3., Mauro A. A. Castro1,2 , Jose´ C. F. Moreira3, Leonardo G. Brunnet1, Rita M. C. de Almeida1,2*
1Instituto de Fı´sica, Universidade Federal do Rio Grande do Sul, Porto Alegre, Brazil,2National Institute of Science and Technology for Complex Systems, Universidade Federal do Rio Grande do Sul, Porto Alegre, Brazil,3Departamento de Bioquı´mica, Universidade Federal do Rio Grande do Sul, Porto Alegre, Brazil
Abstract
Whole genome protein-protein association networks are not random and their topological properties stem from genome evolution mechanisms. In fact, more connected, but less clustered proteins are related to genes that, in general, present more paralogs as compared to other genes, indicating frequent previous gene duplication episodes. On the other hand, genes related to conserved biological functions present few or no paralogs and yield proteins that are highly connected and clustered. These general network characteristics must have an evolutionary explanation. Considering data from STRING database, we present here experimental evidence that, more than not being scale free, protein degree distributions of organisms present an increased probability for high degree nodes. Furthermore, based on this experimental evidence, we propose a simulation model for genome evolution, where genes in a network are either acquired de novo using a preferential attachment rule, or duplicated with a probability that linearly grows with gene degree and decreases with its clustering coefficient. For the first time a model yields results that simultaneously describe different topological distributions. Also, this model correctly predicts that, to produce protein-protein association networks with number of links and number of nodes in the observed range for Eukaryotes, it is necessary 90% of gene duplication and 10% ofde novo
gene acquisition. This scenario implies a universal mechanism for genome evolution.
Citation:Ferreira RM, Rybarczyk-Filho JL, Dalmolin RJS, Castro MAA, Moreira JCF, et al. (2013) Preferential Duplication of Intermodular Hub Genes: An Evolutionary Signature in Eukaryotes Genome Networks. PLoS ONE 8(2): e56579. doi:10.1371/journal.pone.0056579
Editor:Ying Xu, University of Georgia, United States of America
ReceivedApril 25, 2012;AcceptedJanuary 14, 2013;PublishedFebruary 21, 2013
Copyright:ß2013 Ferreira et al. This is an open-access article distributed under the terms of the Creative Commons Attribution License, which permits unrestricted use, distribution, and reproduction in any medium, provided the original author and source are credited.
Funding:This work has been partially funded by Brazilian agencies Conselho Nacional de Desenvolvimento Cientı´fico e Tecnolo´gico (CNPq), Coordenac¸a˜o de Aperfeic¸oamento de Pessoal de Nı´vel Superior (CAPES), and Fundac¸a˜o de Amparo a` Pesquisa do Estado do Rio Grande do Sul (FAPERGS). The funders had no role in study design, data collection and analysis, decision to publish, or preparation of the manuscript.
Competing Interests:The authors have declared that no competing interests exist.
* E-mail: [email protected]
.These authors contributed equally to this work.
Introduction
Genome evolution is determined first by the processes that modify DNA and then by those mechanisms that either neutrally keep or naturally select these mutations by their phenotypic effects. The connection between DNA variations and the consequent phenotypic alterations is far from being simple and is elusive to determine. However, it is reasonable to assume that, after evolutionary time spans, these DNA variation mechanisms have left their mark on the genome.
Phenotypic effects are consequence of the existing associations between proteins which rule cellular metabolism. As proteins are expressed from genes, protein-protein associations will express eventual changes in genotypes and are prone to natural selection. Consequently we may speculate that natural selection, by defining genome evolution mechanisms, has left its mark on organisms’ protein-protein association matrices. This is not a novel idea. Baraba´si and collaborators [1,2] have described genomes of different organisms as networks where nodes are either genes or proteins, and links correspond to associations between the nodes. They proposed an evolution dynamics for the genome considering that genes are sequentially added to a network following a preferential attachment rule: each newly incorporated gene
interacts with a gene already on the network with a probability that is proportional to its degree, that is, to the number of other genes with which it already interacts. The resulting artificial network is scale free and described well the available experimental data at that date.
However, the properties of a gene already in the network are not the only driving force for a novel gene attachment. There are different molecular mechanisms acting as novelty source in gene formation, such as exon shuffling, retroposition, mobile elements, horizontal gene transfer, gene duplication, etc., and the connec-tions of a new gene certainly reflect its origin together with the nature of the genes it connects to [3]. Although the relevance of these mechanisms differs between Eukaryotes and Prokaryotes, gene duplication is recognizably the most important and there is plenty of evidence that it plays an essential role on genome evolution [4]. One major feature of a duplicated gene consists of inheriting its parent connections and this property is determinant to the whole network design.
gene networks where the probability that a gene product is associated tokother proteins decays as a power law askincreases. A drawback for this approach, using randomly chosen genes, lays on the experimental fact that the probability to fix a given duplication episode greatly varies according to the properties of the duplicating gene [7–9].
Since the contributions by Baraba´si and collaborators, the amount and quality of data regarding both genomes and protein-protein association have greatly increased. For example, STRING database increased from few organisms at 2001 to 1133 organisms in 2011 [10–12]. Also, databases regarding protein-protein association for some organisms have been largely enhanced. Here we analyze data considering 31 core eukaryote organisms, which strongly suggest that highly connected genes stem from duplication mechanisms acting preferentially on genes that are highly connected, but not excessively clustered. These conclusions are made evident here by presenting the quantities as functions of
k kmax
, wherekmaxis the maximum degree in the network. We also
propose an adequate ordering for genes to globally illustrate topological properties of the protein-protein association matrix.
Considering these conclusions based on the information provided by STRING database we propose a genome evolution dynamics where the probability that a gene duplicates grows with its degree and decreases depending on how clustered it is. We also consider a Baraba´si mechanism of acquiring genesde novobased on preferential attachment. The results of these simulations are capable of describing different aspects of the network topology, besides predicting the ratio of duplicated and de novo acquired genes.
Results
Building Protein-protein Association Matrices
Many different gene networks may be built, depending on how nodes and links are defined. Regulatory gene networks, for example, consider regulation between genes to assign gene association [13], metabolic pathways may be represented by graphs where the direct interaction between gene products stand for links [14], or gene co-expression may be taken into account when specifying the connections in a gene network. Depending on how the network is built, genes present different network properties as their degree, clustering coefficient, centrality, etc.
Here we investigate the marks that evolution by natural selection has left on the topology of a gene network. Natural selection acts on the organism phenotype that is strongly defined by the organism genotype. Advantageous gene product associa-tions have certainly been selected, and probably the topology of these associations are a consequence of this selection pressure. Consequently, the gene network we must consider here is a network whose links may be acted on by natural selection. As virtually all kinds of associations between genes or gene products may end up with a phenotypic consequence, we must consider all kinds of associations. Furthermore, we will consider a genome evolution model describing only those genes that have already been selected to be conserved for evolutionary time spans.Building a gene network with all kinds of gene association (or gene product association) implies an extensive amount of work, which is only made possible by integrating the results obtained by different scientists, laboratories, and techniques. The techniques vary from very accurate ones, where the evidence for a gene-gene association has been observed in vivo by different laboratories, to high-throughput experiments where, for example, many gene products are assessed simultaneously in solutions that are not simulating the
interior of a cell. Also there may be predicted gene-gene association, based on computational inference by similarity between gene products in different organisms. Such a large diversity of techniques to assign gene-gene association leads to a variable confidence degree in the trueness of the results, and a confidence scoring is a necessary tool. The problem resides in controlling the degree of false positives, which is too high when all high-throughput evidence is considered, and of false negatives, which is too high when only evidence from very accurate experiments are taken into account.
Fortunately, STRING provides an integrated database for gene-gene association that considers different organisms and kinds of evidence, with the required control of a confidence score. Other databases yield different gene networks, but they eitheri)present a small number of organisms as compared with STRING,ii)assume specific criteria for assigning gene-gene associations (as only gene regulation [13] or only physical evidence of protein-protein association [15]) and/oriii)do not provide a confidence scoring aiming at false positives control. On the other hand, after choosing STRING as the adequate database, it is still necessary to choose the adequate value for the confidence score.
For that we produced gene networks for all 31 core eukaryote organisms in STRING database, version 8.3 [10–12], with confidence scores 0.400, 0.500, 0.600, and 0.700, 0.800, and 0.900 using ‘‘experimental’’ and ‘‘database’’ (95% of these interactions) added with ‘‘neighborhood’’, ‘‘fusion’’, ‘‘co-expres-sion’’, and ‘‘co-occurrence’’ evidence. Text S1 we discuss STRING confidence score and present a plot of number of links versus number of nodes considering all confidence scores for the six most studied eukaryotes: there is a sudden drop on the curves as the confidence scores grows from 0.800 to 0.900, signaling that many links are discarded at that point. We chose to work with confidence scores from 0.700 to 0.900.
Gene networks are built such that each node corresponds to a protein with at least one known protein-protein association, and links correspond to these associations. To each network nodeiwe assign a degree ki, which is its the number of links. For each organism and score we produce a network and calculate the probabilityP0ð Þk that a protein hasklinks, defined as
P’(k)~N(k)
N ð1Þ
whereNis the number of nodes andN kð Þis the number of nodes with degree k. To compare different organisms, with different genome sizes, we considered a rescaled degree to obtain the probability of finding a protein with a given degreek, as follows
P k
kmax
~kmaxp’(k), ð2Þ
wherekmax is the maximum degree in that network.
Figure 1a presents the average, taken at intervals of Dk
kmax
~0:02,
of the network degree distribution,P k kmax
versus k
kmax
for three
different confidence scores: 0.700, 0.800 and 0.900. The inset presents the degree distributions of all 31 core eukaryote organisms, with different colors for different scores. The blue line
in Fig. 1a is a power law fit,F k kmax
~0:02 k
kmax
{1:4
, which
describesP k kmax
for initial values of k
kmax
. At values of k
kmax
0.7, this degree distribution presents a local maximum, associated to the cloud of points with higher values of probability presented in the inset. The probability of proteins with degree near kmax
increases and indicates a genome evolution dynamics where high degree genes are probable to appear. As the main mechanism of genome evolution is gene duplication [3,4], it is reasonable to
assume that the local maximum inP k kmax
for large k
kmax
is due
to high duplication probability for more connected genes. Figure 1b presents the same data in a linear plot, where the
standard deviations for each average value of P k kmax
are
shown, to evince that deviations from the power law fit is significant. Each point is an average over 31 core eukaryote organisms, justifying a Z test for significance. The difference
between the power law fit and the average P k kmax
for
confidence score 0.800 is shown in the inset for Fig. 1b, in units
of standard deviations for P k kmax
, calculated at intervals of
k kmax
~0:02. The maximum in degree distribution is significantly
different from the power law. This is a novel result which has been
evinced by plotting the distributions as functions of k
kmax
, instead of
functions ofkor k
N. From now on, we shall refer to k kmax
as the
relative degree of a node, which varies in the interval (0,1).
Figure 1c plots, as a function of k
kmax
,the average clustering
coefficient SCTk =k
max
, defined as the fraction of existing
connections between the neighbors of a gene withkneighbors in
relation to the maximum number of such connectionsk(k{1) 2 . The inset in Fig. 1c individually shows the corresponding data for all core organisms. For all three scores this curve is initially constant, presenting local minimum and maximum for, roughly,
k kmax
&0:4and k kmax
&0:6, respectively, decreasing after that: the
most connected genes are not the maximally clustered. Observe
that, while the maximum inP k kmax
occurs for k
kmax
&0:7, the
maximum for the clustering coefficient occurs before that. Figure 1d plots the average relative degree of the neighbors
SknnTof a gene as a function of k kmax
. The inset individually shows
the corresponding data for all core organisms. For all scores this curve is initially increasing, presenting a local maximum at roughly
k kmax
&0:8, decreasing after that. It means that the most connected
genes are not connected only to the most connected genes.
Summarizing, these plots indicate thati) P k kmax
does not
follow a power law;ii)it presents a local maximum for k
kmax
&0:7;
iii) the clustering coefficient is not uniform, presenting a local minimum and maximum; andiv)the network is assortative up to
k kmax
&0:8, withSknnTdecreasing after that. These observations
suggest modules of high average degree which are highly clustered. This behavior is evinced by the superposition of data from a large
number of organisms, plotted against a normalized degree k
kmax
.
For comparison, in Text S2 we present plots where the degreekis normalized by the total number of genes of each organism: there this behavior is not as clearly unveiled.
We have also considered other databases. However, STRING agglutinates information from these other databases, with the further advantage of a confidence scoring. In Text S3 we explicitly present and discuss the same results for BIOGRID [15] and IRefweb [16], where we have also simulated a confidence scoring by neglecting all information in these databases that were scored as low confidence in STRING database: in these cases the results are the same as using STRING. In fact, compared to other databases, high confidence scoring in STRING is generally more stringent in what regards assigning protein-protein association based on techniques prone to false positives as high-throughput experi-ments.
There is another relevant aspect for genome evolution: Duplication events can be assessed by analyzing gene families,
i.e., genes sharing the same ancestral gene. Some gene families
have mainly orthologs, while others are composed by a great number of paralogs, indicating many duplication episodes [7,17]. The reason why some genes are prone to duplicate while others avoid duplication is controversial. However, duplication is clearly not randomly fixed and functional characteristics of the parent gene certainly influence new born genes fates. It has been discussed that genes presenting substrate promiscuity are prone to fix duplication while other genes avoid duplication because it probably leads to deleterious effects [18].
Protein-protein interaction networks properties have been used as evidence for genes with increased duplication probability. In particular, Prachumwat and Li have obtained a negative correlation between duplication and connectivity inSaccharomyces cerevisiae[19]. However, connectivityper seis somewhat ambiguous, since there are at least two classes of hub genes: (i) hubs taking part of biological modules, calledintramodular hubs; and (ii) hubs which connect biological modules, calledintermodular hubs. Intramodular hubs connect to several proteins which are highly connected among themselves and are jointly performing some biological task [20]. These hubs are hardly ever pleiotropic. On the other hand, intermodular hubs are generally pleiotropic and connect to different biological modules, interacting with different partners in different moments and/or different cellular compartments [21,22]. Mathematically these two kinds of hubs may be differentiated by using two node indices: connectivity and clustering coefficient. The first merely counts the number of interacting nodes with a given node. The second index measures the level of interactions between the neighbors of a given node.
Li and collaborators [23] demonstrated that highly connected proteins with low clustering coefficient (intermodular hubs) are more probable to stem from duplicated genes as compared with proteins that are highly connected and highly clustered (intra-modular hubs). According to these authors, intra(intra-modular hubs represent the network most stable and conservative part, while intermodular hubs represent evolutionary dynamic network regions with a high duplication rate. Similar results have been found by Fraser [21].
Genome Evolution Model
when they are more connected, but less clustered. Protein-protein association information may be organized as a binary matrix whose elements are noted by Mij, such that Mij~1 in case proteins labeled by indices i and j are associated and Mij~0 otherwise. Now, the clustering coefficient Ci for the ith gene is defined as [24,25]
Ci~ 2 kiðki{1Þ
XN
j~1
XN
l~1
MijMjlMli, ð4Þ
which gives the ratio of existing links between the neighbors of the gene ito the maximum possible number of such links (which is equal to the number of combinations ofkielements 2 by 2).
The duplication probability for theithgene is defined as
pDi~ kið1{CiÞ P
kj 1{Cj
, ð5Þ
where the denominator guarantees a normalized probability. This assumption reproduces the features shown by organisms protein-protein networks that i) degree distributions have a local
maximum for k
kmax
near 1 (Fig. 1) and ii) more clustered genes
are less prone to duplicate [7,22,26]. For illustration, in Text S4 we presents the average value of duplication probability versus the average evolutionary plasticity index (EPI) [7] for different metabolic pathways or gene families: there is a defined positive Figure 1. Topological quantities for all 31 core eukaryote organisms from STRING database. Three different confidence scores: 0.700, 0.800 and 0.900 (black, red and green lines in all graphs, respectively). All measurements are taken as functions of node degree rescaled by the maximum degree of the corresponding network,k=kmax. All averages were taken over intervalsDk=kmax~0:02. (a) Average degree distribution compared with a tentative power law fit (blue line). (b) Average degree distribution in linear scale, showing the increase in the degree distribution for higher degree. The inset presents the distance between the power law fit and the average of networks with score 0.800 measured in number of standard deviations. (c)Clustering coefficient and (d)mean nearest neighbor degree averaged over all core organisms. The insets in panels (a), (c), and (d) show individual results for all 31 core organisms for each score.
correlation between EPI and duplication probability as given by Eq.(5). Here we remark that the network properties as clustering coefficient or degree for each node must be obtained from the whole network, comprising all genes and protein-protein associ-ation. Genes that are intermodular hubs in the whole network may become intramodular when considering a partial network. Natural selection acts over the whole organism, consequently, when correlating network properties and evolutionary plasticity, one should consider all nodes and links. So, gene families as RNA binding proteins (RBP) [20], for example, must be considered as a part of the whole genome, that is, the links with other proteins must also be considered when calculating their network properties. Simulations start with 5 nodes, each linked to two others, forming a ring. To acquire a new gene we first choose eitherde novo
mechanism, with probabilityð1{qÞ, or duplication, with proba-bilityq. If thede novomechanism is chosen, each existing nodeiis
linked to the new one with probabilityPki kj
, and the procedure is
repeated until the new node presents at least one link. In case of
duplication, the node to be duplicated is chosen by using the probability defined in Eq.(5). Duplication implies creating a new node linked to its parent and with the same neighbors.
After duplication, mutations are implemented by deleting links between either the parent or the child with a common neighbor with probabilitym. In fact, a hallmark of gene duplication is the subsequent speciation of at least one gene copy [27].
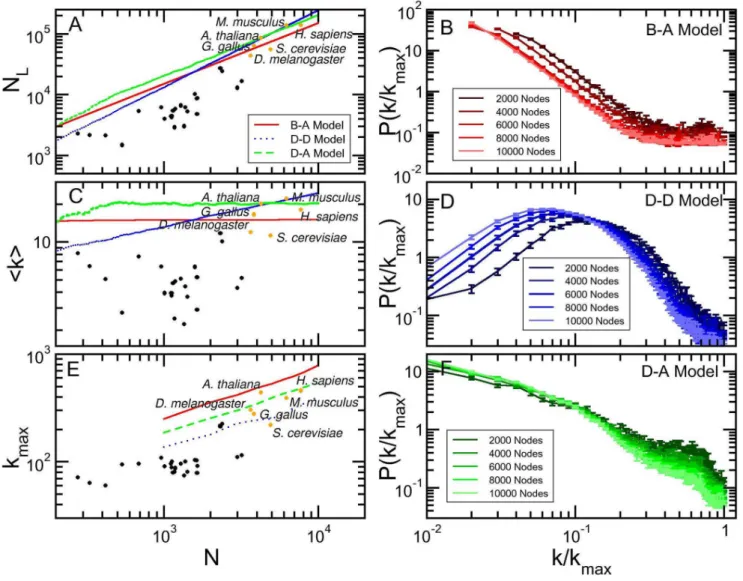
To compare with simulated genome evolution dynamics we chose those organisms for which there is more information regarding protein-protein association. Figure 2a shows the number of links versus the number of genes for the 31 core eukaryote organisms for 0.800 confidence score. Observe that data for very well studied organisms present larger numbers of genes and links, that is, more information is available. In what follows we considered 6 organisms, marked with orange dots in Fig. 2a (Homo sapiens,Mus musculus,Arabidopsis thaliana, Drosophila melanoga-ster, Saccharomyces cerevisiae,andGallus gallus).
The present simulation model has two parameters, duplication probabilityqand mutation probabilitym. For the numbers of links
Figure 2. Evolution of simulated models. Baraba´si-Albert, duplication-divergence and duplication-acquisiton networks (red, blue and green lines, respectively). The black dots represent all core organisms from STRING database, where six well studied organisms are highlighted in orange. (a) Number of links, (c) mean degree and (e) maximum degree are shown as functions of the total number of nodes in the network. The degree distribution was calculated in five snapshots of the evolution of (b) Baraba´si-Albert, (d) duplication-divergence, and (f) duplication-acquisition models, in intervals of 2000 nodes.
and genes of simulated networks to fall in the same intervals as more extensively investigated organisms (Fig. 2a),qmust be of the order of 0.90, which is experimentally verified: Zhouet al. [4] have studied Drosophila melanogaster genome and compared to other organisms in D. melanogaster subgroup. They have found that duplication is responsible for 80% of new genes, and 10% is generated by retroposition, here taken as an additional form of gene duplication. We are left with one single parameter,m, set to 0.05 to match the observed relation between number of links and nodes presented by protein-protein association matrices of real organisms (Fig. 2a). Results for different values of these parameters are discussed in Text S5.
We also simulated two other well described models for genome evolution: Baraba´si and Albert model [1], based on a preferential attachment rule, and Vazquezet al.[5,6] model, where genomes are built by duplicating randomly chosen genes. For both models, parameters are set to ensure that the number of links and nodes are roughly the same as in the protein-protein association networks obtained from STRING database for confidence score 0.800 (For other parameter values, see Text S5). In Baraba´si-Albert model, each new node is connected with 15 neighbors, and in the duplication-divergence model each node is linked with its parent, and has 0.4 of mutation probability. For brevity, we considered the most cited models in the literature although other interesting models also address genome growth [28–31].
Figs. 2a, 2c, and 2e present, as a function of N, the plots of number of linksNL, average degreeSkT, and maximum degree, kmax, for experimental results (dots) and simulated models (solid
lines). As discussed, the chosen model parameters ensure that the simulated number of links crosses the region with best investigated organisms (orange dots). The experimental points indicate that the number of links is proportional to the number of nodes, that is,
NL*N1. This behavior is clearly shown by both Baraba´si-Albert and our model, and is further evinced by Fig. 2c, that shows a constant average degree for experimental dots and these two models. Finally, Fig. 2e shows that, for the simulations, kmax
increases with, roughly, ffiffiffiffiffi N p
. The results for organisms are not in contradiction, although they are not conclusive. Anyway, this behavior explains why usingkmaxinstead ofNas the normalization
constant in Eq. 2 yields different results.
Figs. 2b, 2d, and 2f presentP k kmax
versus k
kmax
for the three
simulated models, measured in networks of different sizes. Observe that clearly Baraba´si-Albert and our model converge to a scaling invariant distributions that superpose as N??, while for
Va´zquez (D–D) model this convergence is either not true or too slow. This is a relevant point: although real genomes are finite, we may speculate that when large enough they present a scale invariant degree distribution. If this is true, the data collapse predicted by scaling invariance, together with a significant fit of the collapsed degree distribution of all core organisms, is as a strong evidence of a common mechanism universally ruling eukaryotes genome growth.
On the other hand, degree distributions for real organisms may present finite size effects. For example, both STRING data and D–A model results show that smaller networks present a higher
local maximum inP k kmax
for large k
kmax
. To properly compare
the simulations results with experimental networks with variable sizes, we considered a weighted average of the degree distribution, as follows.
For each model, we produced 10 samples in each size range, with size ranges beingNv1000,1000vNv2000, …,6000vN,
and obtained the distributions of degree, clustering coefficient, and
average degree of the neighbors as functions of k
kmax
. To compare
with the set of all 31 core eukaryote organisms, presenting, respectively, 6, 15, 2, 4, 2, 0 and 2 organisms in each size range, we produced weighted averages over the size ranges for the topological distributions, using the weights 6/31, 15/31, 2/31, 4/ 31, 2/31, 0/31 and 2/31. These results are shown in Fig. 3.
Other parameters values in each model yield different results, as discussed in Text S5: the description of topological quantities are worse in these cases. Similar averages for the six, best investigated organisms are shown in Figure S1.
Duplication-acquisition Model Reproduces the Topology of Protein-protein Association Networks
For each network, we calculated the weighted average for
probabilityP k kmax
, the clustering coefficient SCTk =k
max
, and
the relative degreeSknnTk
=k
max
of the neighbors of a node with
degree, defined as
SknnTk
=k
max
~ 1
N kð Þ XN
i~1
dðki{kÞ ki
Xki
SjTi kj kmax
, ð6Þ
whereSjTistands for a sum over the nodesjthat are neighbors to nodei, anddðki{kÞ~1ifk~kianddðki{kÞ~0otherwise.
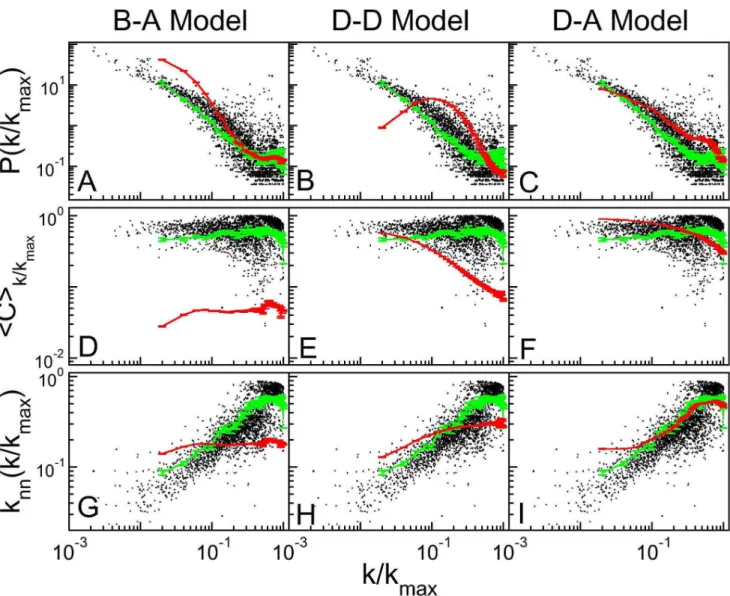
The black dots in Fig. 3 refer to protein-protein association networks of the 31 core eukaryote organisms. All plots indicate
large clustering coefficients for all degrees, decreasing as k
kmax
approaches 1: very high degree nodes are less clustered than less connected nodes. In organisms, the average number of connec-tions of the neighbors,SknnT, first increases with the node degree and then decreases, reinforcing the fact of very high degree nodes not presenting the largest clustering coefficient. Figure 3 presents three columns, one for each model, where we showi)raw data for the 31 eukaryotes as black points, weighted averages forii)the 31 eukaryotes as green lines and foriii)simulation as red lines. The first column shows that B–A model produces a degree distribution that follows a power law, a clustering coefficient that is roughly constant at a value much less than those shown by the organisms
data. Furthermore,SknnTdoes not depend on k kmax
. The deviation
from the STRING dots reflects that Baraba´si-Albert model yield scale free networks with a global central hub.
The second column presents the results for the Duplication-Divergence (D–D) model. Here, this distribution clearly does not follow a power law, due to the chosen parameters (link deleting probability of 0.4), that fixed the ratio of number of links to number of nodes at the desired values (see Fig. 2a). The average clustering coefficient decreases too abruptly, as compared to organisms data: as degree increases, the clustering decreases as
* k
kmax
{0:7
. However, the average degree of the neighbors
presents a mild increase, meaning that genes connect to groups of genes with slightly larger degrees.
The third column in Fig. 3 refers to the results of our model. In
Fig. 3c,P k kmax
describes very well the data from STRING. For
high values of k
kmax
maximum as shown by real organisms, although for smaller degrees. The clustering coefficient, shown in Fig. 3f, describes the major part of the interval, presenting a more intense decrease as
k kmax
?1. The varying character of assortativeness as k kmax
increases is also evident in Fig. 3i: SknnT first increases to a maximum up to0:45kmax.
Comparing the three columns we conclude that D–A model better catches the topological properties of protein-protein association networks, according to the currently available data in STRING, although the description is not perfect.
Global Aspect of Protein-protein Association Matrix
Furthermore, to evince global properties of the networks, the protein-protein association data that is organized on the matrixM
where each axis represents the protein list in a given order. The matrix elementsMijare assigned with value 1 (0) if there is (not) an association between the genes at positions iandjof the list. For
illustrational purposes, these association matrices may be repre-sented by plots where a black dot at positionði,jÞindicates that
Mij~1.
We obtain the sets of genes of each organism from STRING database and dispose them in randomly ordered lists. Each possible order for a gene list implies a different configuration for matrixM, for which a cost functionEmay be defined as
E~X
N
i~1
XN
j=i
di ja DMi,j{Miz1,jDzDMi,j{Mi{1,jD zDMi,j{Mi,jz1DzDMi,j{Mi,j{1D
, ð7Þ
where di j~
ffiffiffiffiffiffiffiffiffiffiffiffiffiffiffiffi
Di2{j2D
p
is proportional to the distance on the matrix from the pointð Þi,j to the diagonal (wheni~j), andais a parameter, here taken a~8. Minimization of this function, by changing the genes localization on the list, implies approximating mutually interacting genes, as discussed by Rybarczyk-Filhoet al. [32].
Figure 3.Comparison of topological measures for simulated networks.The black dots represent the superposed networks for all core organisms from string database with confidence score 0.800, the green lines are averages taken in intervals ofDk=k
max~0:02, and the red lines are weighted averages of simulated networks. The upper, central, and lower rows show, respectively, degree distribution, clustering coefficient, and nearest neighbor mean degree. Each column refers to a simulated model: Baraba´si-Albert on the left, duplication-divergence on the center and duplication-acquisition on the right.
The ordering algorithm starts from a randomly ordered matrix configuration and proceeds by randomly choosing a pair of genes whose positions are tentatively swapped. The cost function for this changed configuration is calculated and, in case the cost decreases, the change is accepted. If the cost function increases byDE, the
change is accepted with probability e{DE=T, where T is a parameter. This procedure is intended to avoid metastable states in the optimization of Eq.(3). Finally, whenDE~0, the change is accepted with 50% probability. The algorithm proceeds by randomly choosing another pair of genes and the procedure is repeated until the value of the cost function is stabilized.
Randomly ordered lists yield association matrix configurations with black dots spread over the whole plot. Ordering the gene list by minimizing the cost function evinces topological properties of protein-protein association networks. Figure 4a–f presents the ordered matrices for the six organisms listed above. Observe that points concentrate near the diagonal, implying that there may be an association (Mij~1) between the products of genes localized at not far apart positions i and j. Not all networks may be put in formats like those shown by Figs. 4a–f. See Fig. 4-g which represents a network built using Baraba´si-Albert algorithm, or an Erdo¨s-Re´nyi network, presented on Text S6. In fact, this format
reveals that genomes (Figs. 4a–f) do not present one central hub linked to the whole network (which could indicate scale free networks) but, contrarily, present many hubs with neighborhoods that do not span the entire system.
Figures 4g–i present ordered association matrices for simulated networks. Baraba´si-Albert (B–A) model (Fig. 4g) clearly shows only one module, with a central hub connected to all network. Duplication-Divergence (D–D) model, on the other hand, shows a slimmer structure around the diagonal, and Duplication-Acquisition (D–A) model presents a central hub not connected to the whole network. The ordering algorithm is further discussed in Text S6, where the same panels as Figure 4 are presented, but zooming at the central regions: the hierarchical structure of clusters, evinced by small solid squares, is clearly present in organisms and Duplication-Acquisition model. In Text S6 we also present the orderings obtained witha~1, which stresses further the clustered structures.
Together, figures 1 and 4 evince different aspects of real genomes. First, degree distribution is not a power law. Second, there is an accumulation of high degree nodes, which may be explained by an enhanced duplication probability for highly Figure 4. Ordered association matrices.This figure presents the association matrices forHomo sapiens,Mus musculus, Arabidopsis thaliana, Drosophila melanogaster, Saccharomyces cerevisiae, Gallus gallus, Barba´si-Albert model, duplication-divergence model and duplication-acquisition model after running the ordering algorithm. The black dots represent protein-protein association between two nodes.
connected gene products. Finally, hub genes are not central to the whole network, which presents hierarchical clusters.
Discussion and Conclusions
In this paper we have presented evidence obtained from protein-protein association data that degree distribution is not scale free, presenting an increased probability for high degree nodes, and that there are a few hub nodes in these networks, probably organized in a hierarchical way. Furthermore, when scaled by the maximum degree in each network,kmax, the degree
distribution seems to approach a scale invariant state as the number of genes in the network increases. However, real genomes still present finite size effects. This scenario indicates a universal mechanism for genome evolution.
The understanding of genome growth mechanisms is a central point in evolutionary biology. It is well established that gene duplication is the main process for new genes emergence. Therefore, it is reasonable to think that gene duplication represents an essential feature for genome evolution. This idea has been used by Va´zquez in his genome evolution model including gene duplication as genetic novelty source [5,6]. However, in that model, genes are randomly chosen to duplicate whereas experimental evidence indicates that gene duplication is not random. There are huge differences in the fixation probability of a gene duplication event. Depending on gene niche, the new copy could be selectively fixed or eliminated [18]. This concept becomes clear when gene families are assessed. There are some gene families composed basically by vertically inherence (i.e.
orthologs), without duplication episodes. On the other hand, there are gene families composed by great number of duplication-generated genes (i.e.paralogs) [7,17]. The question is what gene characteristics will increase the fixation probability of its duplica-tion?
The local maximum shown in Figure 1a gives us a clue about gene duplication dynamics. According to the figure, there is an increased probability of very connected proteins, indicating a genome evolution dynamics favoring hub genes emergence. However, as discussed previously, there are at least two very distinct classes of hub genes: (i)intramodular hubs, presenting high degree and high clustering coefficient, and (ii) intermodular hubs, presenting high degree and low clustering coefficient. The first one takes part in modules, which generally comprises intricate biological systems where all proteins exercise coordinate functions. In many of those systems, stoichiometry relationship is needed and a duplication event could be deleterious to the whole system. The second connects different modules, commonly exercising pleiotro-pic functions. Gene duplication theories always associate the fixation of the new-born gene copy with new function develop-ment [27]. Additionally, a gene performing more than one function - when each function cannot be independently optimized - could benefit from a duplication event where each gene copy is rendered free to independently optimize different functions [33].
Intermodular hubs have been discussed as targets of gene duplication [23]. This feature can be explained by the catalytic versatility of intermodular hubs [34]. These promiscuous activities often serve as starting points for the evolution of new functions if, or when, necessary [35]. Example of intermodular hubs, members of the Per-Arnt-Sim (PAS) receptor family recognize a huge variability of ligands, from photons to polyaromatic hydrocarbons. This receptor family presents 34 proteins in mammals and thousand proteins among genomes of many other species, evincing lots of duplication episodes [36]. Also, Szklarczyket al.have shown that for yeast in nearly 70% of small scale duplication events, the
paralogs do not remain working in the same complex and in at least 40% their ancestor gene should participate in more than one biological module [37].
On the other hand, intramodular hubs are associated to ancient networks that have reached their architecture early in evolution and any modification can affect their homeostasis [7]. This fact is well exemplified by ribosomes and DNA repair mechanisms, both very ancient systems with modular network architecture and both composed by genes with almost none duplication episode fixed though their evolutionary history [7,20].
Finally, a clear positive correlation between the network quantityk(1{C) averaged over gene families and the average evolutionary plasticity index as discussed in Text S4 further supports the idea of intermodular hubs as preferential gene duplication targets in comparison to intramodular hubs.
Here, we propose a simulation model for genome evolution, Duplication-Acquisition model, where genes in a network are either duplicated or acquired de novo using a preferential attachment rule. However, according to our model, genes are not arbitrarily chosen to duplicate: the duplication probability linearly grows with gene degree and decreases with its clustering coefficient. In other words, intermodular hubs have increased probability to duplicate. With this simple rule, topological distributions of biological networks are well described. This model correctly predicts that, to produce protein-protein association networks with number of links and number of nodes in the observed range for eukaryotes, it is necessary 90% of gene duplication and 10% ofde novogene acquisition.
A final remark on the model contemplates whole genome duplication, which is not explicitly taken into account. However, such a duplication in the first moment would not change the results, since each gene would be connected to twice the number of other nodes and, as also kmax duplicates, the relative degree of
each node, k
kmax
remains the same. In a second moment, there
could be more room for evolution, but in this case, the fixation probability would follow the same reasoning as in the original model. So, we do not expect that whole genome duplication would greatly change the genome topological distributions as compared to our model.
To compare the networks we ordered gene lists for each organism and model to produce protein-protein association matrices yielding images of the network association structure. These images give a global assessment of the networks, suggesting that there is a system scale that is less than its size (see Fig. 4), with, possibly, a hierarchical modular organization, as predicted by the Duplication-Acquisition model (see Text S6).
The simulation model is not perfect. Phenotypic effects caused by gene acquisition, duplication, or mutation cannot be fully grasped by network gene properties only and, consequently, this model is an over-simplification. However it does point towards a positive correlation between duplication probability and degree, while indicating a negative correlation between duplication probability and clustering coefficient. Consequently, Duplication-Acquisition model suggest how and where evolution works to build genetic novelty.
Supporting Information
gallus), red lines are averages of these networks taken in intervals
k=
kmax~0:02, and green lines are weighted averages of simulated
networks. Upper, central, and lower rows show, respectively, degree distribution, clustering coefficient, and nearest neighbor mean degree. Each column refers to a simulated model: Baraba´si-Albert on the left, duplication-divergence on the center and duplication-acquisition on the right.
(TIFF)
Text S1 STRING confidence score.In this text we discuss the choice of STRING confidence score and its effect in the number of links and nodes for six organisms networks.
(PDF)
Text S2 Degree normalization. In this text we discuss the effect of a different normalization when comparing several different networks, and how the adequate normalization can evince topological properties.
(PDF)
Text S3 Comparison with other databases. STRING database is compared with BioGRID an iRefWeb databases. (PDF)
Text S4 Correlation between network properties and Evolutionary Plasticity Index (EPI).In this text we present and discuss a plot of the average duplication probability for different gene families versus the average Evolutionary Plasticity
Index (EPI), in order to further support the model assumption of a duplication probability.
(PDF)
Text S5 Parameters of the models.In this text we discuss the choice of parameters in Baraba´si-Albert, Duplication-Diver-gence, and Duplication-Acquisition models.
(PDF)
Text S6 Ordering Algorithm.In this text we further discuss the ordering algorithm, and present some properties of networks that can be evinced with this algorithm.
(PDF)
Acknowledgments
We acknowledge fruitful discussions with Prof. Diego Bonnato, Centro de Biotecnologia, and support from the Centro de Fı´sica Computacional, Universidade Federal do Rio Grande do Sul.
Author Contributions
Conceived and designed the experiments: LGB RMCdA. Performed the experiments: RMF RJSD JLR-F. Analyzed the data: RMF JLR-F RJSD MAAC JCFM LGB RMCdA. Contributed reagents/materials/analysis tools: RMF JLR-F RJSD MAAC JCFM LGB RMCdA. Wrote the paper: RMF JLR-F RJSD MAAC JCFM LGB RMCdA.
References
1. Barabasi AL, Albert R (1999) Emergence of scaling in random networks. Science 286: 509–512. 7898 [pii].
2. Jeong H, Tombor B, Albert R, Oltvai ZN, Barabasi AL (2000) The large-scale organization of metabolic networks. Nature 407: 651–654. 10.1038/35036627 [doi].
3. Long M, Betran E, Thornton K, Wang W (2003) The origin of new genes: glimpses from the young and old. Nat Rev Genet 4: 865–875.
4. Zhou Q, Zhang G, Zhang Y, Xu S, Zhao R, et al. (2008) On the origin of new genes in Drosophila. Genome Res 18: 1446–1455. gr.076588.108 [pii];10.1101/ gr.076588.108 [doi].
5. Va´zquez A, Flammini A, Maritan A, Vespignani A (2003) Modeling of Protein Interaction Networks. Complexus 1: 38–44.
6. Va´zquez A (2003) Growing network with local rules: preferential attachment, clustering hierarchy, and degree correlations. Phys Rev E Stat Nonlin Soft Matter Phys 67: 056104.
7. Dalmolin R, Castro M, Rybarczyk Filho J, Souza L, de Almeida R, et al. (2011) Evolutionary plasticity determination by orthologous groups distribution. Biology Direct 6: 22.
8. Koonin EV, Wolf YI (2010) Constraints and plasticity in genome and molecular-phenome evolution. Nat Rev Genet 11: 487–498. nrg2810 [pii];10.1038/ nrg2810 [doi].
9. Wall DP, Hirsh AE, Fraser HB, Kumm J, Giaever G, et al. (2005) Functional genomic analysis of the rates of protein evolution. Proc Natl Acad Sci U S A 102: 5483–5488. 0501761102 [pii];10.1073/pnas.0501761102 [doi].
10. Jensen LJ, Kuhn M, Stark M, Chaffron S, Creevey C, et al (2009) STRING 8–a global view on proteins and their functional interactions in 630 organisms. Nucl Acids Res 37: D412–D416.
11. von Mering C, Jensen LJ, Snel B, Hooper SD, Krupp M, et al. (2005) STRING: known and predicted protein-protein associations, integrated and transferred across organisms. Nucl Acids Res 33: D433–D437.
12. von Mering C, Jensen LJ, Kuhn M, Chaffron S, Doerks T, et al (2007) STRING 7–recent developments in the integration and prediction of protein interactions. Nucl Acids Res 35: D358–D362.
13. Schlitt T, Brazma A (2007) Current approaches to gene regulatory network Modeling. BMC Bioinformatics, 8(Suppl 6): S9. 10.1186/1471-2105-8-S6-S9 [doi].
14. Kanehisa M., Goto S., Sato Y., Furumichi M., and Tanabe M. (2012) KEGG for integration and interpretation of large-scale molecular datasets. Nucleic Acids Res. 40, D109–D114.
15. Stark C, Breitkreutz BJ, Chatr-Aryamontri A, Boucher L, Oughtred R, et al. (2010) The BioGRID Interaction Database: 2011 update. Nucleic Acids Res. 9 (Database issue): D698–D704.
16. Turner B, Razick S, Trinsky AL, Vlasblom J, Crowdy EK, et al. (2010) iRefWeb: interactive analysis of consolidated protein interaction data and their supporting evidence. Database (Oxford) 10.1093/database/baq023 [doi].
17. Koonin EV, Fedorova ND, Jackson JD, Jacobs AR, Krylov DM, et al. (2004) A comprehensive evolutionary classification of proteins encoded in complete eukaryotic genomes. Genome Biol 5: R7.
18. Conant GC, Wolfe KH (2008) Turning a hobby into a job: How duplicated genes find new functions. Nat Rev Genet 9: 938–950.
19. Prachumwat A and Li W-H (2006) Protein function, connectivity, and duplicability in yeast. Mol. Biol. Evol. 23: 30–39.
20. Mittal M, Scherrer T, Gerber AP, Janga SC (2011) Interplay between posttranscriptional and posttranslational interactions of RNA-binding proteins. J. Mol. Biol. 409, 466–479 doi: 10.1016/j.jmb.2011.03.064.
21. Fraser HB (2005) Modularity and evolutionary constraint on proteins. Nat Genet 37: 351–352.
22. Han J-D J, Bertin N, Hao T, Goldberg DS, Berriz GF, et al. (2004) Evidence for dynamically organized modularity in the yeast protein-protein interaction network. Nature 430 88–93 doi:10.1038/nature02555.
23. Li L, Huang Y, Xia X, Sun Z (2006) Preferential Duplication in the Sparse Part of Yeast Protein Interaction Network. Mol Biol Evol 23: 2467–2473. 24. Colizza V, Flammini A, Maritan A, Vespignani A (2005) Characterization and
modeling of protein-protein interaction networks. Physica A: Statistical Mechanics and its Applications 352: 1–27.
25. Costa LD, Rodrigues FA, Travieso G, Boas PRV (2007) Characterization of complex networks: A survey of measurements. Advances in Physics 56: 167–242. 26. Castro MA, Dalmolin RJ, Moreira JC, Mombach JC, de Almeida RMC (2008) Evolutionary origins of human apoptosis and genome-stability gene networks. Nucleic Acids Res 36: 6269–6283.
27. Innan H, Kondrashov F (2010) The evolution of gene duplications: classifying and distinguishing between models. Nat Rev Genet 11: 97–108.
28. Berg J, Lassig M, Wagner A (2004) Structure and evolution of protein interaction networks: a statistical model for link dynamics and gene duplications. BMC Evol Biol 4: 51. 1471-2148-4-51 [pii];10.1186/1471-2148-4-51 [doi]. 29. Evlampiev K, Isambert H (2007) Modeling protein network evolution under
genome duplication and domain shuffling. BMC Syst Biol 1: 49. 1752-0509-1-49 [pii];10.1186/1752-0509-1-49 [doi].
30. Kim WK, Marcotte EM (2008) Age-Dependent Evolution of the Yeast Protein Interaction Network Suggests a Limited Role of Gene Duplication and Divergence. PLoS Comput Biol 4: e1000232.
31. Takemoto K, Oosawa C (2007) Modeling for evolving biological networks with scale-free connectivity, hierarchical modularity, and disassortativity. Math Biosci 208: 454–468. S0025-5564(06)00224-0 [pii];10.1016/j.mbs.2006.11.002 [doi]. 32. Rybarczyk-Filho JL, Castro MA, Dalmolin RJ, Moreira JC, Brunnet LG, et al.
(2010) Towards a genome-wide transcriptogram: the Saccharomyces cerevisiae case. Nucleic Acids Res. gkq1269 [pii];10.1093/nar/gkq1269 [doi]. 33. Des Marais DL, Rausher MD (2008) Escape from adaptive conflict after
34. Khersonsky O, Roodveldt C and Tawfik DS (2006) Enzyme promiscuity: evolutionary and mechanistic aspects. Current Opinion in Chemical Biology 10: 498–508.
35. Soskine M and Tawfik DS (2101) Mutational effects and the evolution of new protein functions. Nature Rev. Genet. 11, 572–582 (2010).
36. McIntosh BE, Hogenesch JB, and Bradfield CA (2008) Mammalian Per-Arnt-Sim Proteins in Environmental Adaptation Annu Rev Physiol 2010, 72: 625– 645.