Eliane Schneider StrauchI
Ricardo Tavares PinheiroI Ricardo Azevedo SilvaI
Bernardo Lessa HortaII
I Programa de Pós-Graduação em Saúde e Comportamento. Universidade Católica de Pelotas. Pelotas, RS, Brasil
II Programa de Pós-Graduação em Epidemiologia. Universidade Federal de Pelotas. Pelotas, RS, Brasil
Correspondence: Eliane Schneider Strauch UCPEL – Campus II R. Almirante Barroso, 1202 Sala 1009 G
96010-280 Pelotas, RS, Brasil E-mail: [email protected] Received: 06/17/2008
Revised: 11/24/2008 Approved: 12/16/2008
Alcohol use among adolescents:
a population-based study
ABSTRACT
OBJECTIVE: To estimate the prevalence and factors associated with alcohol use among adolescents.
METHODS: Population-based, cross-sectional study performed from 2005 to 2006, in the city of Pelotas, Southern Brazil, with 1,056 adolescents aged between 11 and 15 years. An anonymous, self-applied questionnaire was used, based on the World Health Organization model for drug use. Poisson regression was employed to analyze data.
RESULTS: Prevalence of adolescents who reported alcoholic beverage consumption in the last month was 23.0% (95% CI: 20.4;25.4), prevalence was 21.7% among females and 24.2% among males. Prevalence of alcohol consumption at 11 years of age was 11.9%. In the multiple regression analysis, alcoholic beverage use by male adolescents was higher among those who reported tobacco use in the last month, those who were older, and those who had already had sexual intercourse. Among female adolescents, age was the only variable associated with alcoholic beverage use.
CONCLUSIONS: Alcoholic beverage use was prevalent in both sexes and began at a very early age. Smoking and previous sexual intercourse were also associated with this use. Preventive measures need to begin earlier, aiming to control alcohol use in the 11-to-15-year age group.
DESCRIPTORS: Adolescent. Alcohol Drinking, epidemiology. Risk Factors. Questionnaires, utilization. Health Surveys. Cross-Sectional Studies.
INTRODUCTION
Alcohol use early in life is one of the most relevant predictive factors of future health, socio-cultural and economic problems. Consumption before the age of 16 years signifi cantly increases the risk of excessive drinking in adulthood, in both sexes.14
Adolescents comprise the population group that has the greatest alcohol consumption problems. Studies show that even low consumption is associated with greater risk of accidents,a use of psychotropic drugs,8,11,17,19,22 and
high-risk behavior, including unprotected sex (without condom).7,18
In the long term, alcoholic beverage consumption can lead to suicide and chronic diseases, including mental disorders, cancer,7 systemic arterial
hypertension,6 obesity, cerebrovascular accident, polyneuropathies, dementia,
convulsions and digestive tract neoplasias.18
Studies with adolescents have identifi ed the following as factors associated with alcohol use: age,2,22 male
sex,2,12,17,20,22 economic status,11,19 studying in public
schools,22 not living with parents, family history
of alcohol, entering the job market, not having a religion,5 tobacco16 and illicit drug use,2 little support
or lack of understanding of family, association with family behavior towards alcohol use and abuse15,21 and
depression.3,16
The present study aimed to estimate the prevalence of and factors associated with alcohol use among adolescents.
METHODS
A population-based, cross-sectional study was performed in the city of Pelotas, Southern Brazil, between September 2005 and April 2006. This study was part of a more extensive research project on several health outcomes in adolescence, performed by the Programa de Pós-Graduação em Saúde e
Comportamento da Universidade Católica de Pelotas
(Post Graduation Program in Health and Behavior, Pelotas Catholic University).
The following parameters were used to calculate the sample size of the extensive research project: estimated prevalence of 62.3%22 for alcohol use in the last
month, 95% confi dence interval, and 80% statistical power, thus requiring 948 adolescents. A total of 10% for losses and 10% to control confounding factors were added, totaling 1,137 adolescents. However, innumerable outcomes were investigated and calculations were made, according to the appropriate prevalences and exposures. The one requiring the greatest size, i.e. depression in the beginning of adolescence, established the sample number of 1,145 adolescents aged between 11 and 15 years, living in the urban area, for the analysis of this study.
Sampling was performed in multiple stages. A total of 6,794 households were estimated as necessary, based on the estimate that there were 3.4 residents per household and about 16% of residents in the age group assessed, in Pelotas urban area. Of all the 448 census tracts of the urban area, 79 were systematically selected. One block from each tract was randomly selected. In addition, one street corner was randomly selected to be the starting point, and 86 households were subsequently visited, following a predetermined order.
Of all the 1,145 adolescents located, 89 (7.8%) were classifi ed as losses. Losses varied from adolescents who did not answer the question referring to the outcome to those few who were not found in their homes after three visits.
A total of 1,056 adolescents answered an anonymous self-applied questionnaire with 81 questions about health behavior. All adolescents in the household participated in the study. After being fi lled out, questionnaires were put into a sealed box.
The dependent variable was alcoholic beverage use in the last 30 days.
Associations with demographic (sex and age) and socioeconomic variables (economic status, level of education in completed years, and school failure), life habits and depression symptoms were tested.
Economic status categories were established from ownership of household assets, payment of home employees and head of household’s level of education.a
The following life habits were analyzed: presence of intimidation (victimization or bullying), physical activity practice, tobacco use in the last month, illicit drug use in the last month, participation in religious activities, sexual behavior (previous sexual intercourse) and presence of depressive symptoms.
The intimidation variable was constructed from the following set of questions: “Has anyone given you nicknames?”, “Have you been threatened by anyone?”, “Has anyone stolen or damaged any of your possessions?”, “Have you been left out of games or groups?”, “Has anyone punched or kicked you?”, “Has anyone spread gossips or rumors about you?”, and “Have you been forced to do something you did not want do to?”.13
Children’s Depression Inventory was used to characterize the presence of depressive symptoms.10
Crude analysis was performed using the SPSS software (version 11.0), considering effect measures, with their respective 95% confi dence intervals and association tests.1 Analysis adjusted by Poisson regression,
according to the hierarchical model,23 was performed
with the Stata software (version 7.0).
The theoretical model presupposes hierarchy among levels in relation to the outcome, i.e. more distal variables determine alcohol consumption. In the present study, the model was divided into two levels. On the fi rst level, the following variables were included: sex, age, economic status, level of education and school failure; on the second, the following: intimidation, physical activity, tobacco use, illicit drug use, religious activity, sexual behavior, and depressive symptoms. Variables that entered the model had a p-value <0.20 in the crude analysis and variables whose p-value continued to be <0.05 after adjustment were maintained in the analysis.
This project was approved by the Comitê de Ética em Pesquisa da Universidade Federal do Rio Grande do Sul (Rio Grande do Sul Federal University Research Ethics Committee). Adolescents answered the questionnaire after written consent was given by their parents or legally responsible adults.
RESULTS
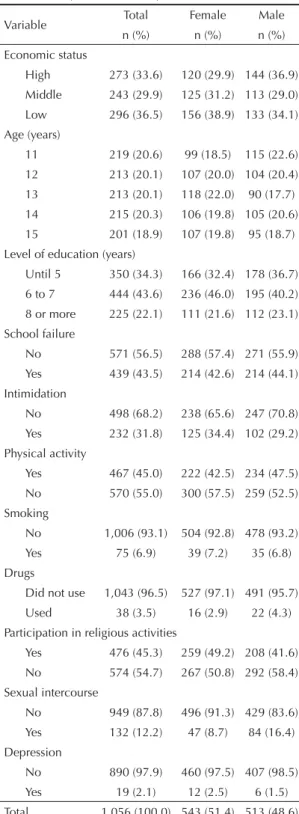
The sample of adolescents interviewed was divided similarly according to sex, with a predominance of low-class individuals (36.5%), aged 11 years (20.6%), with six to seven years of schooling (43.6%), without intimidation (68.2%), who did not practice a physical activity (55.0%), did not smoke in the last month (93.1%), did not use illicit drugs in the last month (96.5%), did not participate in religious activities (54.7%), had not had sexual intercourse (87.8%) and did not have depressive symptoms (97.9%) (Table 1).
Alcoholic beverage consumption in the last month was mentioned by 23.0% (95% CI: 20.4;25.4) of adolescents, the prevalence among males was 24.2% (95% CI:20.5;27.9) and among females, 21.7% (95% CI: 18.3;25.2).
As regards age, prevalences of alcohol consumption increased according to age group, for each sex and for all individuals in the study (Table 2).
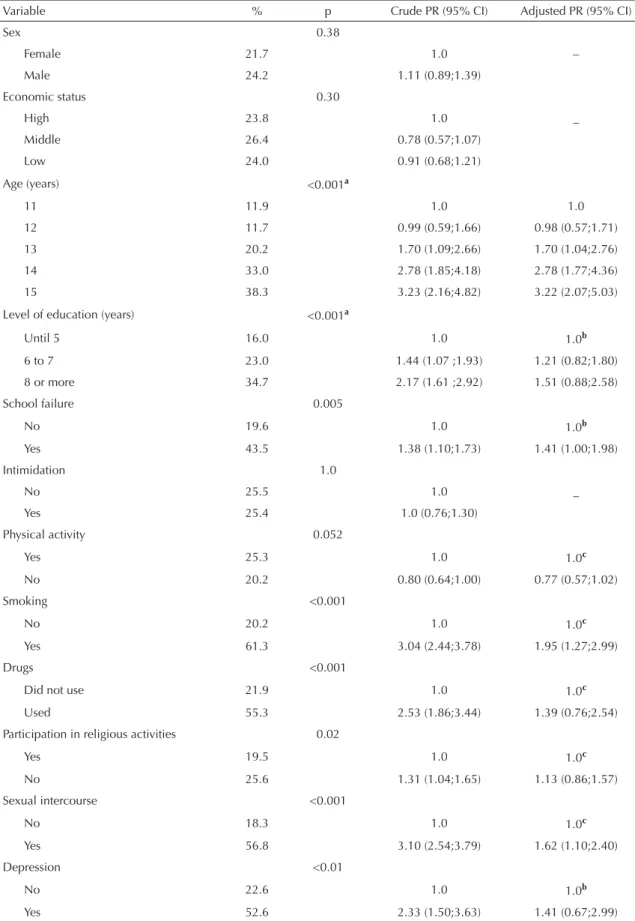
In the analysis adjusted for both sexes, an increase in the prevalence of alcohol consumption compared to the increase in age group, beginning at 13 years, was observed. In addition, prevalences of alcohol consumption were higher among adolescents who had failed school, reported tobacco use in the last month and had already had sexual intercourse (Table 3).
Among female adolescents, in the crude analysis, alcoholic beverage consumption in the last month was greater among those aged 14 and 15 years, who had eight or more years of schooling, had failed school, smoked or used illicit drugs in the last month, had already had sexual intercourse, and had depressive symptoms. Those who did not practice a physical activity showed lower prevalence of alcohol use. Socioeconomic level and presence of intimidation were not associated with alcoholic beverage consumption in the last month (Table 4). In the adjusted analysis, there was association with age: the older the age group, the higher the prevalence of alcohol use. However,
Table 1. Characteristics of the sample analyzed, according
to sex. Pelotas, Southern Brazil, 2005-2006.
Variable Total Female Male n (%) n (%) n (%) Economic status
High 273 (33.6) 120 (29.9) 144 (36.9) Middle 243 (29.9) 125 (31.2) 113 (29.0) Low 296 (36.5) 156 (38.9) 133 (34.1) Age (years)
11 219 (20.6) 99 (18.5) 115 (22.6) 12 213 (20.1) 107 (20.0) 104 (20.4) 13 213 (20.1) 118 (22.0) 90 (17.7) 14 215 (20.3) 106 (19.8) 105 (20.6) 15 201 (18.9) 107 (19.8) 95 (18.7) Level of education (years)
Until 5 350 (34.3) 166 (32.4) 178 (36.7) 6 to 7 444 (43.6) 236 (46.0) 195 (40.2) 8 or more 225 (22.1) 111 (21.6) 112 (23.1) School failure
No 571 (56.5) 288 (57.4) 271 (55.9) Yes 439 (43.5) 214 (42.6) 214 (44.1) Intimidation
No 498 (68.2) 238 (65.6) 247 (70.8) Yes 232 (31.8) 125 (34.4) 102 (29.2) Physical activity
Yes 467 (45.0) 222 (42.5) 234 (47.5) No 570 (55.0) 300 (57.5) 259 (52.5) Smoking
No 1,006 (93.1) 504 (92.8) 478 (93.2) Yes 75 (6.9) 39 (7.2) 35 (6.8) Drugs
Did not use 1,043 (96.5) 527 (97.1) 491 (95.7) Used 38 (3.5) 16 (2.9) 22 (4.3) Participation in religious activities
Yes 476 (45.3) 259 (49.2) 208 (41.6) No 574 (54.7) 267 (50.8) 292 (58.4) Sexual intercourse
No 949 (87.8) 496 (91.3) 429 (83.6) Yes 132 (12.2) 47 (8.7) 84 (16.4) Depression
No 890 (97.9) 460 (97.5) 407 (98.5) Yes 19 (2.1) 12 (2.5) 6 (1.5) Total 1,056 (100.0) 543 (51.4) 513 (48.6)
Table 2. Prevalence of alcohol use in the last 30 days, according
to sex and age. Pelotas, Southern Brazil, 2005-2006. Age
(years)
Prevalence 95% CI
Both sexes Females Males 11 11.9 (7.6;16.1) 11.1 (4.9;17.3) 12.2 (6.2;18.1) 12 11.7 (7.4;16.0) 7.5 (2.5;12.5) 16.3 (9.2;23.4)
13 (14.8;25.6)20.2 (13.1;27.6)20.3 (12.7;29.5)21.1
14 (26.7;39.3)33.0 (24.1;42.0)33.0 (23.4;41.3)32.4
Table 3. Crude and adjusted analyses of alcohol use in the last 30 days. Pelotas, Southern Brazil, 2005-2006.
Variable % p Crude PR (95% CI) Adjusted PR (95% CI)
Sex 0.38
Female 21.7 1.0 –
Male 24.2 1.11 (0.89;1.39)
Economic status 0.30
High 23.8 1.0 _
Middle 26.4 0.78 (0.57;1.07)
Low 24.0 0.91 (0.68;1.21)
Age (years) <0.001a
11 11.9 1.0 1.0
12 11.7 0.99 (0.59;1.66) 0.98 (0.57;1.71) 13 20.2 1.70 (1.09;2.66) 1.70 (1.04;2.76) 14 33.0 2.78 (1.85;4.18) 2.78 (1.77;4.36) 15 38.3 3.23 (2.16;4.82) 3.22 (2.07;5.03) Level of education (years) <0.001a
Until 5 16.0 1.0 1.0b
6 to 7 23.0 1.44 (1.07 ;1.93) 1.21 (0.82;1.80) 8 or more 34.7 2.17 (1.61 ;2.92) 1.51 (0.88;2.58)
School failure 0.005
No 19.6 1.0 1.0b
Yes 43.5 1.38 (1.10;1.73) 1.41 (1.00;1.98)
Intimidation 1.0
No 25.5 1.0 _
Yes 25.4 1.0 (0.76;1.30)
Physical activity 0.052
Yes 25.3 1.0 1.0c
No 20.2 0.80 (0.64;1.00) 0.77 (0.57;1.02)
Smoking <0.001
No 20.2 1.0 1.0c
Yes 61.3 3.04 (2.44;3.78) 1.95 (1.27;2.99)
Drugs <0.001
Did not use 21.9 1.0 1.0c
Used 55.3 2.53 (1.86;3.44) 1.39 (0.76;2.54) Participation in religious activities 0.02
Yes 19.5 1.0 1.0c
No 25.6 1.31 (1.04;1.65) 1.13 (0.86;1.57) Sexual intercourse <0.001
No 18.3 1.0 1.0c
Yes 56.8 3.10 (2.54;3.79) 1.62 (1.10;2.40)
Depression <0.01
No 22.6 1.0 1.0b
Yes 52.6 2.33 (1.50;3.63) 1.41 (0.67;2.99)
aLinear trend test
bAdjusted for age and among themselves (fi rst level)
confi dence intervals showed association from the age of 14 years (Table 4).
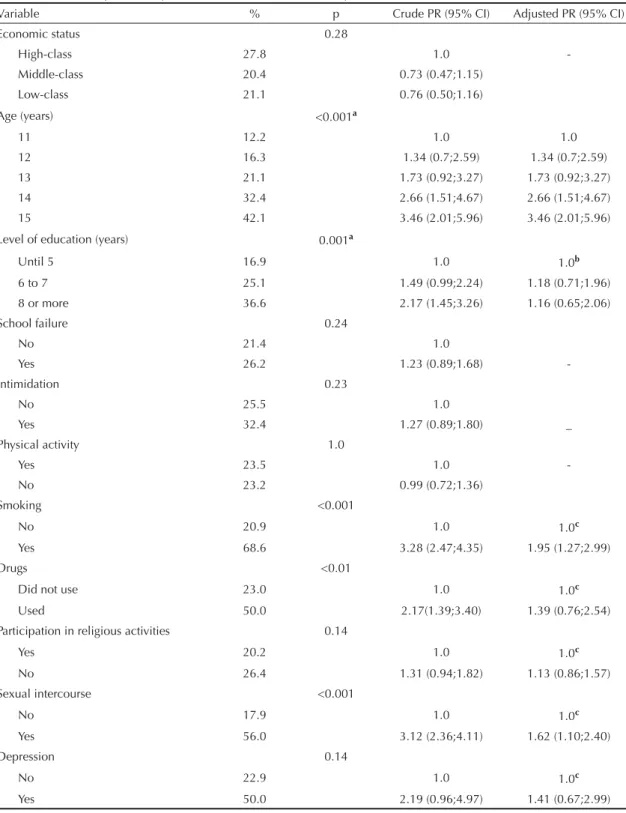
Among males, in the crude analysis, the following were variables associated with higher prevalence of
alcohol use: 14 years of age or older, eight or more years of schooling, smoking in the last month, use of illicit drugs in the last month, and previous sexual intercourse. Social status, history of school failure, intimidation and practice of physical activity were not
Table 4. Crude and adjusted analyses of alcohol use in the last 30 days for females. Pelotas, Southern Brazil, 2005-2006.
Variable % p Crude PR (95% CI) Adjusted PR (95% CI) Economic status 0.46
High 24.2 1.0
Middle 20.0 0.83 (0.57;1.33)
Low 26.3 1.09 (0.72;1.64)
Age (years) <0.001a
11 11.1 1.0 1.0
12 7.5 0.67 (0.28;1.83) 0.67 (0.27;1.67) 13 20.3 1.83 (0.94;3.55) 1.83 (0.90;3.73) 14 33.0 2.97 (1.60;5.52) 2.97 (1.51;5.85) 15 34.9 3.14 (1.70;5.81) 3.14 (1.60;6.16) Level of education (years) 0.001a
Until 5 14.5 1.0 1.0b
6 to 7 21.2 1.47 (0.94;2.25) 1.31 (0.74;2.34) 8 or more 33.3 2.31 (1.46;3.63) 1.62 (0.76;3.47)
School failure 0.01
No 17.7 1.0 1.0b
Yes 28.0 1.53 (1.10;2.13) 1.45 (0.90;2.35)
Intimidation 0.19
No 25.6 1.0 1.0c
Yes 19.2 0.75 (0.49;1.14) 0.73 (0.43;1.22) Physical activity 0.01
Yes 27.0 1.0 1.0c
No 17.3 0.64 (0.46;0.89) 0.68 (0.43;1.08)
Smoking <0.001
No 19.2 1.0 1.0c
Yes 53.8 2.80 (1.99;3.94) 1.61 (0.79;3.28)
Drugs <0.001
Did not use 20.5 1.0 1.0c
Used 63.5 3.05 (2.01;4.62) 1.24 (0.39;3.90) Participation in religious activities 0.14
Yes 18.9 1.0 1.0c
No 24.3 1.29 (0.93;1.79) 0.80 (0.50;1.28) Sexual intercourse <0.001
No 18.3 1.0 1.0c
Yes 57.4 3.13 (2.30;4.26) 1.83 (0.92;3.60)
Depression <0.01
No 22.9 1.0 1.0b
Yes 50.0 2.66 (1.60;4.42) 1.85 (0.67;5.19)
aLinear trend test
associated with alcohol in the last month (Table 5). In the adjusted analysis, the proportion of adolescents who reported alcoholic beverage use in the last month was found to be directly associated with age. Smoking and previous sexual intercourse were also associated
with alcoholic beverage use (Table 5). Even though they were maintained in the adjusted analysis, the “participation in religious activities” and “presence of depressive symptoms” variables were not signifi cantly associated with the outcome.
Table 5. Crude and adjusted analyses of alcohol use in the last 30 days for males. Pelotas, Southern Brazil, 2005-2006.
Variable % p Crude PR (95% CI) Adjusted PR (95% CI)
Economic status 0.28
High-class 27.8 1.0
-Middle-class 20.4 0.73 (0.47;1.15) Low-class 21.1 0.76 (0.50;1.16)
Age (years) <0.001a
11 12.2 1.0 1.0
12 16.3 1.34 (0.7;2.59) 1.34 (0.7;2.59) 13 21.1 1.73 (0.92;3.27) 1.73 (0.92;3.27) 14 32.4 2.66 (1.51;4.67) 2.66 (1.51;4.67) 15 42.1 3.46 (2.01;5.96) 3.46 (2.01;5.96) Level of education (years) 0.001a
Until 5 16.9 1.0 1.0b
6 to 7 25.1 1.49 (0.99;2.24) 1.18 (0.71;1.96) 8 or more 36.6 2.17 (1.45;3.26) 1.16 (0.65;2.06)
School failure 0.24
No 21.4 1.0
Yes 26.2 1.23 (0.89;1.68)
-Intimidation 0.23
No 25.5 1.0
Yes 32.4 1.27 (0.89;1.80) _
Physical activity 1.0
Yes 23.5 1.0
-No 23.2 0.99 (0.72;1.36)
Smoking <0.001
No 20.9 1.0 1.0c
Yes 68.6 3.28 (2.47;4.35) 1.95 (1.27;2.99)
Drugs <0.01
Did not use 23.0 1.0 1.0c
Used 50.0 2.17(1.39;3.40) 1.39 (0.76;2.54) Participation in religious activities 0.14
Yes 20.2 1.0 1.0c
No 26.4 1.31 (0.94;1.82) 1.13 (0.86;1.57) Sexual intercourse <0.001
No 17.9 1.0 1.0c
Yes 56.0 3.12 (2.36;4.11) 1.62 (1.10;2.40)
Depression 0.14
No 22.9 1.0 1.0c
Yes 50.0 2.19 (0.96;4.97) 1.41 (0.67;2.99)
a Linear trend test
DISCUSSION
Cross-sectional studies are not indicated to analyze etiological factors, once they are infl uenced by reverse causality. However, the present study is population-based and representative of the city of Pelotas.
Studies on adolescent health are usually performed in schools or in the relationship between workers and non-workers, not on a population basis. The present study sought to include a representative sample of adolescents of this city to answer questions about early alcohol consumption.
As questions are of a personal nature, reliability of responses was guaranteed with the use of an anonymous, self-applied questionnaire, which was put into a sealed box by the respondent, assuring them secrecy of information and encouraging them not to omit alcoholic beverage consumption. However, prevalence of consumption may have been underestimated as this is a stigmatizing habit.
Previous studies indicated that individuals with lower economic conditions showed greater alcohol consumption in adolescence and also adulthood.16,20
In Pelotas, a population-based study among adults revealed that individuals with lower economic status showed prevalences of abusive alcohol consumption that were almost three times higher.6 However, in the
present study, there was a slight, though not signifi cant, predominance of consumption among middle-class adolescents, contrary to what was expected. This fact may suggest change in profi le of alcohol consumption among adolescents in this age group, in Pelotas.
Difference in prevalence of alcohol consumption between sexes was not statistically signifi cant, and may indicate alcohol use among females is somewhat permitted. This fi nding is similar to that of Tavares et al22 in a cross-sectional study and that of the 1º Levantamento Nacional Sobre os Padrões de Álcool na População Brasileira (1st National Survey on
Alcohol Patterns in the Brazilian Population),a a
population-based study with individuals aged between 14 and 17 years. Differently, other studies found higher prevalence of alcohol use among males.2,12,14,16,17,20,21
However, alcohol use among females has been
changing, which may be harmful due to women’s physiological peculiarities. They have lower alcohol dehydrogenase serum levels, higher proportion of fat compared to body water and alcohol metabolism variations in different menstrual cycle phases.4 Such
characteristics may result in chemical dependence, even with lower amounts, and greater harmful effects caused by alcohol, when compared to men.18
As regards age, in both sexes, results showed that 12% of interviewees aged 11 years had already consumed alcoholic beverages in the last month, and these values rose to 20.2% at 13 years, thus indicating beginning of consumption at an early age.
Addictive types of behavior are associated with each other and preventive campaigns could not only approach one issue. Studies point to an association with tobacco use12,22 in those aged between 11 and 13
years, confi rmed by the present investigation among male adolescents. Psychoactive substance use at such ages increases risk of chemical dependence in adult life.11 Even experimental use is harmful and may lead
to behavioral changes. Accidents, aggressions, and undesired and unprotected sexual intercourse occur more frequently among adolescents after consumption of any psychoactive substance.2,9,24
In the present study, level of education, school failure, intimidation, depressive symptoms, physical activity and religious activity were not associated with the outcome. Another study with a similar design, such as the one performed by Dalgalarrondo et al5 in 2004,
found out that adopting a religion consists in a set of values, including acceptance or refusal of alcohol and drug use. In the present study, almost half of adolescents (45.3%) reported participating in religious activities, but differences in alcohol use were not found. It is possible that the type of religion may interfere with adolescent behavior towards alcohol use.
Alcoholic beverage use showed high prevalence in both sexes and began at an early age, revealing changes in adolescent profi le. Thus, this set of fi ndings may point to alcohol use among adolescents as a public health problem. Preventive measures to control alcohol consumption must include the 11-to-15-year age group, aiming to reduce the social cost of this abuse.
1. Altman DG. Practical statistics for medical research. London: Chapman & Hall; 1997.
2. Carlini-Cotrim B, Gazal-Carvalho C, Gouveia N. Comportamento de saúde entre jovens estudantes das redes pública e privada da área metropolitana de Estado de São Paulo. Rev Saude
Publica. 2000;34(6):636-45. DOI:
10.1590/S0034-89102000000600012
3. Ceballos R, Jonathan J, Ocha Muñoz J, Cortez Pérez E. Depresión en la adolescencia. Su relación com actividad deportiva y consumo de drogas. Rev Med IMSS. 2000;38(5):371-9.
4. Cloninger CR. Neurogenic adaptative mechanisms in alcoholism. Science. 1987;236(4800):410-6. DOI: 10.1126/science.2882604
5. Dalgalarrondo P, Soldera MA, Corrêa Filho HR, Silva CAM. Religião e uso de drogas por adolescentes.
Rev Bras Psiquiatr. 2004;26(2):82-90. DOI: 10.1590/
S1516-44462004000200004
6. Costa JSD, Silveira MF, Gazalle FK, Oliveira SS, Hallal PC, Menezes AMB, et al. Consumo abusivo de álcool e fatores associados: estudo de base populacional.
Rev Saude Publica. 2004;38(2):284-91. DOI: 10.1590/
S0034-89102004000200019
7. Duailibi S, Laranjeira R. Políticas públicas relacionadas às bebidas alcoólicas. Rev Saude
Publica. 2007;41(5):839-48. DOI:
10.1590/S0034-89102007000500019
8. Faden V. Epidemiology. In: Galantter M, editor. Alcohol problems in adolescents and young adults. Kluwer Academic/Plenum Publishers; 2005. p.1-4. (Recent developments in alcoholism, 17)
9. Gazal-Carvalho C, Carlini-Cotrim B, Silva AO, Sauaia N. Prevalência de alcoolemia em vítimas de causas externas admitidas em centro urbano de atenção ao trauma. Rev Saude Publica. 2002;36(1):47-54. DOI: 10.1590/S0034-89102002000100008
10. Gouveia RV, Barbosa GA, Almeida HJF, Galvão AA. Inventário de depressão infantil-CDI: estudo de adaptação com escolares de João Pessoa. J Bras
Psiquiatr. 1995;44(7):345-9.
11. Guimarães JL, Godinho PH, Cruz R, Kappann JI, Tosta Junior LA. Consumo de drogas psicoativas nos adolescentes escolares de Assis, SP. Rev Saude
Publica. 2004;38(1):130-2. DOI:
10.1590/S0034-89102004000100018
12. Horta RH, Horta BL, Pinheiro RT, Morales B, Strey MN. Tabaco, álcool e outras drogas entre adolescentes em Pelotas, Rio Grande do Sul, Brasil: uma perspectiva de gênero. Cad Saude
Publica. 2007;23(4):775-83. DOI:
10.1590/S0102-311X2007000400005
13. Hunter SC, Boyle JM, Warden D. Help seeking amongst child and adolescent victims of peer-aggression and bullying: the infl uence of school-stage, gender, victimization, appraisal, and emotion.
Br J Educ Psychol. 2004;74(Pt 3):375-90. DOI:
10.1348/0007099041552378
14. Laranjeira R, Hinkly D. Evaluation of alcohol outlet density and its relation with violence. Rev Saude
Publica. 2002;36(4):455-61. DOI:
10.1590/S0034-89102002000400011
15. Mathews IS, Pillon SC. Factores protectores y de riesgo asociados al uso de alcohol en adolescentes hijos de padre alcohólico, en el Perú. Rev Lat Am Enferm. 2004;12(n.esp):359-68.
16. Mendonça-Sassi RA, Béria JU. Prevalence of alcohol use disorders and associated factors: a population-based study using AUDIT in southern Brazil.
Addiction. 2003;98(6):799-804. DOI:
10.1046/j.1360-0443.2003.00411.x
17. Silva EF, Pavani RAB, Moraes MS, Chiaravalloti Neto F. Prevalência do uso de drogas entre escolares do ensino médio do Município de São José do Rio Preto, São Paulo, Brasil. Cad Saude Publica. 2006;22(6):1151-8. DOI: 10.1590/S0102-311X2006000600004
18. Soibelman M, Luz Júnior E, Diemen LV. Problemas relacionados ao consumo de álcool. In: Duncan BD, Schmidt MI, Giugliani ERJ. Medicina ambulatorial. Porto Alegre: Artmed; 2002. p.539-50.
19. Soldera M, Dalgalarrondo P, Corrêa Filho HR, Silva CAM. Uso de drogas psicotrópicas por estudantes: prevalência e fatores sociais associados. Rev Saude
Publica. 2004;38(2):277-83. DOI:
10.1590/S0034-89102004000200018
20. Souza DPO, Areco KN, Silveira Filho DX. Álcool e alcoolismo entre adolescentes da rede estadual de ensino de Cuiabá, Mato Grosso. Rev Saude
Publica. 2005;39(4):585-92. DOI:
10.1590/S0034-89102005000400011
21. Souza DPO, Silveira Filho DX. Uso recente de álcool, tabaco entre estudantes adolescentes trabalhadores e não-trabalhadores. Rev Bras Epidemiol. 2007;10(2):276-87. DOI: 10.1590/S1415-790X2007000200015 22. Tavares BF, Béria JU, Lima MS. Prevalência do uso
de drogas e desempenho escolar entre adolescentes.
Rev Saude Publica. 2001;35(2):150-8. DOI: 10.1590/
S0034-89102001000200008
23. Victora CG, Huttly SR, Fuchs SC, Olinto MT. The role of conceptual frameworks in epidemiological analysis: a hierarchical approach. Int J Epidemiol. 1997;26(1):224-47. DOI: 10.1093/ije/26.1.224 24. Vieira DL, Ribeiro M, Romano M, Laranjeira RR. Álcool
e adolescentes: estudo para implementar políticas municipais. Rev Saude Publica. 2007;41(3):396-403. DOI: 10.1590/S0034-89102006005000022 REFERENCES