FREE THEMES
1 Programa de Pós-Graduação em
Epidemiologia, Faculdade de Medicina, Universidade Federal de Pelotas. R. Marechal Deodoro 1160/3º, Centro. 96020-220 Pelotas RS Brasil.
Dependence for food-related activities in the elderly
Abstract The objective of this study was to de-scribe dependence for the activities of food shop-ping, preparing meals and eating in elderly resi-dents from the city of Pelotas, Rio Grande do Sul. Bivariate analysis and ordinal logistic regression were employed to assess the three dependencies and exposure variables studied. Of the 1,451 old-er adults assessed, 21.1% required assistance for some activities where this care was given predomi-nantly by son/daughter and partners. The highest prevalence of dependence was for food shopping (20.7%), followed by preparing meals (11.5%) and eating (2.0%). Elderly aged 80 years or old-er wold-ere more likely to be in a greatold-er dependence category than individuals aged 60-69 years, with odds ratios of 5.0 for men and 7.1 for women. The odds ratio in individuals who self-rated their health as regular, poor or very poor was approxi-mately 2.3 times greater, proving similar for both genders. Women with no partner had a 1.7 times greater chance of dependence whilst individuals with greater educational level exhibited 70.0% protection for their reference category; men with lower socioeconomic level had a 5.3 times greater chance of dependence than individuals with high-er socioeconomic level. These results highlight the most vulnerable subgroups for dependencies and the importance of a family caregiver.
Key words Cross-sectional studies, Activities of daily living, Assessment of disability, Eating be-havior, Elderly
B
ie
r
hals IO
Introduction
Population aging is defined as a shift in the age structure of the population in which there is an increase in people e over a certain age, considered
as the beginning of old age1. Worldwide, the
pro-portion of older adults is growing faster than any
other age group2. According to World Health
Or-ganization (WHO) estimates, between 1970 and 2025, the number of elderly people globally is set to rise by 223.0% or approximately 694 million
individuals2.
As a consequence of this new demographic characteristic, aging-related diseases and condi-tions have become a focus of health accondi-tions and
policies3,4. These activities tend to center on the
prevention and treatment of chronic
non-com-municable diseases in this age group5, given they
can lead to a debilitating process hampering or preventing the independent performance of
ac-tivities of daily living (ADLSs)6.
Functional disability, besides being a dynamic and progressive process, promoted by the health and physiological changes associated with aging, can be modulated by cognitive and psychological status and also by gender, educational level, social
support, life-style and environmental factors7,8.
Such disabilities can also impact the nutrition-al status of elderly individunutrition-als, where some fac-tors can have a major influence on the patterns of meals and nutrient intake in aging, including physical factors such as functional capacity for
performing ADLs9.
Some specific disabilities, such as difficulties acquiring and preparing foods and dependence for eating, are more directly associated with this situation and restrict or limit adequate nutrient
intake10,11. In addition, given that the elderly
pop-ulation has specific characteristics which render this group especially vulnerable, difficulties per-forming these activities independently can pose an imminent risk of nutritional deficiency. This
can lead to greater frailty among elderly12,
im-pairing general health, increasing susceptibility to falls and fractures, hospital admissions,
insti-tutional care and death7,13.
Despite the relevance of the topic, specific studies on the functional assessment of
food-re-lated activities in elderly are scarce in Brazil14,
with most investigations available in the
inter-national literature10,15. Therefore, the objective of
the present study was to describe dependence for food-related activities in non-institutionalized elderly from the city of Pelotas, Rio Grande do Sul, Brazil.
Methods
Pelotas is a medium-sized city located in the southern part of Rio Grande do Sul (RS) state and has a population of around 330,000 persons. Fifteen percent of its population comprises
indi-viduals age 60 year s or older16. A cross-sectional
population-based study was conducted in the ur-ban area to determine the health characteristics of the city´s non-institutionalized elderly. This study was carried out under the Post-graduate program in Epidemiology of the Federal Uni-versity of Pelotas through joint collaboration via a single field study called a “research
consor-tium”17. All students reading for Masters Degrees
took part in the study and drew data from the research for their respective dissertations.
The number of households required to meet the objectives of all members of the research team was first determined. Based on a ratio of
0.4 elderly residents per household16, in order
to include the number of residents required in samples for all the studies (1,649 elderly individ-uals), the study had to cover 3,745 households in the urban area of the city. The sampling process entailed two stages. In the first stage, the census sectors were ranked in increasing order of aver-age income to allow systematic random selection of 133 sectors. Subsequently, these sectors were reviewed to update the number of households. Thirty-one households per sector were then sys-tematically selected to enable identification of around 12 elderly individuals within each. Thus, the study encompassed a total of 4, 123 house-holds.
For this study, a sample size of 1,192 elderly participants was calculated. This calculation was based on the prevalences found by Del Duca et
al.18 of 1.3% dependence for the activity of
eat-ing, 11.9% for shoppeat-ing, and 8.7% for preparing meals, allowing for an acceptable error of 0.7 in dependence for eating, and sample design effect (DEF) of 1.1.
Data collection was carried out from January to August 2014 by trained interviewers using a previously tested questionnaire in digital form applied with the aid of netbooks.
The outcomes of the present study were de-pendence for activities of food shopping, prepa-ration and intake. In order to allow comparison of results, dependence was investigated using three questions based on the Health,
Well-be-ing and AgWell-be-ing Survey (SABE)19: At the moment,
cof-aúd
e C
ole
tiv
a,
21(4):1297-1308,
2016
fee?. Possible responses were: “no”, “yes, always”, yes, sometimes”. For the activities of food shop-ping and preparing meals, the category “I don´t usually do it” was included. In the analysis, inter-viewees reporting the need for full or partial as-sistance were considered dependent for perform-ing that activity. For determinperform-ing the prevalence of elderly requiring some kind of assistance, de-pendence was defined as needing help for at least one of the activities studied.
Regarding the dependent variables, in cases where a need for help was cited, a further two questions were asked to characterize the help required. Possible responses were: “I receive no help”, “spouse/partner”, “son/daughter, step-son/step-daughter”, “parents/mother-in-law or father-in-law”, “brother/sister”, “son-in-law/ daughter-in-law”, “other relative”, “caregiver”, “domestic”, and “other”. A question inquiring whether the help was paid was also asked, with answer alternatives of “no” or “yes”. Paid care was considered formal when performed by a caregiv-er or domestic, or informal when pcaregiv-erformed by others who were not paid for the task.
The following characteristics constituted in-dependent variables: gender, age (collected as a discrete numeric variable and subsequently strat-ified into 60-69, 70-79 and 80 years or older), marital status (“married or living with partner”, “single or with no partner”, “separated”, “wid-owed”, socioeconomic level (collected accord-ing to the instrument proposed by the National
Association of Research Companies (ABEP)20
and categorized into classes A, B, C, D or E), ed-ucational level (collected under the categories
“none”; “1st to 3rd series”; “4th series or 1st grade
incomplete”, ”1st grade complete or 2nd grade
incomplete”, “2nd grade complete or higher ed-ucation incomplete” and “higher eded-ucation com-plete”), self-rated health (“very poor”, “poor”, “regular”, “good”, “very good”), weight (mea-sured using a set of TANITA® brand digital scales (150Kg capacity and accurate to nearest 100g) and height. Stature was estimated based on knee height using the equation proposed by Chumlea
& Guo21. This method is recommended for
in-dividuals aged 60 years or older, particularly in view of problems related to advanced age, such as being unable to stand and deformities of the
spine22. Thus, knee height was measured using a
child stadiometer incorporating a 100 cm scale (Indaiá® brand). The height of the individual was then estimated by an equation. The weight and height variables were then used to calculate Body Mass Index (BMI). The formula of BMI =
Weight (Kg)/[Height(m)]² was employed, with
values categorized as follows: ≤ 22.0 kg/m²
(un-derweight), > 22.0 and < 27.0 kg/m² (normal
weight), ≥ 27.0 kg/m² (overweight)23.
All interviews, performed with the aid of Netbooks, were transferred weekly to a database held on the Stata 12.1® software program. After analyzing for inconsistencies, a descriptive analy-sis was performed to characterize the population studied . Prevalences of the three dependencies were calculated along with the number of depen-dencies, categorized into none, one, two or three. The relationship among the three dependencies was assessed by constructing a Venn Diagram. It should be noted that 180 individuals were ex-cluded from the analysis because information for all three outcomes was not provided. Bivar-iate analysis was performed for each exposure of interest and each outcome using Pearson´s Chi-squared tests with calculation of the p-value for heterogeneity in categorical exposure variables. Also, ordinal regression was applied to determine which variables were associated with the presence of dependencies. Analyses were stratified for gen-der. A significance level of 5% was adopted for all associations. The complex sampling process was applied for all analyses using the svy command.
In order to assure the quality of the informa-tion collected, 10% of the individuals were ran-domly selected for application of a short form of the questionnaire containing 19 questions. The question used in this study was: At the moment, do you need somebody’s help for doing the food shopping?. The expected concordance between responses was tested by calculating the Kappa statistic, which showed 41.0% repeatability.
The study project was approved by the Re-search Ethics Committee of the Federal Universi-ty of Pelotas Medical School and all participants who agreed to take part in the study signed a Free and Informed Consent Form.
Results
B
ie
r
hals IO
as 1.04 for dependence for eating, 1.39 for food shopping and 1.09 for preparing meals.
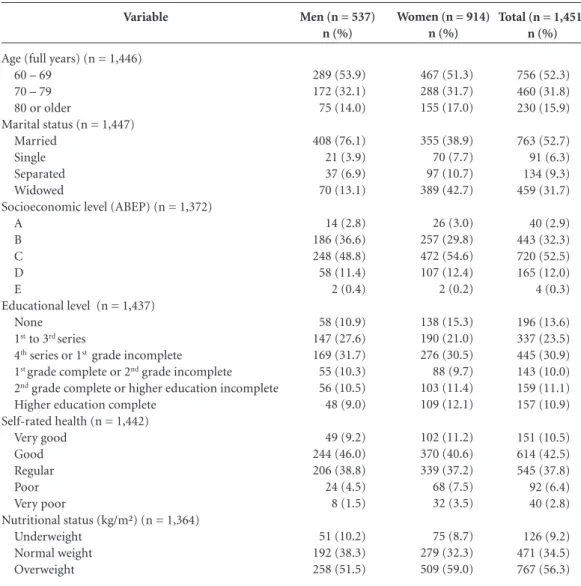
A full description of the sample, stratified by gender for the independent variables studied, is given in Table 1. The majority of the elderly (63.0%) were female and approximately 50.0% aged 60-69 years. Participants had a mean age of 70.7 ± 8.2 years, minimum of 60 years and maximum of 104 years. Most men (76.1%) were married and 42.7% of women were widows. Ap-proximately 56.7% of the elderly were classified as economic class C and 30.9% reported having
studied to 4th series or incomplete 1st grade levels.
With regard to self-rated health and nutritional status, over half of the individuals (53.0%)
re-ported having good or very good health and the majority (56.3%) were overweight.
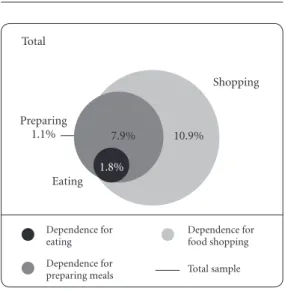
The highest prevalence of dependence was found for food shopping (20.7%, 95%CI: 18.5-22.9), with rates of 24.7% (95%CI: 21.8-27.6) in women and 13.5% (95%CI: 10.4-16.6) in men. The prevalences of dependence for preparing meals and eating were 11.5% (95%CI: 9.8-13.3) and 2.0% (95%CI: 1.3-2.7), respectively, prov-ing similar for both genders. Of all interview-ees, 8.2% had no dependences, 12.0% had one, 8.0% two and 1.8% had all three dependencies. In addition, 7.9% of elderly were dependent for both preparing meals and food shopping, 10.9% for food shopping only and 1.1% for preparing
Variable
Age (full years) (n = 1,446) 60 – 69
70 – 79 80 or older
Marital status (n = 1,447) Married
Single Separated Widowed
Socioeconomic level (ABEP) (n = 1,372) A
B C D E
Educational level (n = 1,437) None
1st to 3rd series
4th series or 1st grade incomplete 1st grade complete or 2nd grade incomplete 2nd grade complete or higher education incomplete Higher education complete
Self-rated health (n = 1,442) Very good
Good Regular Poor Very poor
Nutritional status (kg/m²) (n = 1,364) Underweight
Normal weight Overweight
Table 1. Sample description according to demographic, socioeconomic and health variables, stratified by gender.
Pelotas, RS, 2014 (n = 1,451).
Total (n = 1,451) n (%)
756 (52.3) 460 (31.8) 230 (15.9)
763 (52.7) 91 (6.3) 134 (9.3) 459 (31.7)
40 (2.9) 443 (32.3) 720 (52.5) 165 (12.0) 4 (0.3)
196 (13.6) 337 (23.5) 445 (30.9) 143 (10.0) 159 (11.1) 157 (10.9)
151 (10.5) 614 (42.5) 545 (37.8) 92 (6.4) 40 (2.8)
126 (9.2) 471 (34.5) 767 (56.3)
Men (n = 537) n (%)
289 (53.9) 172 (32.1) 75 (14.0)
408 (76.1) 21 (3.9) 37 (6.9) 70 (13.1)
14 (2.8) 186 (36.6) 248 (48.8) 58 (11.4) 2 (0.4)
58 (10.9) 147 (27.6) 169 (31.7) 55 (10.3) 56 (10.5) 48 (9.0)
49 (9.2) 244 (46.0) 206 (38.8) 24 (4.5) 8 (1.5)
51 (10.2) 192 (38.3) 258 (51.5)
Women (n = 914) n (%)
467 (51.3) 288 (31.7) 155 (17.0)
355 (38.9) 70 (7.7) 97 (10.7) 389 (42.7)
26 (3.0) 257 (29.8) 472 (54.6) 107 (12.4) 2 (0.2)
138 (15.3) 190 (21.0) 276 (30.5) 88 (9.7) 103 (11.4) 109 (12.1)
102 (11.2) 370 (40.6) 339 (37.2) 68 (7.5) 32 (3.5)
aúd
e C
ole
tiv
a,
21(4):1297-1308,
2016
meals only. This data is depicted in Figure 1 by a Venn Diagram.
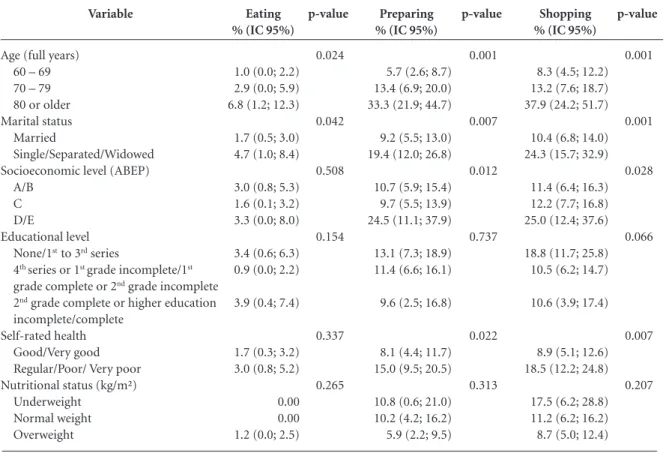
The relationship between the presence of each dependence and exposure variables among men is shown in Table 2. It is evident that reli-ance on help for eating, preparing meals and food shopping was more frequent among elder-ly aged 80 years or older, and also in individuals who were single, separated or widowers. Socio-economic level was significantly associated only with the outcomes “preparing meals” and “food shopping” (p = 0.012 and p = 0.028, respective-ly) , where prevalences were higher among those with economic levels D and E. Also, individuals who rated their health as regular, poor or very poor had higher prevalences for both outcomes (p = 0.022 and p = 0.007, respectively).
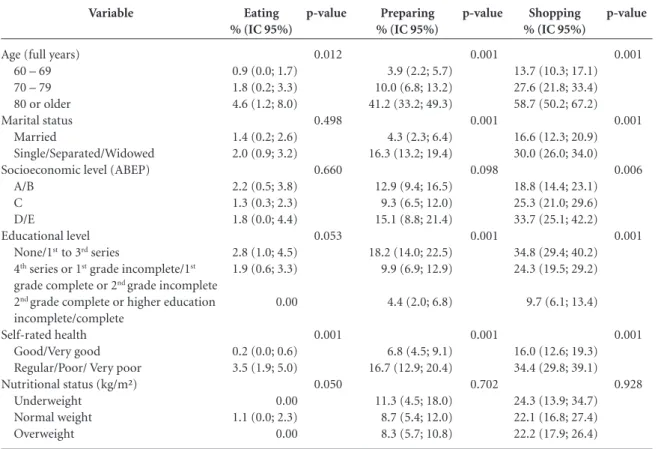
Similarly in women (Table 3), reliance on help for eating, preparing meals and food shop-ping was more frequent among those aged 80 years or older. There was a higher frequency of dependence for preparing meals and food shop-ping (p < 0.001 for both) in single, separated or widowed women and among those with no
education or who had studied up to the 3rd
se-ries. Women classed as economic levels D and E had higher prevalences of dependence for food shopping (p = 0.006). Self-reported health was associated with all three outcomes, proving more frequent among women who rated their health as regular, poor or very poor.
Figure 1. Dependence of elderly for food shopping,
preparing meals and eating, with intersections, depicted by Venn Diagram. (n = 1,271)
Total
Preparing 1.1%
Eating 1.8%
7.9% 10.9%
Dependence for eating
Dependence for preparing meals
Dependence for food shopping
Total sample
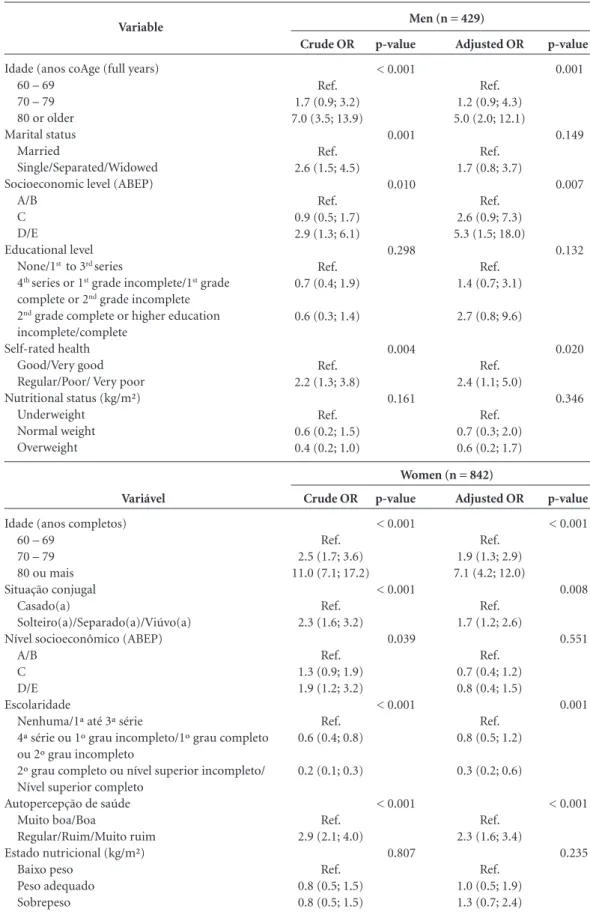
The crude and adjusted analyses of number of dependencies and the exposure variables by gender is shown in Table 4. The adjusted analysis revealed that men aged 80 year or older had a 5.0 times greater likelihood of being in a greater de-pendence category compared to individuals aged 60-69 years (p = 0.001). This likelihood among women was 7.1 times greater (p < 0.001). The variables marital status and education were as-sociated only for women, where those who were single, separated or widows had a 1.7 greater chance of being in a greater dependence cate-gory than married women (p = 0.008). Women
who had completed 2nd grade or complete or
in-complete higher education had 70% protection against being in a category of greater dependence compared to those with no education or who had
studied up to the 3rd series (p = 0.001).
Socioeco-nomic level was associated only among men, where those with a lower economic level (class D/E) had 5.3 times more chance of being in a category of greater dependence than men with higher economic level (A/B class) (p = 0.007). Moreover, elderly who rated their health as reg-ular, poor, or very poor had a 2.3 times greater likelihood of being in a greater dependence cat-egory than those rating their health as good or very good, with no difference between genders. The nutritional status variable was not statistical-ly significant on crude or adjusted anastatistical-lyses.
The data revealed that 21.1% of elderly (n = 306) required some kind of assistance for the activities. The elderly were assisted on the three activities largely by family members, predomi-nantly son/daughter or step-son/step-daughter, followed by spouse/partner. A relatively small percentage of elderly reported using paid help for food-related activities (formal caregiving): 13.8% for eating, 8.0% for preparing meals and 4.4% for food shopping (data not shown in ta-ble).
Discussion
This study showed that 21.1% of the elderly re-quired assistance for a food-related activity and that care was predominantly given by son/daugh-ter or partner.
In the national and international literature, few studies assessing functional disability have focused on specific activities, such as those
relat-ed to food10,14,15. Most studies have assessed a full
range of basic activities of daily living (BADLs) or instrumental activities of daily living (IADLs),
B
ie
r
hals IO
or both. However, comparisons can be drawn with the results found in the present study when prevalences of each activity are given separately.
The present study found that one in every five elderly reported needing help for
food-re-lated activities. According to Eberhardie24,
de-pendence in elderly generally occurs gradually, where the majority have autonomy for the ac-tivity of eating and rarely exhibit dependence for this activity, even when they are no longer able to shop for and/or prepare their own meals. A study carried out between 2000 and 2001 in Finland with national representativeness involving 1697 elderly aged 65 years or older found a similar prevalence of need of assistance for eating
activ-ities (23.0%)15. However, a Canadian study in a
sample of 193 volunteers aged over 55 years (61 recruited from geriatric clinics and 132 commu-nity-dwelling), found a higher prevalence than
the present study of 29.5% 10. This disparity may
be due to the Canadian sample, which comprised both community-dwelling and institutionalized elderly.
A study on functional disability for ADLs and IADLs in 598 elderly, based on data collected be-tween 2007 and 2008 in Pelotas, reported simi-lar prevalences to the rates found in the present
study18. Another Brazilian study in 2142 elderly
assessing eating behavior carried out in São Pau-lo between 2000 and 2001 revealed difficulties (or inability) for preparing meals in 5.0% and for
food shopping in 14% of the group14.
Comparing international studies, the previ-ously cited study carried out in Finland found that 4.3% of the elderly had problems eating without the assistance of others and around
22.0% had difficulties preparing meals15. The
lower prevalences observed in the present stud-ies may be explained by its younger sample, in which 81.4% of the elderly were under the age of 80 years. The Canadian study, despite including institutionalized elderly, had similar results to the present study, reporting 21.8% dependence for supermarket shopping and 13.5% for preparing meals.
Of the total elderly that reported needing
Variable
Age (full years) 60 – 69 70 – 79 80 or older Marital status
Married
Single/Separated/Widowed Socioeconomic level (ABEP)
A/B C D/E
Educational level None/1st to 3rd series
4th series or 1st grade incomplete/1st grade complete or 2nd grade incomplete 2nd grade complete or higher education incomplete/complete
Self-rated health Good/Very good Regular/Poor/ Very poor Nutritional status (kg/m²)
Underweight Normal weight Overweight
Table 2. Frequency of dependence for eating, preparing meals and food shopping according to demographic and economic
variables, self-rated health and nutritional status in men (n = 537).
Eating % (IC 95%)
1.0 (0.0; 2.2) 2.9 (0.0; 5.9) 6.8 (1.2; 12.3)
1.7 (0.5; 3.0) 4.7 (1.0; 8.4)
3.0 (0.8; 5.3) 1.6 (0.1; 3.2) 3.3 (0.0; 8.0)
3.4 (0.6; 6.3) 0.9 (0.0; 2.2)
3.9 (0.4; 7.4)
1.7 (0.3; 3.2) 3.0 (0.8; 5.2)
0.00 0.00 1.2 (0.0; 2.5)
p-value
0.024
0.042
0.508
0.154
0.337
0.265
Preparing % (IC 95%)
5.7 (2.6; 8.7) 13.4 (6.9; 20.0) 33.3 (21.9; 44.7)
9.2 (5.5; 13.0) 19.4 (12.0; 26.8)
10.7 (5.9; 15.4) 9.7 (5.5; 13.9) 24.5 (11.1; 37.9)
13.1 (7.3; 18.9) 11.4 (6.6; 16.1)
9.6 (2.5; 16.8)
8.1 (4.4; 11.7) 15.0 (9.5; 20.5)
10.8 (0.6; 21.0) 10.2 (4.2; 16.2) 5.9 (2.2; 9.5)
p-value
0.001
0.007
0.012
0.737
0.022
0.313
Shopping % (IC 95%)
8.3 (4.5; 12.2) 13.2 (7.6; 18.7) 37.9 (24.2; 51.7)
10.4 (6.8; 14.0) 24.3 (15.7; 32.9)
11.4 (6.4; 16.3) 12.2 (7.7; 16.8) 25.0 (12.4; 37.6)
18.8 (11.7; 25.8) 10.5 (6.2; 14.7)
10.6 (3.9; 17.4)
8.9 (5.1; 12.6) 18.5 (12.2; 24.8)
17.5 (6.2; 28.8) 11.2 (6.2; 16.2) 8.7 (5.0; 12.4)
p-value
0.001
0.001
0.028
0.066
0.007
aúd
e C
ole
tiv
a,
21(4):1297-1308,
2016
some kind of help performing the activities stud-ied, less than a fifth paid the helper. Furthermore, it was also noted that this care was predominantly given by the son/daughter or step-son/daughter. By contrast, another study performed in Pelotas, specifically on home-based care, found this was given predominantly by the spouse (39.5%)
fol-lowed by son/daughter (23.7%)25. This tendency
has arisen as a consequence of the new demands of society, which include demographic aging and increased life expectancy, in which the number of elderly requiring assistance for activities of daily living has risen and the presence of the
caregiv-er in their homes has become more common26.
According to the Bambuí Project, which studies a cohort of Brazilian elderly, few studies in
Bra-zil have explored this phenomenon8. The present
study found that around 23.0% of elderly needed assistance from a caregiver, invariably informal
and unpaid, such as a family member8,27. This
shows that in Brazil, the family is largely respon-sible for the burden of care giving to elderly in
the domestic setting27.
With regard to care, the study by Del Duca et
al.25 found that 4.7% was provided by a formal
caregiver. In the present study, the greatest need for a paid caregiver was for eating (13.8%) and the lowest need was for food shopping (4.4%).
Another result of the present study was the association of advanced age with greater prev-alences of dependence for the three outcomes. This finding corroborates results of other studies showing a higher frequency of need for assistance
with increasing age for eating15,28,29, preparing
meals and food shopping15. Loss of muscle and
bone mass, decline in basal metabolism and en-ergy reserve, with consequent inability to react to stressors, are associated with advanced aging and can lead to the syndrome of frailty which ex-poses independent elderly to functional loss and
dependence30.
Self-rated health was inversely associated with the outcomes food shopping and preparing meals for both sexes. Among women, this vari-able was also associated with the eating outcome. This highlights the link established between level
Variable
Age (full years) 60 – 69 70 – 79 80 or older Marital status
Married
Single/Separated/Widowed Socioeconomic level (ABEP)
A/B C D/E
Educational level None/1st to 3rd series
4th series or 1st grade incomplete/1st grade complete or 2nd grade incomplete 2nd grade complete or higher education incomplete/complete
Self-rated health Good/Very good Regular/Poor/ Very poor Nutritional status (kg/m²)
Underweight Normal weight Overweight
Table 3. Frequency of dependence for eating, preparing meals and food shopping according to demographic and economic
variables, self-rated health and nutritional status in women (n = 914).
Eating % (IC 95%)
0.9 (0.0; 1.7) 1.8 (0.2; 3.3) 4.6 (1.2; 8.0)
1.4 (0.2; 2.6) 2.0 (0.9; 3.2)
2.2 (0.5; 3.8) 1.3 (0.3; 2.3) 1.8 (0.0; 4.4)
2.8 (1.0; 4.5) 1.9 (0.6; 3.3)
0.00
0.2 (0.0; 0.6) 3.5 (1.9; 5.0)
0.00 1.1 (0.0; 2.3) 0.00
p-value
0.012
0.498
0.660
0.053
0.001
0.050
Preparing % (IC 95%)
3.9 (2.2; 5.7) 10.0 (6.8; 13.2) 41.2 (33.2; 49.3)
4.3 (2.3; 6.4) 16.3 (13.2; 19.4)
12.9 (9.4; 16.5) 9.3 (6.5; 12.0) 15.1 (8.8; 21.4)
18.2 (14.0; 22.5) 9.9 (6.9; 12.9)
4.4 (2.0; 6.8)
6.8 (4.5; 9.1) 16.7 (12.9; 20.4)
11.3 (4.5; 18.0) 8.7 (5.4; 12.0) 8.3 (5.7; 10.8)
p-value
0.001
0.001
0.098
0.001
0.001
0.702
Shopping % (IC 95%)
13.7 (10.3; 17.1) 27.6 (21.8; 33.4) 58.7 (50.2; 67.2)
16.6 (12.3; 20.9) 30.0 (26.0; 34.0)
18.8 (14.4; 23.1) 25.3 (21.0; 29.6) 33.7 (25.1; 42.2)
34.8 (29.4; 40.2) 24.3 (19.5; 29.2)
9.7 (6.1; 13.4)
16.0 (12.6; 19.3) 34.4 (29.8; 39.1)
24.3 (13.9; 34.7) 22.1 (16.8; 27.4) 22.2 (17.9; 26.4)
p-value
0.001
0.001
0.006
0.001
0.001
B
ie
r
hals IO
Table 4. Crude and adjusted odds ratio of number of dependences according to demographic and economic
variables, self-rated health and nutritional status, by gender (n = 1,271).
Variable
Idade (anos coAge (full years) 60 – 69
70 – 79 80 or older Marital status
Married
Single/Separated/Widowed Socioeconomic level (ABEP)
A/B C D/E
Educational level None/1st to 3rd series
4th series or 1st grade incomplete/1st grade complete or 2nd grade incomplete 2nd grade complete or higher education incomplete/complete
Self-rated health Good/Very good Regular/Poor/ Very poor Nutritional status (kg/m²)
Underweight Normal weight Overweight
Crude OR
Ref. 1.7 (0.9; 3.2) 7.0 (3.5; 13.9)
Ref. 2.6 (1.5; 4.5)
Ref. 0.9 (0.5; 1.7) 2.9 (1.3; 6.1)
Ref. 0.7 (0.4; 1.9)
0.6 (0.3; 1.4)
Ref. 2.2 (1.3; 3.8)
Ref. 0.6 (0.2; 1.5) 0.4 (0.2; 1.0)
p-value
< 0.001
0.001
0.010
0.298
0.004
0.161
Adjusted OR
Ref. 1.2 (0.9; 4.3) 5.0 (2.0; 12.1)
Ref. 1.7 (0.8; 3.7)
Ref. 2.6 (0.9; 7.3) 5.3 (1.5; 18.0)
Ref. 1.4 (0.7; 3.1)
2.7 (0.8; 9.6)
Ref. 2.4 (1.1; 5.0)
Ref. 0.7 (0.3; 2.0) 0.6 (0.2; 1.7)
p-value
0.001
0.149
0.007
0.132
0.020
0.346
Men (n = 429)
Variável
Idade (anos completos) 60 – 69
70 – 79 80 ou mais Situação conjugal
Casado(a)
Solteiro(a)/Separado(a)/Viúvo(a) Nível socioeconômico (ABEP)
A/B C D/E Escolaridade
Nenhuma/1ª até 3ª série
4ª série ou 1º grau incompleto/1º grau completo ou 2º grau incompleto
2º grau completo ou nível superior incompleto/ Nível superior completo
Autopercepção de saúde Muito boa/Boa
Regular/Ruim/Muito ruim Estado nutricional (kg/m²)
Baixo peso Peso adequado Sobrepeso
Crude OR
Ref. 2.5 (1.7; 3.6) 11.0 (7.1; 17.2)
Ref. 2.3 (1.6; 3.2)
Ref. 1.3 (0.9; 1.9) 1.9 (1.2; 3.2)
Ref. 0.6 (0.4; 0.8)
0.2 (0.1; 0.3)
Ref. 2.9 (2.1; 4.0)
Ref. 0.8 (0.5; 1.5) 0.8 (0.5; 1.5)
p-value
< 0.001
< 0.001
0.039
< 0.001
< 0.001
0.807
Adjusted OR
Ref. 1.9 (1.3; 2.9) 7.1 (4.2; 12.0)
Ref. 1.7 (1.2; 2.6)
Ref. 0.7 (0.4; 1.2) 0.8 (0.4; 1.5)
Ref. 0.8 (0.5; 1.2)
0.3 (0.2; 0.6)
Ref. 2.3 (1.6; 3.4)
Ref. 1.0 (0.5; 1.9) 1.3 (0.7; 2.4)
p-value
< 0.001
0.008
0.551
0.001
< 0.001
0.235
aúd
e C
ole
tiv
a,
21(4):1297-1308,
2016
of independence for ADLs and the elderly per-son’s self-perceived health status, representing an
important aspect to consider31.
With regard to the other factors associated with dependence, elderly individuals with no partner, lower economic level and less education were also more dependent. Elderly individuals with no partner, including widowers, can suffer a situation of isolation and display less care about their health, negatively impacting functional
ca-pacity32. The higher the individual´s level of
ed-ucation and income, the lower the likelihood of
reporting worse functional capacity33,34.
Individ-uals with a higher level of education are less likely to expose themselves to risk factors for diseases or to subject themselves to inadequate working conditions. This group also has greater access to information, propensity for modifying lifestyle, adopting health habits and seeking health
ser-vices35. Conversely, elderly with lower incomes
are less inclined to seek health services and have
poorer access to treatment and medications34.
Moreover, the probability of being in a great-er dependence category when assessed in ordi-nal form, was higher among individuals aged 80 years or older and in those who rated their health as regular, poor or very poor, for both sexes. For men, this probability was higher among those with lower income, whereas for women this was higher among single, separated or widowed in-dividuals and lower in those with higher educa-tional level. However, specific studies allowing comparison with the present study are not yet available, precluding further discussion on these relationships.
Several limitations of this study should be noted. Given the cross-sectional design of the study, its main limitation is the possibility of reverse causality bias for the variable “self-rated health”, especially since the individual´s percep-tion of life, expectapercep-tions and concerns can all
influence their health and autonomy36. On the
other hand, the negative perception of health
may stem from the fact they are debilitated, en-compassing biological, social and psychosocial
dimensions37. Underestimation of outcomes may
also be due to survival bias, whereby the most de-pendent elderly, and thus with worse health, may have already died.
A possible explanation for the low Kappa value found when testing expected concordance, besides chance among responses, on the ques-tionnaire used for data quality control, may be differences in participants’ interpretation of per-ceived dependence between the time of applica-tion of the initial interview and performance of the quality control. Another limitation is a lack of statistical power for detecting associations between outcomes and some exposure variables such as nutritional status.
The study has several noteworthy strengths, including internal validity, conferred by the rep-resentative sample of the elderly population from the city of Pelotas, as well as external validity, giv-en the data can be extrapolated to similar pop-ulations. The cluster sampling used in the study meant the analyses took into account the effect of this sampling process on results. However, only dependence for food shopping exhibited a design effect in the sample, indicating homogeneity of this dependence within clusters and heterogene-ity among clusters, clearly due to the economic difference between them.
In conclusion, even within a domestic set-ting, we observed that one in every five elderly required assistance for food-related activities, and that this care was provided largely by the family. Given that the caregiver plays an import-ant role in maintaining the health and wellbeing of the elderly person, in this case related to food, it is crucial that this individual has the necessary preparation to provide this care.
B
ie
r
hals IO
Collaborators
IO Bierhals and MCF Assunção were involved in all stages of the study, including the idea con-ception, devising the project, data analysis and writing the article. FO Meller was involved in de-vising the project, reviewing the study and con-tributing suggestions during the work.
Acknowledgements
aúd e C ole tiv a, 21(4):1297-1308, 2016
Del Duca G, Silva MC, Hallal PC. Incapacidade fun-cional para atividades básicas e instrumentais da vida diária em idosos. Rev Saude Publica 2009; 43(5):796-805.
Lebrão ML, Laurenti R. Saúde, bem-estar e envelheci-mento: o estudo SABE no Município de São Paulo. Rev
bras epidemiol 2005; 8(2):27-41.
Woo J, Chi I, Hui E, Chan F, Sham A. Low staffing level is associated with malnutrition in long-term residential care homes. Eur J Clin Nutr 2005; 59(4):474-479. Chumlea WC, Guo S. Equations for predicting stature in white and black elderly individuals. J Gerontol 1992; 47(6):197-203.
Chumlea WC, Roche AF, Steinbaugh ML. Estimating stature from knee height for persons 60 to 90 years of age. J Am Geriatr Soc 1985; 33(5):116-120.
Lipschitz DA. Screening for nutritional status in the el-derly. Primary care 1994; 21(1):55-67.
Eberhardie C. Assessment and management of eating skills in the older adult. Prof Nurse 2004; 19(6):318-322. Del Duca GF, Thumé E, Hallal PC. Prevalência e fatores associados ao cuidado domiciliar a idosos. Rev Saude
Publica 2011; 45(1):113-120.
Brasil. Ministério da Saúde (MS). Secretaria de Atenção à Saúde. Secretaria de Gestão do Trabalho e da Edu-cação na Saúde. Guia prático do cuidador. Brasília: MS; 2008.
Karsch UM. Idosos dependentes: famílias e cuidadores.
Cad Saude Publica 2003; 19(3):861-866.
Nyaruhucha CN, Msuya JM, Matrida E. Nutritional status, functional ability and food habits of institu-tionalised and non-instituinstitu-tionalised elderly people in Morogoro Region, Tanzania. East Afr Med J 2004; 81(5):248-253.
Yong V, Saito Y, Chan A. Gender differences in health and health expectancies of older adults in Singapore: an examination of diseases, impairments, and functional disabilities. J Cross Cult Gerontol 2011; 26(2):189-203. Song X, Mitnitski A, Rockwood K. Prevalence and 10-year outcomes of frailty in older adults in relation to deficit accumulation. J Am Geriatr Soc 2010; 58(4):681-687.
Cardoso MC, Marquesan FM, Lindôso ZCL, Schnei-der R, Gomes I, De Carli GA. Análise da capacidade funcional dos idosos de Porto Alegre e sua associação com autopercepção de saúde. Estud interdiscip envelhec
2012; 17(1):111-124.
Kawamoto R, Yoshida O, Oka Y. Factors related to func-tional capacity in community-dwelling elderly. Geriat-rics & Gerontology International 2004; 4(2):105-110. Lima-Costa MF, Matos DL, Camarano AA. Evolução das desigualdades sociais em saúde entre idosos e adul-tos brasileiros: um estudo baseado na Pesquisa Nacio-nal por Amostra de Domicílios (PNAD 1998, 2003).
Cien Saude Colet 2006; 11(4):941-950.
Alves LC, Leite IC, Machado CJ. Fatores associados à incapacidade funcional dos idosos no Brasil: análise multinível. Rev Saude Publica 2010; 44(3):468-478. Ross CE, Wu CL. Education, age, and the cumula-tive advantage in health. J Health Soc Behav 1996; 37(1):104-120. 18. 19. 20. 21. 22. 23. 24. 25. 26. 27. 28. 29. 30. 31. 32. 33. 34. 35. References
Carvalho JAM, Garcia RA. O envelhecimento da pop-ulação brasileira: um enfoque demográfico. Cad Saude
Publica 2003; 19(3):725-733.
World Health Organization (WHO). Active Ageing: A
Policy Framework. Geneva: WHO; 2002.
Brasil. Portaria nº 2.528, de 19 de outubro de 2006. Aprova a Política Nacional de Saúde da Pessoa Idosa.
Diário Oficial da União 2006; 20 out.
Lima-Costa MF, Veras R. Saúde pública e envelheci-mento. Cad Saude Publica 2003; 19(3):700-701. Veras R. Envelhecimento populacional contemporâ-neo: demandas, desafios e inovações. Rev Saude Publica
2009; 43(3):548-554.
Brasil. Ministério da Saúde (MS). Envelhecimento e saúde da pessoa idosa/Ministério da Saúde, Secretaria de Atenção à Saúde, Departamento de Atenção Básica. Brasília: MS; 2007.
Fried LP, Ferrucci L, Darer J, Williamson JD, Anderson G. Untangling the Concepts of Disability, Frailty, and Comorbidity: Implications for Improved Targeting and Care. J Gerontol 2004; 59(3):255-263.
Giacomin KC, Uchôa E, Firmo JOA, Lima-Costa MF. Projeto Bambuí: um estudo de base populacional da prevalência e dos fatores associados à necessidade de cuidador entre idosos. Cad Saude Publica 2005; 21(1):80-91.
Payette H, Shatenstein B. Determinants of healthy eat-ing in community-dwelleat-ing elderly people. Can J Public
Health 2005; 96(3):27-31.
Keller HH. Reliance on others for food-related activi-ties of daily living. J Nutr Elder 2005; 25(1):43-59. Payette H, Gray-Donald K, Cyr R, Boutier V. Predictors of Dietary Intake in a Functionally Dependent Elder-ly Population in the Community. Am J Public Health
1995; 85(5):677-683.
Nourhashémi F, Andrieu S, Gillette-Guyonnet S, Vellas B, Albarède JL, Grandjean H. Instrumental Activities of Daily Living as a Potential Marker of Frailty: A Study of 7364 Community-Dwelling Elderly Women (the EPI-DOS Study). Journal of Gerontology 2001; 56(7):448-453.
Ben-Ezra M, Shmotkin D. Predictors of mortality in the old-old in Israel: the Cross-sectional and Longitudinal Aging Study. J Am Geriatr Soc 2006; 54(6):906-911. Moura C. Comportamento alimentar de idosos res-identes na área urbana do município de São Paulo e variáveis sociodemográficas e culturais - Estudo SABE:
Saúde, Bem-estar e Envelhecimento [tese]. São Paulo:
Faculdade de Saúde Pública; 2012.
Kallio MK, Koskinen SV, Prattala RS. Functional dis-abilities do not prevent the elderly in Finland from eat-ing regular meals. Appetite 2008; 51(1):97-103. Suominen M, Muurinen S, Routasalo P, Soini H, Suur-Uski I, Peiponen A, Finne-Soveri H, Pitkala KH. Malnutrition and associated factors among aged resi-dents in all nursing homes in Helsinki. Eur J Clin Nutr
2005; 59(4):578-583.
Barros AJD, Menezes AMB, Santos IS, Assunção MCF, Gigante D, Fassa AG, Marques M, Araújo C, Hallal PC, Facchini LA. Mestrado do Programa de Pósgraduação em Epidemiologia da UFPel baseado em consórcio de pesquisa: uma experiência inovadora. Rev bras epide-miol 2008; 11(1):133-144.
B
ie
r
hals IO
Fiedler MM, Peres KG. Capacidade funcional e fatores associados em idosos do Sul do Brasil: um estudo de base populacional. Cad Saude Publica 2008; 24(2):409-415.
Santos KA, Koszuoski R, Dias-da-Costa JS, Pattussi MP. Fatores associados com a incapacidade funcional em idosos do Município de Guatambu, Santa Catarina, Brasil. Cad Saude Publica 2007; 23(11):2781-2788.
Article submitted 30/03/2015 Approved 21/08/2015
Final version submitted 23/08/2015 36.