Cristiane Pavanello Rodrigues SilvaI
Rúbia Aparecida LacerdaII
I Divisão de Prevenção de Infecção. Mercado Hospitalar. 3M do Brasil. Sumaré, SP, Brasil II Departamento de Enfermagem Médico
Cirúrgica. Escola de Enfermagem. Universidade de São Paulo. São Paulo, SP, Brasil
Correspondence:
Cristiane Pavanello Rodrigues Silva R. Nova dos Portugueses, 322 Imirim
02462-080 São Paulo, SP, Brasil E-mail: [email protected] Received: 1/19/2010
Approved: 8/2/2010
Article available from: www.scielo.br/rsp
Validation of a proposal for
evaluating hospital infection
control programs
ABSTRACT
OBJECTIVE: To validate the construct and discriminant properties of a hospital infection prevention and control program.
METHODS: The program consists of four indicators: technical-operational structure; operational prevention and control guidelines; epidemiological surveillance system; and prevention and control activities. These indicators, with previously validated content, were applied to 50 healthcare institutions in the city of São Paulo, Southeastern Brazil, in 2009. Descriptive statistics were used to characterize the hospitals and indicator scores, and Cronbach’s α coeffi cient was used to evaluate the internal consistency. The discriminant validity was analyzed by comparing indicator scores between groups of hospitals: with versus without quality certifi cation. The construct validity analysis was based on exploratory factor analysis with a tetrachoric correlation matrix.
RESULTS: The indicators for the technical-operational structure and epidemiological surveillance presented almost 100% conformity in the whole sample. The indicators for the operational prevention and control guidelines and the prevention and control activities presented internal consistency ranging from 0.67 to 0.80. The discriminant validity of these indicators indicated higher and statistically signifi cant mean conformity scores among the group of institutions with healthcare certifi cation or accreditation processes. In the construct validation, two dimensions were identifi ed for the operational prevention and control guidelines: recommendations for preventing hospital infection and recommendations for standardizing prophylaxis procedures, with good correlation between the analysis units that formed the guidelines. The same was found for the prevention and control activities: interfaces with treatment units and support units were identifi ed.
CONCLUSIONS: Validation of the measurement properties of the hospital infection prevention and control program indicators made it possible to develop a tool for evaluating these programs in an ethical and scientifi c manner in order to obtain a quality diagnosis in this fi eld.
DESCRIPTORS: Cross Infection, prevention & control. Infection Control. Indicators of Health Services. Program Evaluation. Validation Studies as Topic.
INTRODUCTION
There is a growing demand for systems to assess the quality of care practices and services relating to hospital infection control.7,8 Such assessments can be made
These indicators are ratios or quotients in which the numerator corresponds to the event that has been measured or recognized, which needs to have a clear and objective defi nition and be readily applicable and rapidly identifi able. The denominator is the population at risk of the event defi ned in the numerator.
These indicators take into consideration assessments of structures, results and processes. Structural assessments refl ect the capacity of the service to provide quality care, through the existence of human resources, care systems, fi nancial support, physical area and equipment, accessibility, protocols, physical plans and equipment, among others. The second assessment measures how frequently an event occurs, and thus makes it possible to estimate risk factors by identifying effects from the treatment, symptom relevance and other effects, along with establishing maximum and minimum acceptable limits for such events. The third assessment measures how the activities of a service or a given type of care are performed, this making it possible to analyze their quality in accordance with previously defi ned stan-dards.3 Hence, assessments on specifi c practices require
a set of indicators.
The validity of an assessment starts from prior recog-nition of the best practice available, based on: studies on the scientifi c evidence; guidelines or protocols available; controlled and preferably randomized clinical trials; case studies; consensus among specialists; and the relationship with results from assessments made using scientifi c methodological resources.2-4,9,10,12,14
Hospital infection control programs (HICP) make assessments on results in order to identify the preva-lence and incidence of cases of hospital infection. They classify cases according to topography, specialty, location and other characteristics, so that risk factors can be established. However, such assessments are not enough to recognize or determine the quality of the care practices effected, or to act preventively. The particular quality of the HICP also needs to be recognized, so that the quality of the care practices can be assessed and interventions can be made.
The present study aimed to validate the construct and discriminant properties of measurements on HICP.
METHODS
This study developed methodology for devising and validating health assessment measurements at 50 healthcare services in the municipality of São Paulo, Southeastern Brazil, in 2009. One hundred and sixty-two healthcare services were contacted by letter and in person. These were selected from the Datasus database in accordance with the following inclusion
a Silva CPR. Indicadores para Avaliação de Programas de Controle de Infecção Hospitalar: construção e validação [master’s dissertation]. São Paulo: Escola de Enfermagem da USP; 2005.
criteria: attendance structures of greater complexity and hospital beds, respecting the hospital size classifi -cation. i.e. general or specialized and public or private in nature; and the following exclusion criteria: treatment of mental diseases, healthcare centers, care provided in patients’ homes, solely outpatient services and non-surgical delivery.
Trained professionals gathered data to characterize the heath service and the hospital infection control service (HICS) and hospital infection control commission (HICC): the location, type of care, health certifi cation or accreditation, size, maintaining entity, specialized services, length of time for which the HICS/HICC had existed, nature of the HICS/HICC and linkage of the professionals at the HICS/HICC. An instru-ment for assessing HICP was applied, consisting of four indicators: technical-operational structure of the HICP (“structure”); operational prevention and control guidelines for hospital infection (“guidelines”); epide-miological surveillance system for hospital infection (“epidemiology”); and prevention and control activities against hospital infection (“activities”).a
Characteristics relating to the hospital’s profi le and indicator scores were described by means of descriptive statistics, means (with standard deviations), medians, minimum and maximum values, and percentages. The internal consistency was assessed by means of Cronbach’s α. This could range from 0.00 to 1.00 and the higher the coeffi cient was, the more exact (internally consistent) the measurement would be.13
This coeffi cient estimated the mean correlation of each item with the total score. When the values of Cronbach’s α were greater than 0.70, it was considered that the instrument had good internal consistency. To analyze the discriminant validity, the indicator scores were compared between hospitals with some type of quality certifi cation and those without certifi cation. In this, higher scores were expected for the hospitals with certifi cation. The nonparametric Mann-Whitney statistical test was used.
To analyze the construct validity, exploratory factor analysis with a tetrachoric correlation matrix was used, which is indicated for variables with dichotomous responses.5 The method used for factor extraction was
the iterative principal factor method, and the orthogonal rotation used was Varimax. The items that present
comparisons between groups) and SAS version 10.0 for the factor analysis. The signifi cance level was taken to be 0.05 for all the statistical tests.
The study was approved by the Research Ethics Committee of the Escola de Enfermagem da Universidade de São Paulo, (Process 800/2009) on April 8, 2009. The participants signed commitment and informed consent statements.
RESULTS
Fifty hospitals participated in applying the HICP indicators (31%), while 16 (10%) formally refused to
participate (non-approval by the management or no return from the local Research Ethics Committee) and 96 did not give any response (59%). The envelopes sent through the post were not returned.
The care provision consisted predominantly of general hospitals (80%); 50% did not have quality certification or accreditation. The majority with certifi cation (68%) had obtained it from the National Accreditation Organization, while 20% had certifi -cation of Commitment to Hospital Quality, 8% from the Joint Commission International and 4% from the International Organization for Standardization.
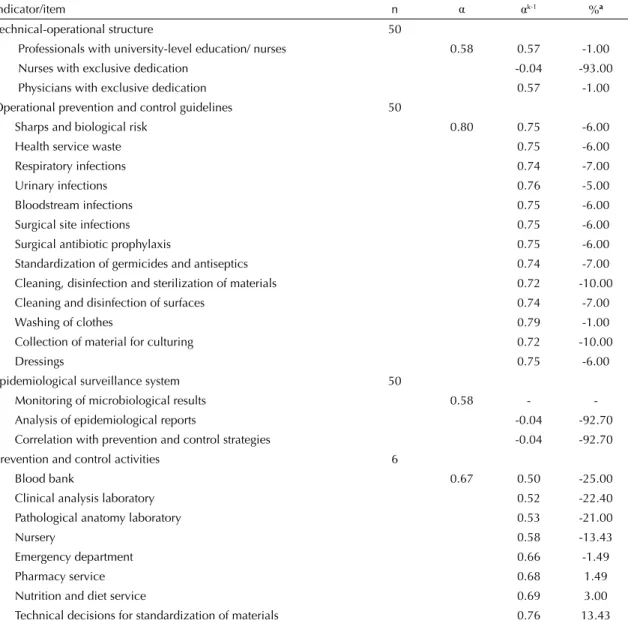
Table 1. Internal consistency of the indicators for assessing hospital infection control programs. São Paulo, Southeastern Brazil, 2009.
Indicator/item n α αk-1 %a
Technical-operational structure 50
Professionals with university-level education/ nurses 0.58 0.57 -1.00 Nurses with exclusive dedication -0.04 -93.00 Physicians with exclusive dedication 0.57 -1.00 Operational prevention and control guidelines 50
Sharps and biological risk 0.80 0.75 -6.00
Health service waste 0.75 -6.00
Respiratory infections 0.74 -7.00
Urinary infections 0.76 -5.00
Bloodstream infections 0.75 -6.00
Surgical site infections 0.75 -6.00
Surgical antibiotic prophylaxis 0.75 -6.00 Standardization of germicides and antiseptics 0.74 -7.00 Cleaning, disinfection and sterilization of materials 0.72 -10.00 Cleaning and disinfection of surfaces 0.74 -7.00
Washing of clothes 0.79 -1.00
Collection of material for culturing 0.72 -10.00
Dressings 0.75 -6.00
Epidemiological surveillance system 50
Monitoring of microbiological results 0.58 - -Analysis of epidemiological reports -0.04 -92.70 Correlation with prevention and control strategies -0.04 -92.70 Prevention and control activities 6
Blood bank 0.67 0.50 -25.00
Clinical analysis laboratory 0.52 -22.40 Pathological anatomy laboratory 0.53 -21.00
Nursery 0.58 -13.43
Emergency department 0.66 -1.49
Pharmacy service 0.68 1.49
Nutrition and diet service 0.69 3.00
Technical decisions for standardization of materials 0.76 13.43
α: Cronbach’s αcoeffi cient for the indicators.
αk-1: Cronbach’s α coeffi cient, excluding the item.
a Percentage change when the item [-(α- α
With regard to hospital size, 80% were of medium or large size (38% and 42%, respectively). The complexity was classifi ed according to the structure: 100% had intensive care beds, an emergency department and a surgical center, and 98% had a sterilized material center. All the hospitals had their own HICS and HICC, which were not part of consortiums, and these had been in operation for six to 20 years (median = 14 years).
The analysis on the internal consistency (Table 1) showed that the α coeffi cients ranged from 0.58 to 0.80. However, for the “structure” and 3 “epidemiology” indicators, the coeffi cients could only be calculated using three items, since the others did not present any variability, i.e., they were constant and invariable.
The “guidelines” and “activities” indicators were the ones that presented the best internal consistency results: 0.80 and 0.67 respectively (0.76 without the participa-tion and technical decisions).
Discriminant validity analysis was possible for the “guidelines” and “activities” indicators, because the other two indicators were constant and equal to 100.0% in the group with certifi cation. This in itself shows that the “structure” and “epidemiology” indicators in the group of qualifi ed hospitals presented better total conformity (Table 2).
The “guidelines” and “activities” indicators presented better mean values in the group with certifi cation and with statistically signifi cant difference (Table 2). Table 2. Comparison of the means for the assessment indicators for hospital infection control programs, between hospital groups. São Paulo, Southeastern Brazil, 2009.
Indicators Groups n Mean
(SD)a Median
Minimum - maximum pb
Technical-operational structure With certifi cationc 25
Without certifi cation 25 97.6 (5.9) 100.0 80.0;100.0 Operational prevention and control guidelines With certifi cation 25 96.8 (4.8) 100.0 86.7;100.0 0.001
Without certifi cation 25 85.9 (15.9) 93.3 46.7;100.0
Epidemiological surveillance system With certifi cationc 25
Without certifi cation 25 98.8 (4.4) 100.0 80.0;100.0 Prevention and control activities With certifi cation 25 94.5 (10.6) 100.0 61.8;100.0
Without certifi cation 25 72.4 (28.8) 84.6 9.5;100.0 0.001 a Standard deviation.
b Mann-Whitney test for comparison between means. c The values for this group were constant and equal to 100.0.
Table 3. Factor analysis for the indicator of operational prevention and control guidelines for hospital infection. São Paulo, Southeastern Brazil, 2009.
Operational prevention and control guidelines Factor 1 Factor 2 Are there any recommendations for health service waste disposal? 0.31 0.22 Are there any recommendations for prevention and control of respiratory infections? 0.75 0.18
Are there any recommendations for prevention and control of urinary infections? 0.86 -0.12 Are there any recommendations for prevention and control of bloodstream infections? 0.88 -0.04 Are there any recommendations for prevention and control of surgical site infections? 0.52 -0.04 Are there any recommendations for assessment and referral of accidents with sharps and other
exposures to biological material? -0.01 0.68 Are there any recommendations for the use of prophylactic antibiotics for preventing surgical site
infections? 0.03 0.47
Is there any standardization of germicide and antiseptic solutions? 0.04 0.72 Are there any recommendations for techniques for cleaning, disinfection and sterilization of materials
and equipment? 0.47 0.65
Are there any recommendations for routines for cleaning and disinfection of surfaces 0.01 0.70
It was not possible to perform a construct validity analysis for the “structure” and “epidemiology” indi-cators because these indiindi-cators varied very little, with 100% conformity in almost all the assessments.
Table 3 presents the factor analysis for the “guidelines” indicator, in terms of two factors: factor 1, recom-mendations for preventing infections; and factor 2, recommendations for standardizing the prophylaxis procedures.
Factor 1 had Cronbach’s α of 0.73 (fi ve items), but if the item “Are there any recommendations for health service waste disposal?” were to be removed, Cronbach’s α would increase to 0,80. For factor 2, if this same ques-tion were to be included, Cronbach’s α would remain 0.79 (seven items).
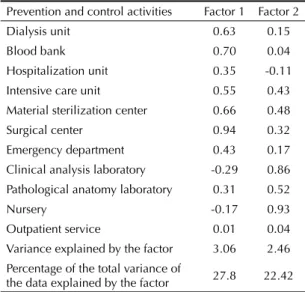
Table 4 presents the results from the factor analysis on the “activities” indicator, in terms of two factors. In the
fi rst factor, Cronbach’s α was 0.88 (seven items), and this factor included items relating to the treatment units (dialysis, blood bank, hospital admission, intensive care, surgical center and emergency department). The second factor (α = 0.72, three items) assessed support units (laboratories). The item “outpatient service” did not present any important loadings in either of the two factors extracted.
DISCUSSION
The system for HICP assessment was validated in the present study and applied to a sample that was epidemio-logically similar to two previous investigations aimed at more specifi c assessment of HICPs. In one of these studies, conducted by the Brazilian National Health Surveillance Agency in 2004, 6,714 questionnaires were sent out, with a general return rate of 61.8%, of which 35.1% was from the southeastern region.b In this fi rst case, it was not stated whether the instrument used had previously been validated. In 2009, the Regional Medical Council of the State of São Paulo carried out and published a HICP diagnosis based on 158 visits to hospitals in the State of São Paulo, of which 56 were in the state capital and its metropolitan region (35%). However, the investigative method was not disclosed.c
In the institutions evaluated here, the wide variation in the length of time for which the HICS/HICC had existed (six to 20 years) can be explained by the length of time for which the national legislation in this fi eld has been in force. Brazil’s fi rst regulations on hospital infection control were published in 1983, and these determined that HICCs were mandatory throughout the national territory. This was followed by Ordinance 930, in 1993.d This platform defi ned models for HICCs based
on formation of state and municipal commissions. This was follows by Law 9341 of 1997e and RDC Resolution
2616 of 1998,f which dealt with HICP.
Analysis on the internal consistency showed that the HICP indicators ranged from 0.58 to 0.80. The “guide-lines” and “activities” indicators were the ones that presented the best results, even though the “activities” indicator had been applied in six hospitals. This was because some items presented unknown responses, since they were not applicable in the other hospitals. Although the item “participation in technical decisions” interfered with the fi nal result, it was kept because of the importance of this activity developed by HICS, as support for healthcare managers.
There was variation in three items of the “structure” and “epidemiology” indicators. The other items had cons-tant values of 100.0% for the conformity scores, which refl ected the homogeneity of the sample, but interfered with the internal reliability. These indicators probably do not need to go through validation scrutiny, given
b Santos AM. O modelo brasileiro para o controle das infecções hospitalares: após vinte anos de legislação, onde estamos e para onde vamos? [master’s dissertation]. Belo Horizonte: Faculdade de Medicina da UFMG; 2006.
c Ministério Público do Estado de São Paulo. Conselho Regional de Medicina do Estado de São Paulo. Controle da Infecção Hospitalar é defi ciente em mais de 90% dos hospitais de São Paulo. São Paulo; 2009[cited 2009 Aug 21]. Available from: http://www.cremesp.org.br/ library/modulos/centro_de_dados/arquivos/infeccao_hospitalar_abril09.pdf
d Ministério da Saúde. Portaria Nº 930,de 27 de agosto de 1992. Expede na forma de anexos, normas para o controle das infecções hospitalares. Diario Ofi cial Uniao. 25 set. 1992;Seção1:1000-2.
e Brasil. Lei nº 9.431, de 6 de janeiro de 1997. Dispõe sobre a obrigatoriedade de manutenção de Programas de Controle de Infecção Hospitalar pelos hospitais do País. Diario Ofi cial Uniao. 7 jan 1997;Seção1:265.
f Ministério da Saúde. Portaria 2616, de 12 de maio de 1998. Dispõe sobre a obrigatoriedade de Programas de Controle de Infecção Hospitalar e sua Estrutura e Atividades. Diario Ofi cial Uniao. 13 maio 1998;Seção1:133-5.
Table 4. Factor analysis for the indicator of prevention and control activities against hospital infection. São Paulo, Southeastern Brazil, 2009.
Prevention and control activities Factor 1 Factor 2 Dialysis unit 0.63 0.15 Blood bank 0.70 0.04 Hospitalization unit 0.35 -0.11 Intensive care unit 0.55 0.43 Material sterilization center 0.66 0.48 Surgical center 0.94 0.32 Emergency department 0.43 0.17 Clinical analysis laboratory -0.29 0.86 Pathological anatomy laboratory 0.31 0.52
Nursery -0.17 0.93
Outpatient service 0.01 0.04 Variance explained by the factor 3.06 2.46 Percentage of the total variance of
that hospitals have already incorporated them into their routine, in compliance with the legislation in force.
The reliability of an instrument is related to the hetero-geneity of the sample, i.e. the more homogeneous the sample is, the more similar the scores will be and the lower the reliability coeffi cient will be. This does not necessarily mean that the instrument is unreliable, given that if an instrument is designed to measure differences and the members of the sample are similar to each other, it is more diffi cult to discriminate the reliability.11
A measurement instrument should not be correlated with variables that have nothing to do with it (false attributes). This characteristic is known as discriminant validity and was used in the present study to test the hypothesis that the indicators selected would be suffi -cient to “measure” the quality of a HICP distinctly in institutions with and without qualifi cation processes.6
In the analysis on the discriminant validity, there was a statistical difference in the group of institutions with quality accreditation/certifi cation processes, for the “guidelines” and “activities” indicators. These indi-cators refl ected actions of documentation, guidance, recommendation and interface with other services within the healthcare institution.
The results found showed that these indicators were suffi ciently sensitive to detect the hospitals that had gone through healthcare quality processes and conse-quently had better HICPs.
The Joint Commission International recommends that effective programs should be wide-ranging, provide attendance beyond the minimum required by legis-lation and contain within their scope actions such as systems for data gathering, administration, analysis and communication, with a plan for continuous improve-ment; formal policies and procedures; study, education and training programs; and collaboration and interfaces with all departments in the institution.1 Such actions are
included in the set of HICP indicators, especially in the “guidelines” and “activities” indicators.
For the dimensions of a measurement instrument to be consistently determined, along with its correlations with other similar measurements within the same theory or concept, the construct validity is used. This is known to be diffi cult and challenging.6,11
Five items correlated best with the factor “recommenda-tions for prevention of infec“recommenda-tions” (respiratory, urinary, bloodstream and surgical site) in the “guidelines” indi-cator, with variance of 23.5%. The item “Are there any recommendations for health service waste disposal?” had the lowest correlation with factor 1 (0.30) and
mainly encompassed aspects of recommendations or standardization of procedures. It was observed that this was one of the items in which the HICS had least direct or separate infl uence. The recommendations and deci-sions are made jointly with other professionals, thereby contributing towards devising and implementing health service waste management programs.g
In the other factor of the “guidelines” indicator, seven items were correlated with the recommendations for prophylaxis procedures. The item “Is there any stan-dardization of germicide and antiseptic solutions?” was the one with the highest loading in factor 2 (0.72). On the other hand, the item “Are there any recommenda-tions for washing and cleaning of clothes used at the institution?” was the one with the lowest correlation with this factor (0.33), responsible for 22.5% of the total variance of the data. This item was also little infl uenced by the HICS. This may have resulted from the fact that laundry services were outsourced in most of the institutions visited, even though there was joint responsibility for the processes.
It was concluded that the structure of the “guidelines” indicator could be maintained as it was (i.e. only one dimension), on the basis of the results relating to internal consistency, factor analysis and internal consistency of the factors. This structure could also be stratifi ed into two dimensions: recommendations for preventing infections and recommendations for standardizing prophylaxis procedures.
For the “activities” indicator, the results from the factor analysis showed two factors or dimensions: factor 1, treatment units; and factor 2, support units.
Factor 1 consisted of seven items: the best correlated item (0.94) was “surgical center”, while the least correlated item (0.35) was “hospitalization units”. The items “material sterilization center”, “intensive care unit” and “surgical center” were the most important items in factor 2 and, among these three, only the last of them seems to be more appropriate to this factor, which refl ects support units. Factor 1 was responsible for 27.8% of the total variance of the data.
The items best correlated with factor 2 were the ones that refl ected the support units, such as clinical analysis laboratories and pathological anatomy laboratories, and the nursery, which was the item with the highest correlation (0.93). This factor explained 22.4% of the total variance of the data.
The structure of the “activities” indicator was best represented in two dimensions, according to the results obtained. The results relating to Cronbach’s
α were better with the stratifi cation than without it (α = 0.67). Application of the indicator was focused on specifi c actions for improving the treatment and support sectors.
We did not fi nd any similar studies for validating HICP assessment instruments in either the Brazilian or worl-dwide literature. The closest was the study by Prade,h
carried out in 2002, in which a process for validating an information instrument for aiding in HICPs was deve-loped. The instrument was capable of evaluating diffe-rent dimensions of the systemic scope of hospital care, for its management, with a view to making managerial decisions.h However, several indicators did not achieve
validation, and the validity of the criteria and reliability of form B (the dimension of the hospital’s care provi-sion and its structure) was low. It was concluded that the group of examiners was unable to apply this type of assessment, or had had little practice in doing this. Prade considered that the internal validity was compromised by the unsatisfactory result from one of the studies, which would be redone after changes to examiner preparation had been made. It was concluded that the concordance between the examiners was not good and that the study would have to undergo the modifi cations suggested, and would have to be expanded in order to ensure external validity for the system.2
The individuals who applied the instrument in the present study had undergone prior training. Specifi c manuals were drawn up to guide the data gathering and systematize the data obtained.
The assessment proposal, with a small number of indi-cators and seeking only to evaluate the HICP, did not intend to correlate it directly with the hospitals’ overall care provision and structures, or with the professionals’ technical capacity. Although the conformity obtained may make it possible to make suggestions or reach conclusions in this regard, other assessment systems that are more specifi c can and should be added, given that a HICP in itself does not allow inferences to be made regarding the quality of the care provided.
Application of this proposal for assessment of HICPs to health services in the municipality of São Paulo enabled full validation of its measurement properties. The indi-cators that assess operational guidelines and prevention and control activities against hospital infection were the ones that presented the best internal consistency, discriminant validity and construct validity results.
In conclusion, the validity of the instrument for assessing HICPs, with the possibility of application with a scien-tifi c basis, will allow a diagnosis of the real situation of these programs throughout the national territory.
1. Arias KM, Soule BM. Manual de controle de infecções da APIC/ JCAHO. PHM, tradutor. Porto Alegre: Artmed; 2008.
2. Campbell SM, Braspenning J, Hutchinson A, Marshall MN. Research methods used in developing and applying quality indicators in primary care. BMJ.
2003;326(7393):816-9.
3 Donaldson MS. Measuring the quality of health care. A statement by the National Roundtable on Health Care Quality. Division of Health Care Services. Institute of Medicine. Washington: National Academy Press; 1999.
4. Grade Working Group. Grading quality of evidence and strength of recommendations. BMJ.
2004;328(7454):14-90.
5. Lira SA, Chaves Neto A. Pontos de dicotomização para obtenção do coefi ciente de correlação tetracórico. Rev
Cienc Exatas Nat. 2005;7(2):195-208.
6. Martins GA. Sobre Confi abilidade e Validade. Rev Bras
Gest Neg. 2006;8(20):1-12.
7. McGlynn EA, Steven MA. Developing a clinical performance measure. Am J Prev Med.
1998;14(3S):14-21. DOI:10.1016/S0749-3797(97)00032-9
8. McKibben L, Horan T, Tokars JI, Fowler G, Cardo DM, Pearson ML, et al. Guidance on public reporting of
healthcare-associated infections: recommendations of the Healthcare Infection Control Practices Advisory Committee. Am J Infect Control. 2005;33(4):217-26. DOI:10.1016/j.ajic.2005.04.001
9. Nathawani D, Gray K, Borland H. Quality indicators for antibiotic control programmes. J Hosp Inf.
2002;50(3):165-9. DOI:10.1053/jhin.2001.1171
10. Ovretveit J, Gustafson D. Using research to inform quality programmes. BMJ. 2003;326(7392):759-61.
11. Polit DF, Beck CT, Hungler BP. Fundamentos de pesquisa em enfermagem: métodos, avaliação e utilização. Thorell A, tradutor. 5. ed. Porto Alegre: Artmed; 2004.
12. Pringle M, Wilson T, Grol R. Measuring “goodness” in individuals and healthcare systems. BMJ. 2002;325(7366):704-7.
13. Santos KOB, Araujo TM, Oliveira NF. Estrutura fatorial e consistência interna do Self-Reporting Questionare (SRQ-20) em população urbana. Cad Saude
Publica. 2009;25(1):214-22.
DOI:10.1590/S0102-311X2009000100023.
14. Scrivener R, Morrell C, Baker R, Redsell S, Shaw E, Stevenson K, et al. Principles for best practice in clinical audit. National Institute for Clinical Excellence. National Institute for Clinical Excellence. London: Radclliffe Medical Press; 2002.
REFERENCES