Tania Yuka YubaI Flávia Mori SartiII Antonio Carlos Coelho CampinoIII
Heron Carlos Esvael do CarmoIII
I Programa de Pós-Graduação Interunidade
em Nutrição Humana Aplicada. Faculdade de Ciências Farmacêuticas, Faculdade de Saúde Pública e Faculdade de Economia, Administração e Contabilidade da Universidade de São Paulo. São Paulo, SP, Brasil
II Escola de Artes, Ciências e Humanidades.
Universidade de São Paulo. São Paulo, SP, Brasil
III Departamento de Economia. Faculdade de
Economia, Administração e Contabilidade. Universidade de São Paulo. São Paulo, SP, Brasill
Correspondence: Tania Yuka Yuba
Faculdade de Economia, Administração e Contabilidade
Av. Luciano Gualberto, 908 Cidade Universitária
Prédio FEA 1 – 1º Andar Corredor C Sala 133 05508-010 São Paulo, SP, Brasil
E-mail: [email protected] Received: 12/20/2011 Approved: 11/26/2012
Article available from: www.scielo.br/rsp
Evolution of the relative prices
of food groups between 1939
and 2010 in the city of Sao
Paulo, Southeastern Brazil
ABSTRACT
OBJECTIVE: To analyze the evolution of relative prices of food groups and its infl uence on public healthy eating policies.
METHODS: Data from the municipality of São Paulo between 1939 and 2010 were analyzed based on calculating index numbers. Data from the Economic Researches Foundation Institute price database and weight structures (1939 to
1988) and from the Brazilian Institute of Geography and Statistics (1989 to
2010) were used to. The price database was organized, its consistency tested and prices were defl ated using the consumer price index. Relative prices were calculated and associated to food categories and groups, according to the food pyramid guide adapted for the Brazilian population. The price indices for each group were calculated according to Laspeyres modifi ed formula. The general food price index was compared with the indices for each food group and respective category: fresh food, processed food, beverages, meat, legumes, milk and eggs, cereals and root vegetables and eating out.
RESULTS: Price indices for fat, oil, spices, sugars and sweets and processed food showed relative price reduction. Fresh food, such as fruit and vegetables, showed an increase in relative prices. Other food groups, such as cereals, fl our and pasta, meat, milk and egg, showed a steadier long term trend in relative prices.
CONCLUSIONS: The evolution of relative prices of food in the city of Sao Paulo demonstrates a negative trend towards healthy eating at household level in the long run.
Trends in the evolution of Brazilian eating patterns show a signifi cant increase in the consumption of processed foods with high levels of simple sugars, sodium and lipids (foods which characterize an unhe-althy diet). Associated with reduced consumption of
fresh foods (standard markers of healthy eating).10
The nutritional profi le of Brazilian adults has changed signifi cantly since the 1970s. This transition process is characterized by the gradual decrease in the proportion of malnourished individuals and the continued increase
in prevalence of obesity.12
The change in Brazilian eating patterns is allied to life style changes due to urbanization and technological advances, such as the progressive reduction in energy expenditure at work and on household tasks. This results in an increase in the prevalence of overweight and obesity.18,19
The result of the changing nutritional panorama in the country includes increased prevalence of overweight and obesity in the population and changes in the national
morbidity profi le, burdening the health care system.3,15,17
Food consumption is infl uenced by a wide variety of factors, especially economic determinants, such as rela-tive prices and income.4,11,17,a Since the end of the 1930s,
factors linked to supply, such as improved technology and increased scales of production, accompanied by increased demand, have enabled the price per calorie of
processed food to be reduced.8,b Studies show that the
price per calorie of fresh food, more subject to weather conditions and pests (so-called supply shock), is greater than that of processed food.
Analysis of the development of cost distribution and of relative prices of food categories and groups,
accor-ding to parameters of nutritional interest,4,5 support the
proposal of public policies in favor of healthy eating.5,16,c
There is the possibility of increasing tax rates on food considered unhealthy, as well as subsidizing the cost of foods considered to be healthier, from the analysis of
the effects on prices of specifi c food groups.5,6 Studies
of the impact of taxation and food subsidies should be based on observation of historical patterns of the evolution of food prices, coupled with analysis of dietary patterns in the population. Such analyses and
INTRODUCTION
the evolution of relative prices allow the relationships of substitution and complementarity between foods and food groups, considering the complexity of the tax
structure in Brazil.1
The main databases used for carrying out such studies are the Household Budget Surveys (POF) and sets of food prices, which make up the databases necessary for calculating the Consumer Price Index (IPC).
The aim of this study was to analyze the evolution of relative prices of food group products and its infl uence on public healthy eating policies.
METHODS
This article was based on analysis of historical data from the IPC of the Fundação Instituto de Pesquisas
Econômicas (FIPE) from the 1930s onwards.d The
methodology used to calculate the series of index-numbers of defl ated prices, relative prices for the groups and food basket for the last seven decades was based
on “index-number theory”.e
The series of index-numbers for defl ated and relative prices of food groups in Sao Paulo, SP, Southeastern Brazil between 1939 and 2010, was carried out based on the database constructed from the following sources: the municipality of Sao Paulo database of food prices based on the municipality of Sao Paulo Consumer Price
Index Research, known as IPC-FIPE,d and weighted
structures generated based on the Household Budget Survey carried out by the Sao Paulo city hall and FIPE (representative of the municipality of Sao Paulo) and Brazilian Institute of Geography and Statistics – IBGE
(representative of the Sao Paulo metropolitan region).c,f
The database of prices used was made up of two histo-rical sets of nominal prices referring to food and drinks included in price research for calculating the IPC-FIPE. The fi rst set of data (prices from January 1939 to December 1996) referred to monthly price records without distinguishing the establishments surveyed.
The second set of data (prices from January 1989 to May 2010) referred to weekly prices recording the establishments surveyed. The number of food products included between a minimum of 36 items at
a European Food International Council. The determinants of food choice. Brussels; 2005.
b Lavinas L. Acessibilidade alimentar e estabilização econômica nos anos 90. Rio de Janeiro: Instituto de Pesquisa Econômica Aplicada; 1998.
(Texto para discussão, 591).
c Instituto Brasileiro de Geografi a e Estatística. Pesquisa de orçamentos familiares 2002-2003: análise da disponibilidade domiciliar de
alimentos e do estado nutricional no Brasil. Rio de Janeiro; 2003.
d Fundação Instituto de Pesquisas Econômicas. Banco de dados de preços do IPC-FIPE. São Paulo; 2011.
e Carmo HCE. Índice de preços ao consumidor: teoria e análise de modelos factíveis considerando as bases de dados disponíveis [tese de livre
docência]. São Paulo: Universidade de São Paulo; 2004.
f Instituto Brasileiro de Geografi a e Estatística. Pesquisa de orçamentos familiares 2008-2009: análise da disponibilidade domiciliar de
the start of the data set and a maximum of 89 items in the most recent period. In general each product had more than one specifi cation of type, brand, unit, among other characteristics.
The two sets were made compatible by converting the data of the second set into mean monthly prices. Priority was given to prices in the most recent set in the time period in which the two sets overlapped, for greater accuracy.
Due to the signifi cant infl ation accumulated in the period, as well as various changes in the Brazilian
currencyg (from a thousand Reis to the Real), changes
in the reference units of measurement for foods and missing data, a lot of work was involved in making the data compatible to convert the values into Reais, based on the conversion of the data to the current currency.
The prices series were deflated using the general IPC-FIPE for converting prices into Reais as of May 2010. The defl ation procedure was based on the formula
used to calculate IPC-FIPE.h
Price sets for each of the food products was tested for consistency to identify and rectify discrepant obser-vations (outliers). The values were excluded from the database in the case of distortions for which the source of the error could not be identifi ed. Imputation methods were used to estimate missing data in the case of omission of prices and/or weighting.
The monthly price set data were converted into mean annual price sets considering seasonal variations, the temporal extent of the set and the aim of the study. Based on the POF, weighting structures were deter-mined which represented the distribution patterns of household spending on foodstuffs.
The analysis of the evolution of spending patterns on foodstuffs in the municipality of Sao Paulo is based on weighted structures obtained for the modal income class limited to the range of one to eight minimum
wagesi in the POFs carried out by the IBGE in 1987
to 1988, 1995 to 1996 and 2002 to 2003 (Sao Paulo
metropolitan region).j,k
An index-number of prices is a statistical mean of the relative variation in the price level of a heterogeneous set of good and services in a sequence of periods. Index-numbers may be seen as a method of statistical measuring and estimating, as in the case of the IPC, in which the process of obtaining the data (products,
location of data collection, consumers etc.) require the
use of sampling methods.f,j
The theory of index-numbers of consumer prices is based on the premise of the consumers’ rational beha-vior and their searching to achieve the maximum level of satisfaction via consuming goods and services. The restrictions in this theory are disposable income, prices of consumer goods and personal characteristics among other attributes in a set of periods.
Assuming the consumption of foodstuffs in a fi xed proportion, as a simplifying hypothesis, the correspon-ding formula would be the modifi ed Laspeyres formula (weighted arithmetic mean of relative price). The formula was applied to generating series of index-numbers for
each food group and the set of foodstuffs.f,h,j
The POF are carried out sporadically and their results are presented with a signifi cant lag, making it necessary to estimate the evolution of the weightings, period by period, between them. Using the modifi ed Laspeyres formula as a reference, the weights for each food and food group are updated for each period, using the
following formula.j
When: wi,t-1 the weighting of item i in the period t-1
(base of the calculation); wi,t-2 the weighting of item i
in the preceding period (t-2); Ri,(t-1,t-2) is the relative of item i between the periods t-1 and t-2; and I(t-1,t-2) is the
general price index between periods t-1 and t-2. As this is a recursive formula, it is important to defi ne the initial period and the corresponding weighting structure
(wi,0), obtained directly from a POF denominated the
weighting base period.j
The time series representative of the evolution in the level of prices and relative prices of each group were generated by the accumulation of mobile indices between the two periods based on a base period for comparison which, by convention, assumes a value of 100, although to simplify the presentation of results it is was decided to use the value 1.00 as reference.
The foodstuffs recorded in the price database were clas-sifi ed into food categories and groups according to the nutritional characteristics of the groups. Six categories were defi ned, based on 17 food groups: Fresh food (fruit, legumes, vegetables); Processed food (sugars, animal
g Banco Central do Brasil. Síntese dos padrões monetários brasileiros. Brasília; 2000 [cited 2010 May 1]. Available from: http://www.bcb.gov.
br/htms/museu-espacos/S%C3%ADntesePadroesMonetariosBrasileiros.pdf
h Rizzieri J, Carmo HCE. Retrospectiva histórica e metodológica do IPC-FIPE. São Paulo: Fundação Instituto de Pesquisas Econômicas; 1995. i Purchasing power as of May 2010 was used as the reference.
j Carmo HCE. Impacto nutricional da evolução dos preços dos alimentos em São Paulo, 1980 [dissertação de mestrado]. São Paulo:
Universidade de São Paulo; 1980.
k Instituto Brasileiro de Geografi a e Estatística. Índice Nacional de Preços ao Consumidor - INPC. Sistema IBGE de Recuperação Automática
fats, vegetable oils, processed foods); Beverages (swee-tened drinks, alcoholic drinks, tea, coffee and others); Meat, pulses, dairy and eggs (meat, pulses, milk and milk derivatives, and eggs); Cereals and tubers (cereals, fl our and pasta, tubers and root vegetables); Eating out.
Inclusion of food products in each category and group was based on objective criteria concerning their nutri-tional composition, including levels of added salt, sugar, fat and oil in their production process (in the case of the processed food group). Items such as processed meat (sausage, salami among others), pre-packaged foods (instant, dough-based meals), sweets (chocolate, candies, cookies among others) and savory snacks (crackers, pre-packaged snacks among others) were included in the processed food group. The sweetened drink group included soft drinks and other drinks with added sugar, and were considered separately from non-alcoholic drinks without added sugar (tea and coffee, among others), although all belong to the overall “beverages” category.
RESULTS
The share of food expenses in the family budget in the city showed a downward trend during the period: from 58.6% (in the 1930s) to 25.6% (in the 2000s) of household spending (Table 1).
The food categories and groups behaved differently with regards to relative participation. The share of spending on eating out was relatively insignifi cant until the beginning of the 1970s and then showed a signifi cant increase until the end of the 1990s. After this, it slowed, displacing the proportional share of the other food groups consumed in the home.
Fresh food tended to increase its share in household food from 1972 to 1988, then moving to a lower share, whereas processed foods maintained their proportional share in household spending over time.
The share occupied by the cereals, fl our and dough cate-gory in the family budget decreased over time (35.99% in 1939 to 13.17% in 2006); in the meat, pulses, dairy and eggs category, the percentage of their share in spending oscillated around 30%, with the signifi cant exception of the share in the 1989-1990 POF.
The percentage share of sweetened drinks in household spending increased from 1991 to 1998 and has remained at the same level since then. Alcoholic drinks kept the same share throughout the period (with the exception of 1991 to 1998) and the other, non-alcoholic, drinks (tea, coffee and others) showed a slight decline in their percentage share of the household budget.
With regards to the evolution of the index number of overall relative food process (index of nominal food
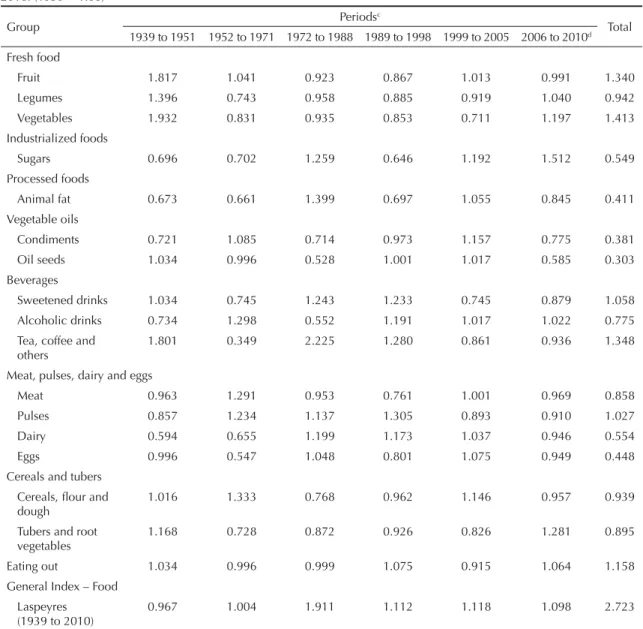
prices, defl ated by the IPC-FIPE) and of the index numbers of the relative prices of the food groups (index of nominal food group prices, defl ated using the index of nominal food prices), it was observed that the index number of accumulate prices was 2.723, which indicates an increase of around 170% of the relative price of food between 1939 and 2010. The greatest increases in relative food price took place in the years 1972 and 1988.
With regards the behavior of the relative food prices of the food categories, it was found that over the period analyzed the relative prices of fresh food, beverages and eating out showed a tendency to increase (Table 2). On the other hand, the categories which showed a reduction in relative prices were: meat, pulses, dairy, eggs and processed food. The relative prices of cereals and tubers fell, but less than the percentage difference between the index numbers generated for the two alternatives.
The most detailed analysis of evolution according to categories and food groups can be seen in the Figure (a-f). The indicators regarding fruit and vegetables show variation rates above the indicators of the prices of legumes. Moreover, signifi cant oscillations were recorded in the period, especially at the beginning of the 1940s and 1950s (Figure, a).
Fat, oil, sugar and processed foods, markers of patterns of unhealthy eating, showed more representative oscillations until the mid-1960s. The gradual replace-ment of animal fats by vegetable oils was marked by the substantial fall in the price of vegetable oil until the 1950s. From the 1970s onwards, both groups fell at a constant rhythm until 2010 (Figure, b).
There was signifi cant oscillation in the group of tea and coffee, whereas alcoholic drinks maintained indicators of low price variation, remaining below the overall index of food prices. The index of relative prices for sweetened drinks remained below that of overall food until the end of the 1980s, showing a signifi cant increase until the mid-1990s (Figure, c).
The price indices regarding the groups of meat, dairy, eggs and pulses, high-protein foods, showed two distinct patterns in their price evolution. There were greater fl uctuations in the price levels of meat and pulses, maintaining levels above those of eggs, and dairy; the greatest oscillations were in the price levels of the pulses group (beans), a food product which is more exposed to supply shocks related to climate. There was a tendency for eggs and dairy to decrease until the mid-1970s, followed by stabilization at levels lower than food in general (Figure, d).
Eating out had a slight tendency to increase, mainly due to the increased share of eating out in the household budget from the 1990s onwards (Figure, f).
DISCUSSION
There was a signifi cant fall in the proportion of the household budget spent on food; in contrast, spending on eating out had positive impetus over time, due to life style changes in Brazilian urban centers throughout the period. The food groups analyzed evolved differently according to their respective conditions of production, linked to lifestyle changes of people living in Sao Paulo.
Relative prices for processed foods showed a visible tendency to fall compared with the other food items.
A signifi cant decrease was noted in the relative prices of vegetable oils at the beginning of the period analyzed (until the 1950s). This resulted in the fi rst symbolic change of people living in Sao Paulo spending patterns on food to be consumed in the home, the beginning of a process of urbanization and industrialization in the municipality: the substitution of animal fat for vegetable oils.
The relative prices of fresh food such as fruit and vege-tables tended to increase, especially due to variability in the conditions of production and supply, as well as greater perishability and less practicality in terms of preparation time and method of consumption.
The observed tendencies of the relative prices are consistent with the results of other studies with regards
Table 1. Evolution of percentage share of the food groups in household spending. Sao Paulo, SP, Southeastern Brazil, 1939 to 2010.
Food groups
Periods (%)a 1939 to
1951 1952 to 1971 1972 to 1988 1989 to 1990 1991 to 1998 1999 to 2005 2006 to 2010
Fresh food 7.1 10.1 15.1 6.9 5.3 8.8 7.7
Fruit 1.9 3.5 7.2 2.3 1.5 5.2 3.2
Legumes 4.6 5.3 5.4 3.5 2.8 2.8 3.7
Vegetables 0.6 1.2 2.5 1.1 1.0 0.8 0.8
Industrialized foods 19.5 17.8 15.1 10.6 11.8 12.1 15.1
Sugars 7.9 5.5 2.9 2.0 2.9 1.3 3.6
Processed foods 0.3 3.6 4.4 6.0 6.3 7.2 8.7
Animal fat 7.8 5.9 0.9 0.1 0.0 0.2 0.3
Vegetable oils 3.1 2.3 5.9 1.9 2.3 2.2 2.0
Condiments 0.4 0.5 0.8 0.4 0.2 0.6 0.3
Oil seeds 0.0 0.0 0.4 0.2 0.2 0.5 0.2
Beverages 6.1 10.2 6.2 6.9 11.8 8.6 8.9
Sweetened drinks 0.4 0.6 1.3 2.1 4.3 4.4 4.2
Alcoholic drinks 2.3 1.8 1.5 2.5 5.5 1.7 2.6
Tea, coffee and others 3.5 7.8 3.4 2.3 2.0 2.5 2.1
Meat, pulses, dairy and eggs 27.8 30.6 33.8 43.2 31.2 35.8 25.9
Meat 14.5 16.8 18.8 24.8 15.5 19.2 14.0
Pulses 4.7 4.3 3.8 6.0 1.7 1.8 2.0
Dairy 6.6 6.2 8.2 9.4 12.8 13.6 8.8
Eggs 2.0 3.2 3.0 3.1 1.2 1.2 1.1
Cereals and tubers 39.5 31.4 22.4 12.4 14.3 17.3 14.3
Cereals, fl our and dough 36.0 27.4 19.4 9.8 12.9 15.8 13.2
Tubers and root vegetables 3.5 4.1 3.0 2.5 1.4 1.6 1.1
Eating out 0.0 0.0 7.3 20.1 25.6 17.4 28.1
Total 100.0 100.0 100.0 100.0 100.0 100.0 100.0
Overall food 58.5 51.2 44.8 39.1 30.4 26.4 25.6
the recent evolution in prices of different food groups, especially in the comparison between those considered
healthy and unhealthy.2,6,11
A study carried out in Mexico evaluated variations in food prices and their nutrients for the last three decades. The prices of basic foodstuffs (such as corn and wheat) increased over the last decade and prices of protein based foods (such as beef and fi sh) initially increased, but then became cheaper over the course of the 1990s.
The prices of the majority of oils, fats and processed foods increased at rates below the infl ation of overall food prices, making them cheaper than fresh foods. Correlation analysis showed a negative association
between a food’s energy density and its cost.14
Drewnowski & Specter7 analyzed the prices of
diffe-rent type of foods and observed that those considered unhealthy are comparatively cheaper in terms of price per calorie than healthy foodstuffs.
Table 2. Index-numbers of relative prices for the food groupsa and food overall. Sao Paulo, SP, Southeastern Brazil, 1939 to
2010. (1939 = 1.00)b
Group Periods
c
Total 1939 to 1951 1952 to 1971 1972 to 1988 1989 to 1998 1999 to 2005 2006 to 2010d Fresh food
Fruit 1.817 1.041 0.923 0.867 1.013 0.991 1.340
Legumes 1.396 0.743 0.958 0.885 0.919 1.040 0.942
Vegetables 1.932 0.831 0.935 0.853 0.711 1.197 1.413
Industrialized foods
Sugars 0.696 0.702 1.259 0.646 1.192 1.512 0.549
Processed foods
Animal fat 0.673 0.661 1.399 0.697 1.055 0.845 0.411
Vegetable oils
Condiments 0.721 1.085 0.714 0.973 1.157 0.775 0.381
Oil seeds 1.034 0.996 0.528 1.001 1.017 0.585 0.303
Beverages
Sweetened drinks 1.034 0.745 1.243 1.233 0.745 0.879 1.058
Alcoholic drinks 0.734 1.298 0.552 1.191 1.017 1.022 0.775
Tea, coffee and others
1.801 0.349 2.225 1.280 0.861 0.936 1.348
Meat, pulses, dairy and eggs
Meat 0.963 1.291 0.953 0.761 1.001 0.969 0.858
Pulses 0.857 1.234 1.137 1.305 0.893 0.910 1.027
Dairy 0.594 0.655 1.199 1.173 1.037 0.946 0.554
Eggs 0.996 0.547 1.048 0.801 1.075 0.949 0.448
Cereals and tubers Cereals, fl our and dough
1.016 1.333 0.768 0.962 1.146 0.957 0.939
Tubers and root
vegetables 1.168 0.728 0.872 0.926 0.826 1.281 0.895
Eating out 1.034 0.996 0.999 1.075 0.915 1.064 1.158
General Index – Food Laspeyres
(1939 to 2010)
0.967 1.004 1.911 1.112 1.118 1.098 2.723
Source: Fundação Instituto de Pesquisas Econômicas: Consumer Price Index (1939 to 1988); IBGE, National Index of Consumer Prices (1989 to 2010).
a The indices of relative prices of food groups were calculated by dividing the index-number of prices of food groups by overall index calculated by the Laspeyres formula.
b 1939 = 1.00, as 1939 is the reference year for the series of index-numbers calculated.
c Refers to the periods between household budget surveys, the basis for determining the weights for weighting the component items of household expenditure.
7
(a) F
resh food: F
ruit / Leg
umes / V egetables Fr uit Legumes V egetables
(b) Processed food / S
ugars / Oils / F
at (c) Sweete ned dri nks / Alcoholic dri nks /
Tea, coffee and others
Alcoholic dri
nks Sweete
ned dri
nks
Tea. coffee and others
Figure. Relative Price indices according to food categories and groups. Sao Paulo, SP, Southeastern Brazil, 1939 to 2010.
(d) Meat / Pulses / Eggs / Dairy
(e) Cereals, flour and dough / Tubers
(f) Eating out 0.0000
3.0000
2.5000
2.0000
1.5000
1.0000
0.5000
0.0000 3.0000
2.5000
2.0000
1.5000
1.0000
0.5000
0.0000 3.0000
2.5000
2.0000
1.5000
1.0000
0.5000
Cereals. flour and dough
Pulses Eggs Dairy
Meat
Eating out
Tubers
The decline in the relative index of processed foods, linked to higher incomes and high concentration of calories encourage th consolidation of unhealthy eating habits. This results in unbalanced diets which may lead to nutritional defi ciencies and/or the onset of chronic
dise-ases such as obesity, dyslipidemia and hypertension.17
The fl uctuation in food prices is strongly linked to changes in consumption, considering the need to alter the family budget in line with price variations in order to maintain the patterns of family life. Price increases in food items lead to reductions in the resources available to spend on other, necessary products and services such as medicines, rent and transport. Substituting more expensive food with cheaper items, the family seeks food alternatives which enable them to maintain other unavoidable household expenses.
Monteiro13 emphasized the negative aspects of such
foodstuffs for human health, based on their characte-ristics of low nutritional content (nutrient per unit of energy) and high energy density (energy by volume). The evolution of relative price indices is additional evidence of the stimulated consumption of unhealthy
products observed in the last few decades.10
In socioeconomic terms, the following stand out: the effects of technological advances in food produc-tion, including changes in food distribution in Brazil associated with modernization and the increasing market power of food retailers; economic stability; the economic liberalization of the country, stimulating
competition;1,b,l advances in agricultural research with
consequent increased productivity; decreases in the margin of processing and commercialization; eventual
tax reductions;m profi ts from productivity transferred
from agriculture to industry; effi ciency gains in
logis-tics, supply and distribution systems.8
The principal implication of the overall fall in food prices is increased spending power, notably in lower income groups, especially after infl ation stabilized in the mid-1990s. The evolution of the relative prices
of processed food has shown a consistent decrease over the period, resulting in consumers having more potential to buy.
In cultural terms: intense urbanization, together with women’s entrance into the labor market, has reduced time spent preparing and consuming meals in the home and redirected the selection of foods for daily consump-tion based on the combinaconsump-tions of desirable, intrinsic characteristics of such products: practicality in prepa-ration and consumption, taste and durability derived from the inclusion of ingredients which encourage the fl avor and the preservation of the food (salt, sugar and fat) and variety in the options based on the possibility of diversifying the fi nal product (adding fl avor, changes in texture, fortifying nutrients, size of packaging, among others), in addition to reputation through brand building by marketing campaigns and guaranteeing satiation at a lower cost through the composition of the food itself (energy density).
Public nutrition policies should aim to promote healthy eating, incentivizing the consumption of fresh foods based on strategies of increasing the populations’ access to such products. At the same time, there should be restrictions on stimuli to consume processed foods of high calorie density, low nutritional content and high
levels of sodium, fat and sugars.14
Stimulating the choice of health foodstuffs by the consumer may be conditioned through education programs and changes in the tax systems based on
imposing high tax on unhealthy items9 and subsidizing
foodstuffs classed as healthy. The primary objective of such public policies is to constitute a set of preventative public health actions, through reducing the prevalence of overweight and obesity in the Brazilian population, aiming to control the onset of non-transmissible chronic diseases and improve the population’s quality of life. To conclude, the trends in evolution of relative prices in the municipality of Sao Paulo do not encourage long term healthy eating habits in households.
l Cyrillo DC. O papel dos supermercados no varejo de alimentos. São Paulo: Fundação Instituto de Pesquisas Econômicas; 1987. m Barros JMD, Rizzieri JB, Picchetti P. Os efeitos da pesquisa agrícola para o consumidor. São Paulo: Fundação Instituto de Pesquisas
1. Belik W. Muito além da porteira. Coleção de teses UNICAMP. Campinas: UNICAMP; 2001.
2. Bezerra IN, Sichieri R. Características e gastos com alimentação fora do domicílio no Brasil. Rev Saude Publica. 2010;44(2):221-9. DOI:
http://dx.doi.org/10.1590/S0034-89102010000200001 3. Bloom DE, Cafi ero ET, Jané-Llopis E, Abrahams-Gessel
S, Bloom LR, Fathima S, et al. The global economic burden of non-communicable diseases. Geneva: World Economic Forum; 2011.
4. Claro RM, Carmo HCE, Machado FMS, Monteiro CA. Income, food prices, and participation of fruit and vegetables in the diet. Rev Saude Publica. 2007;41(4):1-8. DOI: http://dx.doi.org/10.1590/S0034-89102007000400009 5. Claro RM, Sarti FM, Bandoni DH. Evolução
da disponibilidade domiciliar de alimentos no município de São Paulo no período de 1979 a 1999. Rev Nutr. 2007;20(5):483-90. DOI:
http://dx.doi.org/10.1590/S1415-52732007000500004 6. Drewnowski A, Darmon N. Food choices and diet costs:
An economic analysis. J Nutr. 2005;135(4):900-4. 7. Drewnowski A, Specter S. Poverty and obesity: The
role of energy density and energy costs. Am J Clin Nutr. 2004;79(1):6-16.
8. Farina EMMQ, Nunes R. Evolução do sistema agroalimentar no Brasil e a redução de preços para o consumidor: Os efeitos da atuação dos grandes compradores. Rev Econ Aplic. 2004;8(2):347-76. 9. Giambiagi F, Além AC. Finanças públicas: Teoria e
prática no Brasil. Rio de Janeiro: Elsevier; 2008. 10. Levy RB, Claro RM, Mondini L, Sichieri R, Monteiro
CA. Distribuição regional e socioeconômica
da disponibilidade domiciliar de alimentos no Brasil. Rev Saude Publica. 2012;46(1):6-15. DOI: http://dx.doi.org/10.1590/S0034-89102011005000088 11. Mondini L, Levy RB, Silva EN. Alimentação na região
metropolitana de São Paulo por classe de renda. An Indic Agroneg. 2010;5(12):1-5.
12. Monteiro CA, Conde WL, Popkin BM. Is obesity replacing or adding to under-nutrition? Evidence from different social classes in Brazil. Public Health Nutr. 2002;5(1A):105-12.
13. Monteiro CA. Nutrition and health, the issue is not food, nor nutrients, so much as processing. Publ Health Nutr. 2009;12(5):729-31. DOI: http://dx.doi.org/10.1017/S1368980009005291 14. Ortiz-Hernández L. Evolución de los precios de los
alimentos y nutrimentos en México entre 1973 y 2004. Arch Latinoam Nutr. 2006;56(3):201-15.
15. Philippi ST, Latterza AR, Cruz ATR, Ribeiro LC. Pirâmide alimentar adaptada: guia para escolha dos alimentos. Rev Nutr. 1999;12(1):65-80. DOI: http://dx.doi.org/10.1590/S1415-52731999000100006 16. Sarti FM, Claro RM, Bandoni DH. Contribuições
de estudos sobre demanda de alimentos à formulação de políticas públicas de nutrição. Cad Saude Publica. 2011;27(4):639-47. DOI: http://dx.doi.org/10.1590/S0102-311X2011000400003 17. World Health Organization. Diet, nutrition and
the prevention of chronic diseases. Geneva; 2003. (Technical Report Series, 916).
18. World Health Organization. Diet, physical activity and health. Geneva; 2002.
19. World Health Organization. The world report 2002: Reducing risks, promoting healthy life. Geneva; 2002. REFERENCES