A Work Project, presented as part of the requirements for the Award of a Masters Degree in Finance from NOVA – School of Business and Economics
Enhancement of an implemented rating model and
impact on existing risk management processes
A hands-on approach from financial supplier risk management within the automotive industry
Tobias Mägerle (618)
NOVA School of Business and Economics
A project carried out under the supervision of:
Prof. Miguel Ferreira NOVA SBE, Lisbon, Portugal Asmus Carstensen Daimler AG, Stuttgart, Germany
Abstract
The purpose of this paper is to conduct a methodical drawback analysis of a financial supplier risk management approach which is currently implemented in the automotive industry. Based on identified methodical flaws, the risk assessment model is further developed by introducing a malus system which incorporates hidden risks into the model and by revising the derivation of the most central risk measure in the current model. Both methodical changes lead to significant enhancements in terms of risk assessment accuracy, supplier identification and workload efficiency.
Keywords Supply chain management, risk management, risk assessment, financial
supplier risk
1
Introduction
Supplier risk management handles risk related to the manufacture supply chain. Risk identification, evaluation and monitoring are essential factors for successful supplier risk management. Among numerous risks related to the supply chain, this paper focuses on supplier risk from a financial point of view. The purpose of financial supplier risk management is to deal with risks resulting from financially distressed suppliers. As the potential impact of supply chain disruptions caused by a financially distressed or bankrupt supplier can be very large, financial risk plays an important role within supplier risk management. The negative effects of supply chain disruptions include long lead-times, stock-outs, inability to meet customer demands and increases in costs1. The worst-case, a production stop caused by a supplier insolvency, can affect the financial performance of the firm significantly. In 1997 Boeing lost deals worth $2.6 billion due
1
to delivery problems of two key suppliers for critical parts2. Besides the direct financial impact on the business performance, a supply chain disruption can cause undesirable side-effects such as a significant reputational damage. By means of a hands-on example from Daimler AG, an original equipment manufacturer (OEM) of the automotive industry, the importance and implementation of financial supplier risk management is shown. Furthermore, a drawback analysis of a currently implemented rating methodology is conducted and an enhancement of this approach is developed. In particular, the combinational logic of two main components of the rating model, a financial statement assessment and a report containing qualitative information, is significantly enhanced resulting in an end-user friendly risk measure with high accuracy. For a further adjustment of the initial risk assessment, a malus system is developed and implemented in order to incorporate non-considered risks into the risk evaluation.
The purpose of this paper is to provide an approach how supplier risk can be managed and mitigated in practice. Moreover, this paper shows how to significantly improve the financial supplier risk assessment in a supplier risk management framework from a practitioner’s perspective.
The developed methodical enhancements lead to a considerable increase in rating accuracy. Furthermore, workload focus and efficiency are improved significantly. The remainder of this paper is organized as follows. Section 2 provides a brief overview of the recent supply chain risk management literature. Section 3 describes the currently implemented financial supplier risk management system at Daimler AG. Subsequently, a detailed drawback analysis of the currently implemented rating model is conducted in
2
section 4. Based on the results from the drawback analysis, methodical enhancements of the rating model are developed and presented in section 5. Section 6 analyses the impact of the methodical changes on the existing risk management processes. Section 7 concludes.
2
Literature Review
In the recent literature, supply chain risk management (SCRM) has gained attention. The increased attention towards SCRM is pointed out by Jüttner (2005). Her survey shows evidence for an increase in supply chain vulnerability. It has been pointed out that this is a consequence from a shift towards more efficient supply chains3. Christopher et al. (2004) highlighted the increased supply chain risk as a result from a trend towards increasingly complex networks of interdependent organizations and towards a leaner supply chain. The importance of SCRM is emphasized by recent evidence for the high detrimental impact of supply chain disruptions on purchasing companies4. For example, Toyota suffered a loss of $40 million per day due to a production stop caused by a fire at one of its suppliers5. Consequently, the increased vulnerability of supply networks and the significant impact of supply chain disruptions result in a further need for research on this subject.
Since SCRM has just gained attention recently, the majority of SCRM literature follows a more general approach such as Hallikas et al. (2004) who divided the typical risk management process of an enterprise into four parts: risk identification, risk assessment, decision and implementation of risk management actions and risk monitoring.
3
See McGillivray (2000); Engardio (2001)
4
See Zsidisin et al. (2000)
5
Even though this brief literature review illustrates an augmented interest in SCRM, there is a lack of SCRM literature regarding specific risk factors such as supply chain disruptions due to supplier insolvencies. The present paper aims to fill this gap in literature by focusing on supply risk resulting from financially distressed suppliers.
3
Financial supplier risk management at Daimler AG
Financial supplier risk management (FSRM) at Daimler AG (Daimler) is divided into two parts: preventive and reactive FSRM. While the major purpose of preventive FSRM is to identify, evaluate and monitor supplier risk, reactive FSRM manages follow-up costs and minimizes the monetary impact when Daimler faces supply chain disruptions. The major risk tool of the preventive FSRM is the “External Rating” (ER), a risk assessment provided by an external rating agency and based on a methodology jointly developed by Daimler and the rating agency. The ER serves as an initial risk assessment tool and helps to manage workload efficiently as the level of detail of the follow-up supplier risk analysis depends on the initial rating result of the ER. By providing a comprehensive risk measure, the so-called risk cluster, the workload can be focused on the most risky suppliers. Moreover, it is used to constantly monitor supplier risk on corporate level and to track changes in risk evaluation.
Main elements of the External Rating (ER)
The ER has three main elements on which the assessment is based on: “Balance Sheet
financial ratios and a time-dependent development of the rating result based on historical data.
Balance Sheet rating (BSR)
The “Balance Sheet Rating” (BSR) is a probabilistic rating based on the supplier’s financial statements, including balance sheet, income statement, cash flow statement and appendices. Based on the analysis of the financial data, a probability of default6 (PD) is estimated, serving as the rating result of the BSR. Based on the PD, each supplier is classified into one of 19 BSR classes. BSR class 1 indicates the lowest risk while BSR class 19 contains the most risky suppliers. The applied statistical model setup varies with company size, business sector and level of detail of financial information. Depending on these variables, different ratios deducted from the financial statements are included in the risk assessment. This approach ensures that general supplier-specific characteristics are considered and incorporated in the model.
Commercial Report (CR)
The Commercial Report (CR) provides a complementary rating result by evaluating the solvency situation of the analysed supplier based on qualitative information such as shareholder and management structure, payment history and payment behaviour. The evaluation of the commercial report results in an index, ranging from 100 to 600. An index value of 100 indicates perfect solvency while an index value of 600 represents insolvency.
In the index range between 241 and 299 four additional factors: company size, company age, latest index change and respective region are considered to increase the
6
differentiating power of the commercial report index. This provides an additional indicator to distinguish the insolvency risk of the supplier. The assessment of these supplementary supplier information leads to an additional rating result of the CR which differs between grey and red.
In order to provide an end-user friendly and comprehensive risk measure, the BSR and
CR are combined and transformed into a “Company Risk Cluster”. Accounting for
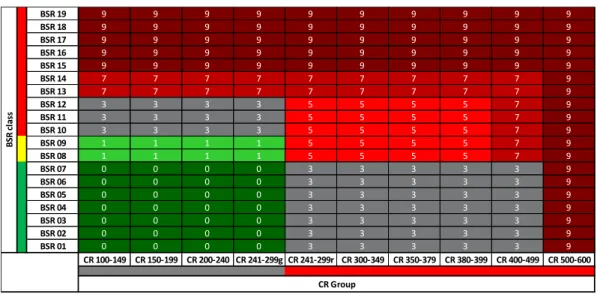
qualitative as well as quantitative supplier information, the “Company Risk Cluster” aims to fully reflect the supplier-specific risk. BSR and CR are transformed into a risk cluster according to the logic shown in table 1, in the following called “risk matrix”.
Table 1: Risk matrix: Conversion of BSR and CR result into a risk cluster
The risk matrix illustrates the conversion of BSR and CR into the risk cluster result. The
risk cluster evaluates the “Company Risk” on a scale from 0 to 9, with 0 indicating the
lowest risk while 9 representing the highest risk.
Consideration of “Country Risk”
In addition to the “Company Risk”, macroeconomic factors are taken into account to
reflect country-specific risks factors such as a regional economic downturn. In case of significantly positive or negative macroeconomic signals, the “Company Risk Cluster”
BSR 19 9 9 9 9 9 9 9 9 9 9
BSR 18 9 9 9 9 9 9 9 9 9 9
BSR 17 9 9 9 9 9 9 9 9 9 9
BSR 16 9 9 9 9 9 9 9 9 9 9
BSR 15 9 9 9 9 9 9 9 9 9 9
BSR 14 7 7 7 7 7 7 7 7 7 9
BSR 13 7 7 7 7 7 7 7 7 7 9
BSR 12 3 3 3 3 5 5 5 5 7 9
BSR 11 3 3 3 3 5 5 5 5 7 9
BSR 10 3 3 3 3 5 5 5 5 7 9
BSR 09 1 1 1 1 5 5 5 5 7 9
BSR 08 1 1 1 1 5 5 5 5 7 9
BSR 07 0 0 0 0 3 3 3 3 3 9
BSR 06 0 0 0 0 3 3 3 3 3 9
BSR 05 0 0 0 0 3 3 3 3 3 9
BSR 04 0 0 0 0 3 3 3 3 3 9
BSR 03 0 0 0 0 3 3 3 3 3 9
BSR 02 0 0 0 0 3 3 3 3 3 9
BSR 01 0 0 0 0 3 3 3 3 3 9
CR 100-149 CR 150-199 CR 200-240 CR 241-299g CR 241-299r CR 300-349 CR 350-379 CR 380-399 CR 400-499 CR 500-600
B
S
R
c
la
ss
is adjusted upwards or downwards. Given significantly positive indications, the
“Company Risk Cluster” is adjusted downwards by one cluster while in case of
significant negative indications the risk cluster adjusted upwards by either one or two clusters, depending on the magnitude of the warning signal. By being updated frequently, the inclusion of the “Country Risk” ensures prompt adjustments of the overall rating result, given significant macroeconomic improvements or deteriorations on a regional level.
The combination of “Company Risk” and “Country Risk” results in the final risk cluster, the overall rating result of the External Rating. The risk cluster has two main purposes. It serves as a risk measure and at the same time as a tool to manage workload efficiently. In particular, it determines the level of detail of the follow-up evaluation by the analyst. This emphasizes the importance of the risk cluster as a central element in the financial supplier risk management methodology.
4
Analysis and problem statement
4.1 Derivation of risk cluster: combinational logic of BSR and CR
As explained above7 the combination of the balance sheet rating and the commercial report results in a risk cluster which serves as the main risk measure of the analysed supplier. The risk matrix8 illustrates the current approach how to convert BSR class and CR index into the final risk cluster. This combinational logic was initially set based on an educated guess made by risk management experts. That was mainly due to a lack of historical data at the time of the implementation of the external rating.
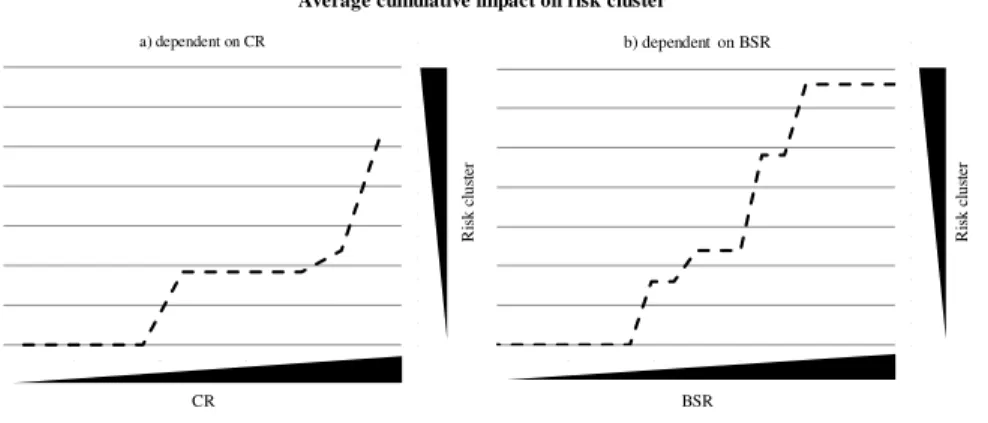
Although based on experts’ knowledge and experience, the logic has two major drawbacks. First, a worsening in either the BSR class or the CR range does not always result in a continuous worsening of the risk cluster. That means, the logic implies significant risk cluster jumps as a result of a marginal change in one of the components. This high local sensitivity of the risk cluster implies an underestimation or overestimation of risk in these areas. Furthermore the rough classification, with large areas of the risk matrix being assessed equally, implies a loss of differentiating power of the risk assessment. The biggest risk cluster jumps occur from risk cluster 3 to 9 as well as from risk cluster 1 to 5 and vice versa.
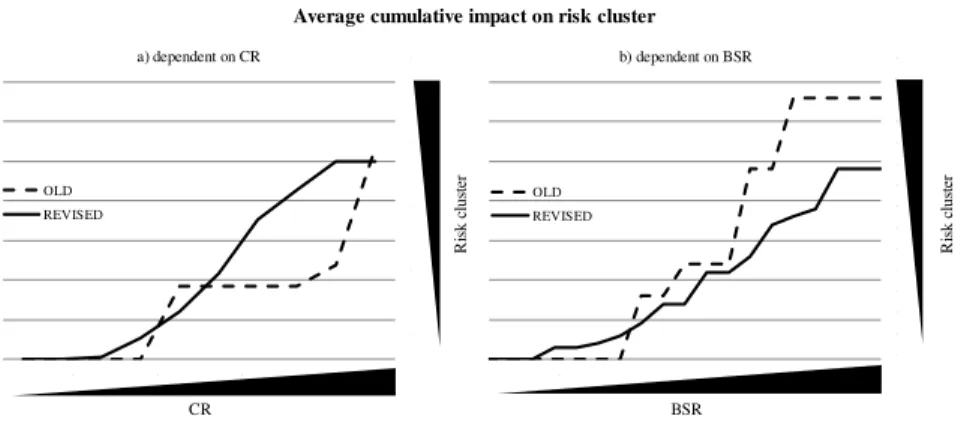
Figure 1: Impact of BSR and CR on risk cluster
7
See Chapter 3
8
See Table 1
CR BSR
R
is
k c
lus
te
r
Average cumulative impact on risk cluster
R
is
k c
lus
te
r
More precisely, e.g. at the jump from risk cluster 1 to 5, a classification of risk cluster 1 tends to underestimate the default risk while a classification of risk cluster 5 tends to overestimate the default risk. The central role of the rating model within FSRM emphasizes the importance of an accurate risk assessment tool. Since a major goal of the classification of suppliers into risk clusters is to efficiently control workload, an underestimation of default risk might result in a non-consideration of the supplier in the follow-up risk evaluation. As a result, expected monetary costs related to supplier distress and insolvencies increase for the OEM.
The second main drawback of the risk matrix is the lack of statistical foundation and empirical evidence. Since the combinational logic was specified, it has not been verified with historical data. By having specified the logic without empirical evidence, the model lacks in rating accuracy and direct comparability between suppliers. In a standardized risk assessment process as implemented in FSRM, it is crucial to ensure comparability between each supplier. Thus, the implemented logic lowers the explanatory power significantly and increases the overall supplier portfolio risk.
The potential erroneous risk evaluation caused by significant jumps and the lack of statistical foundation of the methodology clearly state the necessity to revise the current combinational logic in order to enhance the overall risk assessment quality.
4.2 Consideration of hidden risks
Just-in-time and just-in-sequence production, exceptionally long run-times of parts9 and sophisticated manufacturing technologies considerably increase the complexity and requirements for supply chain management. Given this high complexity of its supply chain, the automotive industry requires a tailor-made supplier rating approach. This is underlined by two factors. First, some financial ratios of automotive suppliers show large distributional deviations from the average firm across all industry sectors. As a consequence, several financial ratio values may imply an additional risk in the automotive sector context, i.e. certain ratio values, which are considered uncritical when evaluated based on the overall economy, are regarded to imply high risk when assessed in the automotive sector context. Thus, the supplier risk assessment should be modified. The second factor which underlines the need for a tailor-made rating approach is the low availability of frequently updated financial information. In practice, annual reports are often published with a large delay. As a result, the validity of the probabilistic rating result, the PD, decreases with time. The impact of this data quality issue is currently not considered or counterbalanced by the implemented rating model.
The data quality issue in combination with the non-consideration of sector-specific characteristics is a methodical drawback that needs to be eliminated by incorporating these hidden risks in the rating approach.
5
Rating model enhancements
Two major drawbacks of the current rating methodology are identified in section 4: First, the non-consideration of business-sector related issues and low data quality and second, the poor quality of the combinational logic of BSR and CR. In order to mitigate
9
the two methodical drawbacks and thus to improve the quality of the overall rating, a malus system is introduced to account for non-considered factors and moreover an enhanced risk matrix is developed and implemented.
5.1 Enhancement of the risk matrix
In order to overcome the identified drawback regarding the combinational logic, namely the risk cluster jumps and the lack of empirical foundation, the risk matrix is revised. The goal is to revise the currently implemented risk matrix based on historical default rates in order to reduce jumps significantly and to improve the overall rating accuracy considerably.
5.1.1 Data
The data on which the analysis is based on has been provided by the credit rating agency Daimler is working with. The data sample consists of historical default rates from a portfolio of 661,826 companies. The portfolio is deducted from the entire data universe of the rating agency. By restricting the company size in terms of turnover to be at least EUR 1 million, the data universe with more than one million companies was reduced to 661,826 companies. This size restriction was set in order to adapt the portfolio characteristics of the supplier base in the automotive sector with the purpose of increasing the validity of the following analysis10. Given the trade-off between similarity of the data sample to the OEM’s supplier base and sample size, only the restriction regarding company size was included. In this way, estimation error is reduced while data characteristics similar to the Daimler portfolio are maintained. The
10
sample consists of company data from the fiscal year 2011. In particular, the sample provides information about the BSR and CR as of December 31st, 2011 and whether the company defaulted11 until December 31st, 2012.
In addition to the historical default rates depending on both BSR and CR, predicted default rates depending on either BSR only or CR only are available.
5.1.2 Methodology
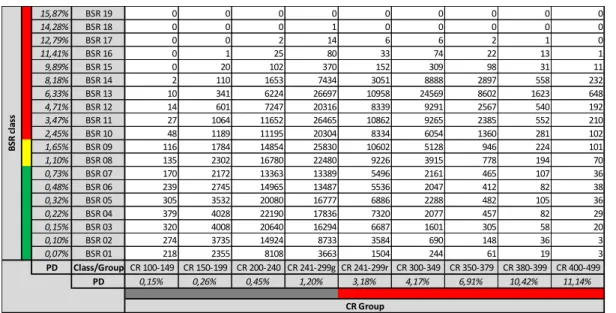
Table 2 illustrates the distribution of the data set (N=661,826 companies) within the risk matrix framework. It converts the full data sample into 171 elements on the risk matrix, each element representing a combination of BSR and CR.
Table 2: Raw data – data sample distribution and predicted PD (N=661,826)
Since the boundary areas12 of the risk matrix lack in data quantity, certain areas on the risk matrix are merged in order to reach a sufficient level of data quality. This ensures the minimization the estimation error and thus improves the subsequent robustness of the analysis results.
11
A company was considered as defaulted if it failed to meet its debt obligations or filed for bankruptcy.
12
BSR classes 16-19 and high BSR classes in combination with a high CR index
15,87% BSR 19 0 0 0 0 0 0 0 0 0
14,28% BSR 18 0 0 0 1 0 0 0 0 0
12,79% BSR 17 0 0 2 14 6 6 2 1 0
11,41% BSR 16 0 1 25 80 33 74 22 13 1
9,89% BSR 15 0 20 102 370 152 309 98 31 11
8,18% BSR 14 2 110 1653 7434 3051 8888 2897 558 232
6,33% BSR 13 10 341 6224 26697 10958 24569 8602 1623 648
4,71% BSR 12 14 601 7247 20316 8339 9291 2567 540 192
3,47% BSR 11 27 1064 11652 26465 10862 9265 2385 552 210
2,45% BSR 10 48 1189 11195 20304 8334 6054 1360 281 102
1,65% BSR 09 116 1784 14854 25830 10602 5128 946 224 101
1,10% BSR 08 135 2302 16780 22480 9226 3915 778 194 70
0,73% BSR 07 170 2172 13363 13389 5496 2161 465 107 36
0,48% BSR 06 239 2745 14965 13487 5536 2047 412 82 38
0,32% BSR 05 305 3532 20080 16777 6886 2288 482 105 36
0,22% BSR 04 379 4028 22190 17836 7320 2077 457 82 29
0,15% BSR 03 320 4008 20640 16294 6687 1601 305 58 20
0,10% BSR 02 274 3735 14924 8733 3584 690 148 36 3
0,07% BSR 01 218 2355 8108 3663 1504 244 61 19 3
PD Class/GroupCR 100-149 CR 150-199 CR 200-240 CR 241-299g CR 241-299r CR 300-349 CR 350-379 CR 380-399 CR 400-499
PD 0,15% 0,26% 0,45% 1,20% 3,18% 4,17% 6,91% 10,42% 11,14%
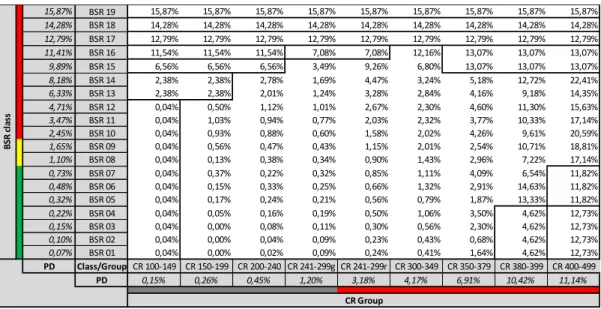
Table 3: Historical default rates
Historical default rates based on the full data sample are presented in table 3. The framed combinations show the merged areas with a homogenous default rate as a result of the grouping.
The subsequent step consists of estimating the influence of BSR and CR on the insolvency risk reflected by the PD. The goal is to obtain a risk measure dependent on both BSR and CR. In particular, the purpose is to estimate , the probability of default dependent on both BSR and CR. Besides providing an estimate for the probability of default, it provides a measure of relative risk between each element of the risk matrix. The relation between default risk, BSR and CR is estimated by conducting a polynomial linear regression with three independent variables:
with as the predicted probability of default of the respective CR index range and
as the predicted probability of default of the respective BSR class13. Predicted
13
and are provided by the rating agency
15,87% BSR 19 15,87% 15,87% 15,87% 15,87% 15,87% 15,87% 15,87% 15,87% 15,87%
14,28% BSR 18 14,28% 14,28% 14,28% 14,28% 14,28% 14,28% 14,28% 14,28% 14,28%
12,79% BSR 17 12,79% 12,79% 12,79% 12,79% 12,79% 12,79% 12,79% 12,79% 12,79%
11,41% BSR 16 11,54% 11,54% 11,54% 7,08% 7,08% 12,16% 13,07% 13,07% 13,07%
9,89% BSR 15 6,56% 6,56% 6,56% 3,49% 9,26% 6,80% 13,07% 13,07% 13,07%
8,18% BSR 14 2,38% 2,38% 2,78% 1,69% 4,47% 3,24% 5,18% 12,72% 22,41%
6,33% BSR 13 2,38% 2,38% 2,01% 1,24% 3,28% 2,84% 4,16% 9,18% 14,35%
4,71% BSR 12 0,04% 0,50% 1,12% 1,01% 2,67% 2,30% 4,60% 11,30% 15,63%
3,47% BSR 11 0,04% 1,03% 0,94% 0,77% 2,03% 2,32% 3,77% 10,33% 17,14%
2,45% BSR 10 0,04% 0,93% 0,88% 0,60% 1,58% 2,02% 4,26% 9,61% 20,59%
1,65% BSR 09 0,04% 0,56% 0,47% 0,43% 1,15% 2,01% 2,54% 10,71% 18,81%
1,10% BSR 08 0,04% 0,13% 0,38% 0,34% 0,90% 1,43% 2,96% 7,22% 17,14%
0,73% BSR 07 0,04% 0,37% 0,22% 0,32% 0,85% 1,11% 4,09% 6,54% 11,82%
0,48% BSR 06 0,04% 0,15% 0,33% 0,25% 0,66% 1,32% 2,91% 14,63% 11,82%
0,32% BSR 05 0,04% 0,17% 0,24% 0,21% 0,56% 0,79% 1,87% 13,33% 11,82%
0,22% BSR 04 0,04% 0,05% 0,16% 0,19% 0,50% 1,06% 3,50% 4,62% 12,73%
0,15% BSR 03 0,04% 0,00% 0,08% 0,11% 0,30% 0,56% 2,30% 4,62% 12,73%
0,10% BSR 02 0,04% 0,00% 0,04% 0,09% 0,23% 0,43% 0,68% 4,62% 12,73%
0,07% BSR 01 0,04% 0,00% 0,02% 0,09% 0,24% 0,41% 1,64% 4,62% 12,73%
PD Class/GroupCR 100-149 CR 150-199 CR 200-240 CR 241-299g CR 241-299r CR 300-349 CR 350-379 CR 380-399 CR 400-499
PD 0,15% 0,26% 0,45% 1,20% 3,18% 4,17% 6,91% 10,42% 11,14%
B
S
R
c
la
ss
probabilities of default are used instead of BSR classes and CR index range in order to adjust for non-linearity of BSR classes and CR index values in terms of risk.
The regression result is as follows14:
( )
( ) ( ) ( )
Previous attempts to include only non-quadratic independent variables in the regression showed worse results in terms of R² and in terms of mean squared errors. Conducting a polynomial regression, results in a higher explanatory power of the estimated function15.
5.1.3 Results of revised Risk Matrix
The regression results in estimates for , shown in table 4.
Table 4: Probabilities of default, , dependent on BSR and CR
The represents the probability of default dependent on both BSR and CR. It is a considerable advancement to the currently implemented model where PDs are available
14
Standard errors are shown in brackets
15
R²=0.91; F=571.78
BSR 19 13,66% 13,66% 13,67% 13,77% 14,46% 15,03% 17,43% 22,22% 23,45%
BSR 18 11,37% 11,37% 11,38% 11,48% 12,17% 12,74% 15,14% 19,93% 21,16%
BSR 17 9,42% 9,43% 9,44% 9,53% 10,22% 10,79% 13,19% 17,99% 19,21%
BSR 16 7,76% 7,77% 7,78% 7,87% 8,56% 9,13% 11,53% 16,33% 17,55%
BSR 15 6,12% 6,12% 6,14% 6,23% 6,92% 7,49% 9,89% 14,68% 15,91%
BSR 14 4,50% 4,50% 4,51% 4,61% 5,29% 5,87% 8,26% 13,06% 14,29%
BSR 13 3,00% 3,01% 3,02% 3,11% 3,80% 4,37% 6,77% 11,57% 12,79%
BSR 12 1,93% 1,93% 1,94% 2,04% 2,73% 3,30% 5,70% 10,49% 11,72%
BSR 11 1,25% 1,25% 1,26% 1,36% 2,04% 2,62% 5,01% 9,81% 11,04%
BSR 10 0,78% 0,78% 0,79% 0,89% 1,58% 2,15% 4,55% 9,34% 10,57%
BSR 09 0,47% 0,48% 0,49% 0,58% 1,27% 1,84% 4,24% 9,04% 10,26%
BSR 08 0,29% 0,29% 0,30% 0,40% 1,09% 1,66% 4,06% 8,85% 10,08%
BSR 07 0,18% 0,19% 0,20% 0,29% 0,98% 1,55% 3,95% 8,75% 9,97%
BSR 06 0,12% 0,12% 0,13% 0,23% 0,91% 1,48% 3,88% 8,68% 9,91%
BSR 05 0,08% 0,08% 0,09% 0,19% 0,87% 1,44% 3,84% 8,64% 9,87%
BSR 04 0,05% 0,05% 0,07% 0,16% 0,85% 1,42% 3,82% 8,61% 9,84%
BSR 03 0,04% 0,04% 0,05% 0,15% 0,83% 1,40% 3,80% 8,60% 9,83%
BSR 02 0,02% 0,03% 0,04% 0,14% 0,82% 1,39% 3,79% 8,59% 9,82%
BSR 01 0,02% 0,02% 0,03% 0,13% 0,81% 1,39% 3,78% 8,58% 9,81%
depending on one factor (BSR) only. The large PD-spread among BSR classes as well as among CR index ranges, illustrate the high impact of both factors on the PD. Given that the formerly implemented rating model does not consider both factors in the estimation of a PD, the old approach is assumed to be overly simplistic. As a result, the discretionary power increases considerably with the implementation of the revised risk matrix. Moreover, the revised risk matrix enables direct comparison between each combination, resulting in a relative risk measure.
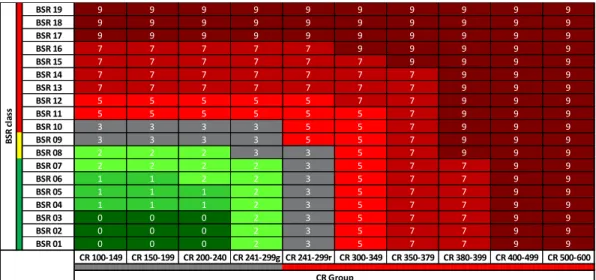
Based on the , each combination is assigned with a risk cluster. Table 5 shows the classification of risk cluster.
Table 5: Revised risk matrix - transformation of PD into risk cluster
Given the direct comparability, the approach ensures that the workload is consistently focused on the suppliers with the highest default risk. Moreover, by introducing risk
cluster “2”, the revised risk matrix establishes a more continuous worsening of the risk cluster with a simultaneous worsening of either BSR or CR. Figure 3 shows the cumulative impact of BSR and CR on risk cluster.
BSR 19 9 9 9 9 9 9 9 9 9 9
BSR 18 9 9 9 9 9 9 9 9 9 9
BSR 17 9 9 9 9 9 9 9 9 9 9
BSR 16 7 7 7 7 7 9 9 9 9 9
BSR 15 7 7 7 7 7 7 9 9 9 9
BSR 14 7 7 7 7 7 7 7 9 9 9
BSR 13 7 7 7 7 7 7 7 9 9 9
BSR 12 5 5 5 5 5 7 7 9 9 9
BSR 11 5 5 5 5 5 5 7 9 9 9
BSR 10 3 3 3 3 5 5 7 9 9 9
BSR 09 3 3 3 3 5 5 7 9 9 9
BSR 08 2 2 2 3 3 5 7 9 9 9
BSR 07 2 2 2 2 3 5 7 7 9 9
BSR 06 1 1 2 2 3 5 7 7 9 9
BSR 05 1 1 1 2 3 5 7 7 9 9
BSR 04 1 1 1 2 3 5 7 7 9 9
BSR 03 0 0 0 2 3 5 7 7 9 9
BSR 02 0 0 0 2 3 5 7 7 9 9
BSR 01 0 0 0 2 3 5 7 7 9 9
CR 100-149 CR 150-199 CR 200-240 CR 241-299g CR 241-299r CR 300-349 CR 350-379 CR 380-399 CR 400-499 CR 500-600
B
S
R
c
la
ss
Figure 2: Average cumulative impact on risk cluster - old. vs. revised risk matrix
The visual analysis of both graphs shows evidence for a reduction of jumps. Analysing the curve progression in detail shows a variance reduction of 63.4% of CR impact and a variance reduction of 49.1% of BSR impact. Moreover, the maximum jump is reduced by 66.7% for CR and by 50% for BSR, confirming the significant reduction of jumps. Having reduced jumps considerably, the revised risk matrix reduces the underestimation and overestimation of risk and increases the comprehensiveness of the rating.
Moreover the rating accuracy is improved substantially. The validation of the model shows a considerably improved accuracy of the rating. While the CAP16-curve converges towards the CAP-curve of a perfect model, the Gini-coefficient increases from 53.5% to 56.4%.
5.2 Introduction of a malus system
Given the hidden risks which are currently not accounted for in the rating model17, a malus system is developed to incorporate these factors. Since this paper aims to develop a rating approach specifically designed for the automotive industry, the malus system aims to consider industry-specific characteristics and to incorporate them in the model. Based on the original rating result, the malus system adjusts the risk assessment of
16
Cumulative Accuracy Profile
17
See chapter 4.2
CR BSR
R
is
k c
lus
te
r
R
is
k c
lus
te
r
Average cumulative impact on risk cluster
a) dependent on CR
OLD REVISED
b) dependent on BSR
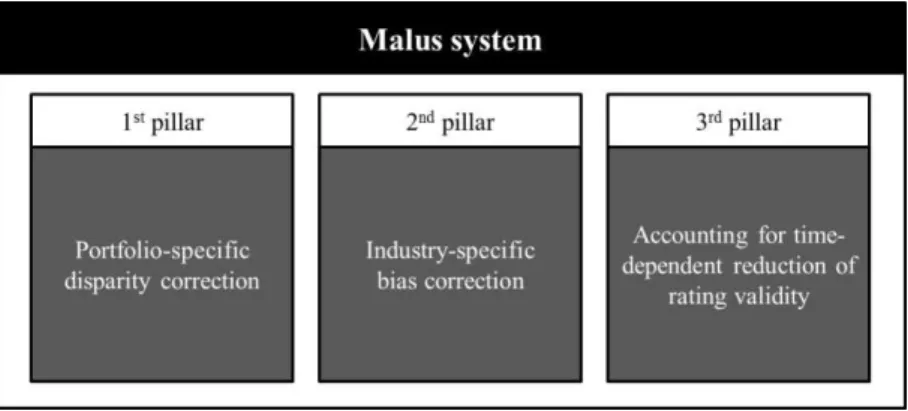
suppliers that match predefined criteria. In particular, the malus system adds a malus point to the BSR class, i.e. the BSR class is raised by one class. This maintains the original accuracy of the rating while taking into account hidden risks. The malus system consists of three pillars.
Figure 3: Schematic illustration of the malus system
Pillar one and two incorporate industry-specific evaluation of financial ratios while pillar three mitigates data quality related issues by incorporating the financial statement age in the model.
Pillar 1: Portfolio-specific disparity correction
In order to take into account portfolio-specific characteristics and rating relevance of certain accounting ratios, a verification mechanism based on a selection of accounting ratios is developed. By analysing the same set of ratios used in the BSR, the consistency within the rating methodology is maintained.
The first step consists of evaluating the suppliers relative to the OEM’s portfolio. In
identify suppliers whose BSR does not seem to fully capture portfolio-specific characteristics18, i.e. suppliers with a discrepancy between the probability of default and the relative accounting ratio analysis. If the PD of these suppliers appears to be too low, the BSR is downgraded, i.e. the BSR Class is increased by one class. Being based on the BSR, this approach maintains the given BSR as the major rating source but serves as a fine adjustment of the rating result.
Pillar 2: Industry-specific bias correction
The second pillar corrects potentially biased ratings by considering inter-correlation patterns of certain business models. In order to identify biased ratings, a rule-based heuristic expert system is introduced. The expert system sets identification rules based on the experience and knowledge of risk analysts. That enables the consideration of analysts’ knowledge and thus industry-specific characteristics early in the rating process. As a result, the probability that risky suppliers are neglected in the follow-up risk management process due to an upward-biased initial rating is reduced. In an internal survey among Daimler senior analysts, the accounting ratios “asset turnover”
and “fixed assets / total assets” are identified as a major source to assess a potential bias
of the rating19 in the automotive context. Particularly, extreme values of both ratios lead to a distortion of other rating relevant ratios due to considerable inter-correlations and thus to a biased PD. Extreme values are often a result of off-balance sheet activities or certain business models such as holding firms. In order to minimize the potential bias
18
The relation between the score and the PD is estimated with the linear function
with being the PD and being the rating score. Outliers are specified as observations with an actual value more than three standard deviations above the expected value.
19
resulting from both ratios, all identified biased ratings are downgraded by one BSR class20.
Pillar 3: Accounting for time-dependent reduction of rating validity
The third pillar of the malus system accounts for the age of the financial statement. Since the PD is estimated for a one-year time horizon, its validity is reduced with time. However, as long as there is no updated financial information available, it serves as a rating proxy for the following year. As this proxy is accompanied by an increased uncertainty about the validity of the rating result, a time-dependent risk premium should be included in the rating to meet the conservative requirements of the OEM. For this purpose, the malus system downgrades ratings which exceed a certain financial statement age threshold21 by two BSR classes.
The introduction of the malus system with its three pillars allows identifying hidden supplier risks that would not have been entirely captured by the original rating model. By penalizing these suppliers with malus points, additional risks are directly incorporated in the rating result which implies an increased focus on these suppliers. The choice of the specific malus criteria thresholds is a trade-off between conservatism of the approach and the amount of penalized suppliers. Furthermore, since the workload capacity of the OEM is considered, the malus criteria thresholds have to be chosen individually, dependent on the existing risk management framework of the OEM.
20
In the example of Daimler, a lower threshold of 20% and an upper threshold of 500% for asset turnover and a lower threshold of 1.5% for fixed/total assets are chosen as they indicates a strong bias while limiting the downgrades to a feasibly low number of suppliers.
21
6
Impact on existing risk management processes
The two implemented enhancements, the revised risk matrix and the malus system have a direct impact on the risk assessment of the supplier base. Most importantly, the enhancements impact the risk cluster methodology as the central rating element of the supplier risk management process. While the malus system “penalizes” some suppliers in terms of balance sheet rating class, the revised risk matrix adjusts the rating result downwards as well as upwards by raising or respectively lowering the risk cluster. In this way, the risk identification methodology is enhanced by the malus system whereas the risk assessment accuracy is improved significantly by the revision of the risk matrix. This implies a reduced likelihood of two rating errors. First, a risky supplier is less likely to be classified as non-risky. That ensures the on-time identification of the supplier risk in order to minimize potential costs by introducing preventive risk management measures. Second, a low-risk supplier is less likely to be classified as high-risk. That moves the focus of workload on the most risky suppliers, resulting in increased workload efficiency.
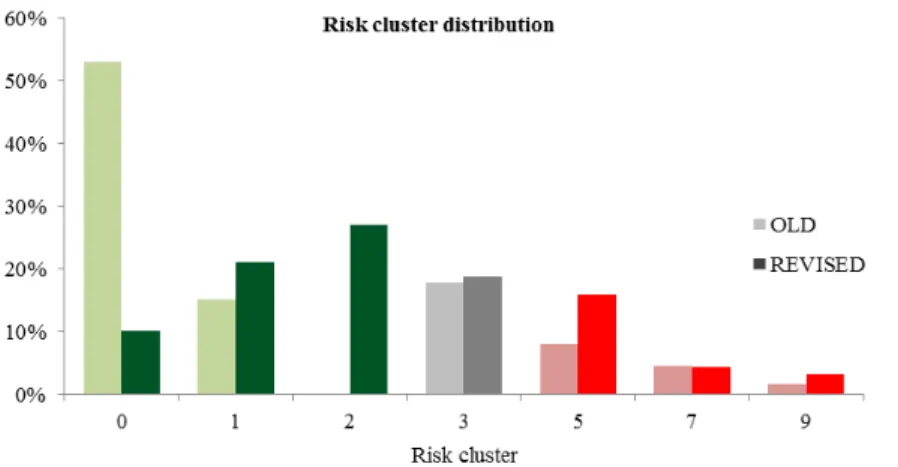
The following graph illustrates the impact of both methodical enhancements on the risk cluster distribution of Daimler’s supplier base.
The revision of the risk matrix has led to substantial changes in the risk cluster distribution. The majority of the suppliers are classified with a higher risk cluster. That is caused by two factors.
First, the former distribution showed significant deviations from the initial target distribution set by Daimler22. This was due to shifts in the risk structure of the portfolio towards less risky suppliers. By setting the thresholds for the revised matrix according to the targeted distribution, the actual distribution has shifted towards higher risk clusters. This assimilation to the target distribution implies a more optimal workload use. Secondly, the introduction of risk cluster 2 leads to a major migration from risk clusters 0 and 1 towards risk cluster 2.
The distributional weight shifts from a high concentration of risk cluster 0 towards higher risk clusters. Accordingly, the weighted average risk cluster increases from 1.54 to 2.64. Hence, the reduction of the share of risk cluster 0 suppliers results in an augmented explanatory significance of risk cluster 0. While the shift towards higher clusters results in an upward migration of a considerable amount of suppliers, a significant amount of suppliers has been shifted downwards, i.e. classified as less risky as before.
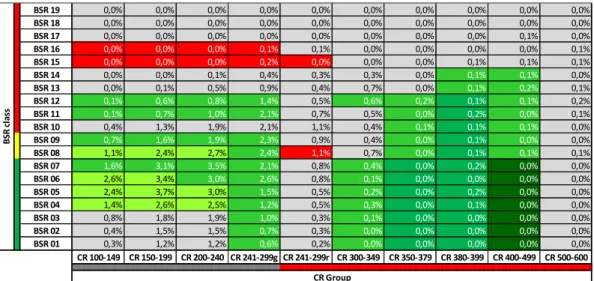
Table 6 illustrates the distribution of the Daimler supplier portfolio in the risk matrix framework. The colour indicates the change in risk cluster migration from the old risk matrix to the revised risk matrix including the malus system. Red coloured elements represent a downward change of the risk cluster while green elements represent an increase in risk cluster. In grey areas, the risk cluster remains unchanged. While some areas of the risk matrix are downgraded, other areas are upgraded. Besides affecting the
22
individual risk assessment of each element, relative risk between the elements change considerably. Hence, the risk focus is shifted to other areas of the risk matrix.
Table 6: Risk cluster distribution in risk matrix framework
As shown, both methodical enhancements have significantly positive impacts on the existing risk management processes. Besides assessing the default risk more accurately, they result in an efficiency increase of workload focus. Given the necessity to manage workload effectively in the supplier risk management framework, the impacts represent meaningful and valuable advancements.
7
Conclusion
Given the critical impact of a supply chain disruption on business performance, managing the supply chain risk is an important part within the enterprise risk management in industries with vulnerable and complex supply chains such as the automotive industry.
With the help of a hands-on example from an original equipment manufacturer from the automotive sector, an implemented rating model to assess supplier risk was described and analysed regarding methodical drawbacks. The combinational logic of two principal
BSR 19 0,0% 0,0% 0,0% 0,0% 0,0% 0,0% 0,0% 0,0% 0,0% 0,0%
BSR 18 0,0% 0,0% 0,0% 0,0% 0,0% 0,0% 0,0% 0,0% 0,0% 0,0%
BSR 17 0,0% 0,0% 0,0% 0,0% 0,0% 0,0% 0,0% 0,0% 0,1% 0,0%
BSR 16 0,0% 0,0% 0,0% 0,1% 0,1% 0,0% 0,0% 0,0% 0,0% 0,1%
BSR 15 0,0% 0,0% 0,0% 0,2% 0,0% 0,0% 0,0% 0,1% 0,1% 0,1%
BSR 14 0,0% 0,0% 0,1% 0,4% 0,3% 0,3% 0,0% 0,1% 0,1% 0,0%
BSR 13 0,0% 0,1% 0,5% 0,9% 0,4% 0,7% 0,0% 0,1% 0,2% 0,1%
BSR 12 0,1% 0,6% 0,8% 1,4% 0,5% 0,6% 0,2% 0,1% 0,1% 0,2%
BSR 11 0,1% 0,7% 1,0% 2,1% 0,7% 0,5% 0,0% 0,2% 0,0% 0,1%
BSR 10 0,4% 1,3% 1,9% 2,1% 1,1% 0,4% 0,1% 0,1% 0,1% 0,0%
BSR 09 0,7% 1,6% 1,9% 2,3% 0,9% 0,4% 0,0% 0,1% 0,0% 0,0%
BSR 08 1,1% 2,4% 2,7% 2,4% 1,1% 0,7% 0,0% 0,1% 0,1% 0,1%
BSR 07 1,6% 3,1% 3,5% 2,1% 0,8% 0,4% 0,0% 0,2% 0,0% 0,0%
BSR 06 2,6% 3,4% 3,0% 2,6% 0,8% 0,1% 0,0% 0,0% 0,0% 0,0%
BSR 05 2,4% 3,7% 3,0% 1,5% 0,5% 0,2% 0,0% 0,2% 0,0% 0,0%
BSR 04 1,4% 2,6% 2,5% 1,2% 0,5% 0,3% 0,0% 0,1% 0,0% 0,0%
BSR 03 0,8% 1,8% 1,9% 1,0% 0,3% 0,1% 0,0% 0,0% 0,0% 0,0%
BSR 02 0,4% 1,5% 1,5% 0,7% 0,3% 0,0% 0,0% 0,0% 0,0% 0,0%
BSR 01 0,3% 1,2% 1,2% 0,6% 0,2% 0,0% 0,0% 0,0% 0,0% 0,0%
CR 100-149 CR 150-199 CR 200-240 CR 241-299g CR 241-299r CR 300-349 CR 350-379 CR 380-399 CR 400-499 CR 500-600
B
S
R
c
la
ss
components of the rating model and the lack of the incorporation of all relevant risk factors are identified as the two major drawbacks.
By using historical default rates, a revised combinational logic was developed and implemented. The results are significantly improved risk assessment quality, enhanced workload management and rating comprehensiveness. Furthermore, risk cluster jumps are reduced considerably. By introducing a malus, industry-specific characteristics of the automotive industry are incorporated in the rating model with the implementation of a disparity analysis and a rule-based heuristic expert system. Additionally, the time-dependent reduction of the rating result validity was considered and mitigated by the malus system. With this approach, the malus system enables to include hidden risks early in the risk assessment process. As a result, risk identification and assessment quality are improved considerably.
Both methodical enhancements led to a substantial change in the risk cluster distribution of the OEM. In combination with the increased rating accuracy, that leads to sharply raised workload efficiency within the preventive financial supplier risk management. All in all, the methodical changes described in this paper led to significant
enhancements in the OEM’s rating model. The quality of the model improved
considerably in terms of risk identification, assessment accuracy and supplier monitoring. As the rating approach can be combined with different financial statement ratings, it is widely applicable in FSRM departments of corporations with complex supply chains. Moreover, the inclusion of hidden risks such as industry-specific factors makes the model exceptionally suitable to be used in the automotive sector.
8 References
Blackhurst, J., K. Scheibe, and D. Johnson. “Supplier risk assessment and monitoring for the automotive industry.” Journal of Physical Distribution and Logistics Management Vol. 38 No. 2, 2008: 143-165.
Chopra, S., and M. Sodhi. “Managing risk to avoid supply-chain breakdown.” MIT Sloan Management Review, Vol. 46 No. 1, 2004: 53-61.
Christopher, M., and H. Peck. “Building the Resilient Supply Chain.” The International Journal of Logistics Management Vol. 15 No. 2, 2004: 1-14.
Engardio, P. “Why the supply chain broke down.” Business Week, No. 3724, 19 March, 2001:
41.
Hallikas, J., I. Karvonen, U. Pulkkinen, V. Virolainen, and M. Tuominen. “Risk management processes in supplier networks.” International Journal of Production Economics 90, 2004: 47-58.
Jüttner, U. “Supply chain risk management - Understanding the business requirements from a
practitioner persepctive.” The International Journal of Logistics Management Vol. 16 No. 1, 2005: 120-141.
Levy, D. “International sourcing and supply chain stability.” Journal of International Business Studies, Vol. 26 No. 2, 1995: 343-360.
McGillivray, G. “Commercial risk under JIT.” Canadian Underwriter Vol. 67, No. 1, 2000: 26-30.
Nelson, D., R. Mayo, and P. Moody. Powered by Honda: Developing Excellence in the Global
Enterprise. New York, NY: Wiley, 1998.
Radjou, Navi. Adapting to Supply Network Change. Cambridge, MA: Forrester Research Tech
Report, 2002.
Riddalls, C., and S. Bennett. “Production-inventory system controller design and supply chain
dynamics.” International Journal of Systems Science, Vol. 33, No.3, 2002: 181-195.
Svensson, G. “A conceptual framework for the analysis of vulnerability in supply chains.”
International Journal of Physical Distribution & Logistics Management, Vol. 30 No. 9,
2000: 731-749.