Vol.52, n. 6: pp. 1409-1420, November-December 2009
ISSN 1516-8913 Printed in Brazil BRAZILIAN ARCHIVES OF
BIOLOGY AND TECHNOLOGY
A N I N T E R N A T I O N A L J O U R N A L
Effects of Plant Cover on the Macrofauna of
Spartina
Marshes in northern Brazil
Cesar França Braga
1*, Colin Robert Beasley
1and Victoria Judith Isaac
21Laboratório de Moluscos; Universidade Federal do Pará; Alameda Leandro Ribeiro s/n; 68600-000; Bragança -
PA - Brasil. 2Laboratório de Recursos Pesqueiros; Universidade Federal do Pará; Av. Perimetral s/n; 66075-100; Belém - PA - Brasil
ABSTRACT
Data on macrofauna density and diversity, and the height and density of Spartina brasiliensis, were obtained from salt marsh beds of a tropical estuary in northern Brazil. Sampling was carried out at four distinct times of the year, during the wet and dry seasons and in the transition periods between these. Sampling was also carried out in salt marshes of three size classes, small, medium and large. Variables were analyzed in relation to time of year and salt marsh size class. Overall, 46 taxa were found, with polychaetes, isopods and the gastropod Neritina virginea dominating the fauna. Macrofauna density and diversity were positively correlated with culm density, indicating a possible role in protection from predation. All the three variables were higher during the transitional periods between the wet and dry seasons and seasonal changes in rainfall, salinity and light availability may influence mortality, food availability and settlement of the macrofauna. There was no effect of salt marsh size on either the macrofauna or the vegetation.
Key words: Macrofauna, Spartina, density, diversity, seasonality, tropical estuary
*Author for correspondence: [email protected]
INTRODUCTION
Salt marsh beds are a common coastal feature of northern and southern temperate regions (West, 1977). In Brazil, salt marshes occur along the seaward edge of mangrove forest where Spartina
is a form of pioneer vegetation, colonizing intertidal sandy-muddy flats that are subject to low levels of hydrodynamic energy (West, 1977; Bonnet et al., 1994; Netto and Lana, 1997). Later, colonization of the salt marsh beds by mangrove vegetation occurs (West, 1977). The beds are usually dominated by a few or a single species of salt marsh vegetation and may be classified as such (Costa and Davy, 1992). The majority of salt
marsh beds present along the coast of northern Brazil (including the states of Amapá, Pará and Maranhão) are dominated by two species of
Spartina: S. brasiliensis Raddi, 1823 and S.
alterniflora Loiseleur, 1807 (Panitz, 1992).
1996, 1997). Many benthic invertebrates are decomposers of organic detritus and are important for the cycling of energy and material through food webs in salt marsh, mangrove and estuarine ecosystems (Bonnet et al., 1994; Lillebo et al., 1999; Wolff et al., 2000; Koch and Wolff, 2002). The description of benthic assemblages is an important first step towards quantifying the trophic interactions, the role of the benthos in energy cycling and the effect of human impacts on ecosystem functioning (Lana et al., 1996;
Acheampong, 2001). Benthic assemblages
associated with tropical salt marsh beds from the north of Brazil have been poorly studied (Alongi and Sasekumar, 1992; Lana et al., 1996). Pressure from urban development and unregulated resource use threaten mangrove and associated ecosystems in the north of Brazil (Glaser, 2003). Surveys of the invertebrate fauna of the region can provide a basis for sound management and conservation decisions (New, 1998), as well as act as indicators of change in environmental conditions (Weisberg et al., 1997). Recent studies in the Bragança region have described the macrofauna of muddy and sandy estuarine habitats (Acheampong, 2001) as well as mangrove (Figueira, 2002; Sampaio, 2004). The present study analyzed the abundance, diversity and species composition of macrofauna from Spartina salt marsh beds in relation to time of year and salt marsh size at Canela Island, Pará state, northern Brazil.
MATERIALS AND METHODS
Canela Island (0°47’20”S, 46°43’63”W) is a relatively recently formed (approximately 65 years ago) mangrove island situated north of the mouth of the Taperaçu river estuary, close to Bragança. The island is about 5 km2, and is subject to strong currents resulting in natural coastal erosion (Acheampong, 2001) along its northern sandy shore. Salt marsh beds composed of the species S. brasiliensis occur at the edge of the mangrove on the sheltered southern sandy-muddy shore. The general study area was described by Barletta et al. (1998), Wolff et al. (2000) and Cohen et al. (2003). The dry season occurs from August to December with a transitional period around January and the wet season from February to June with a transitional period around May. Salinity varies with season such that values of 6 may be
recorded in the wet season and values greater than 35 during the dry season (Dittmar and Lara, 2001). Sampling was carried out on four occasions: November 2003 (Dry), January (Dry to Wet), March (Wet) and May (Wet to Dry) of 2004. Salt marsh beds were individually numbered and measured and then classified according to their area (m2) into three size categories (Small: up to 100 m2, 36 beds; Medium: 100 to 317 m2, 33 beds, and Large: above 317 m2, 39 beds). The area of each bed was also measured at the end of the study in order to check for changes over time. Salt marsh beds with an area of 1 m2 or less were not considered for the study. In order to obtain independent observations over the time among salt marsh size categories, three different salt marsh beds were randomly selected from each size category on each sampling occasion.
For faunal sampling, three 1 m2 quadrats were randomly chosen along a transect within each salt marsh bed. Transects were designed to sample the homogeneous sections of undisturbed salt marsh vegetation and avoided borders without any vegetated substrate. Within each 1 m2 area, a sediment core was taken from a randomly selected point. A cylindrical corer (10 cm diameter by 110 cm height, area= 0.008 m2) was used to sample the substrate to a depth of 20 cm. A 300 µm mesh was used to sort the sediment in the field and material and fauna retained by the mesh were placed in 5% buffered formaldehyde stained with Rose Bengal, and later transferred to 70% alcohol. The samples were further sorted using a stereomicroscope and individuals were counted and identified to the lowest taxonomic level possible. Macrofauna density was expressed as the total number of individuals over all taxa per core. The number of taxa and the Berger-Parker dominance index were obtained for each core. Independent sampling was used for the vegetation analysis. Within three randomly selected quadrats (0.25 m2) from each bed, culm density was obtained by counting the number of Spartina shoots and vegetation height (cm) was measured at three random points within each quadrat and the average of the three observations was used in analyzes.
Data analysis
variance (ANOVA) with a random factor (salt marsh) nested within two fixed factors, time of year (Time) and salt marsh size class (Size). Cochran's C test was used to test for heterogeneity of variances (Underwood, 1997) and where significant, a Box-Cox transformation (xλ) was carried out (Venables and Ripley, 2002). Where a group difference was found by ANOVA, Tukey's Honestly Significant Difference test was calculated between the sample pairs according to Zar (1999) for nested mixed-effects models. Correlation analysis was carried out between all the variables using Spearman's correlation coefficient. Salt marsh area was analyzed over
time using one-way ANOVA. Non-metric
multidimensional scaling (nMDS) was used to explore the patterns in the macrofaunal assemblage in relation to time of year and salt marsh size. Analyzes were based on Bray-Curtis dissimilarity indices of double-root transformed abundances in order to scale down the scores of the most abundant species.
RESULTS
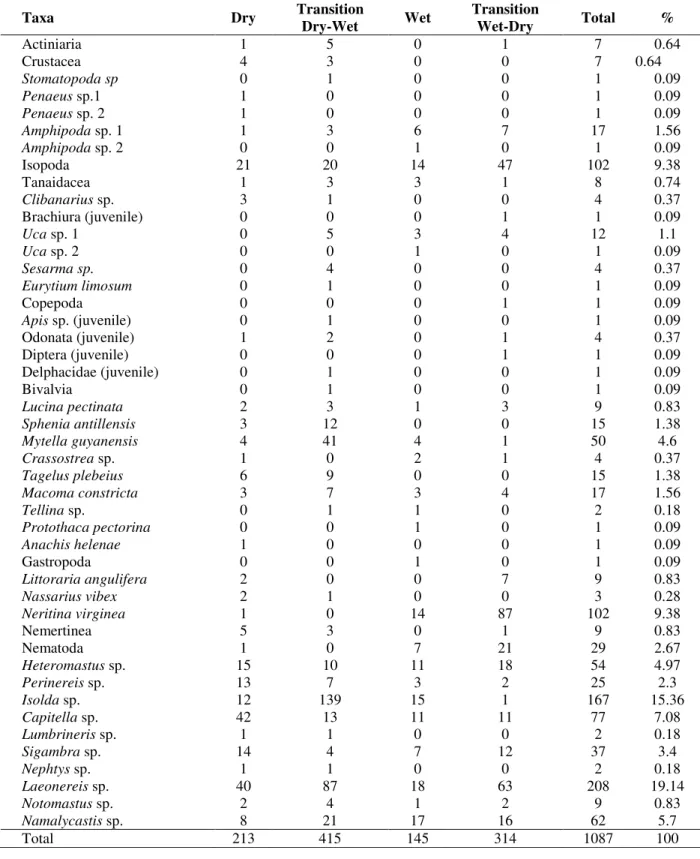
Salt marsh areas varied between 21.99 m2 and 3738 m2 with a mean of 490 m2. Individual observations of macrofauna density (individuals per core) ranged from 0 to 74 with a mean of 10.06. Density was higher or equal to 30 individuals in only 13 cores. In 6 cores, no individuals were found. Variation in the number of taxa per core was low, between 1 and 11, with a mean of 3.96 taxa per core. Overall, 46 taxa were found (Table 1) with the polychaetes Laeonereis
sp., Isolda sp., Namalycastis sp., Capitella sp.,
Heteromastus sp., together with Isopoda and the
gastropod Neritina virginea, accounting for the greatest densities (>0.5 individuals per core). The former group of taxa comprised 71% of the total
macrofaunal abundance. Nematodes, the
polychaetes Sigambra sp. and Perinereis sp., the bivalves Mytella guyanensis, Tagelus plebeius,
Macoma constricta and Sphenia antillensis, the
crab Uca sp. 1, and an unidentified species of amphipod accounted for densities of between 0.1 to 0.5 individuals per core. The remaining 30 taxa represented densities of less than 0.1 individuals per core. The Berger-Parker dominance index varied from 0 to 1 with a mean of 0.5135 per core. The height of the vegetation ranged between 12.67 cm to 69.3 cm with a mean of 36.27 cm. Culm density (shoots per 0.25 m2) varied from 14.0 to 253.0 with a mean of 53.0.
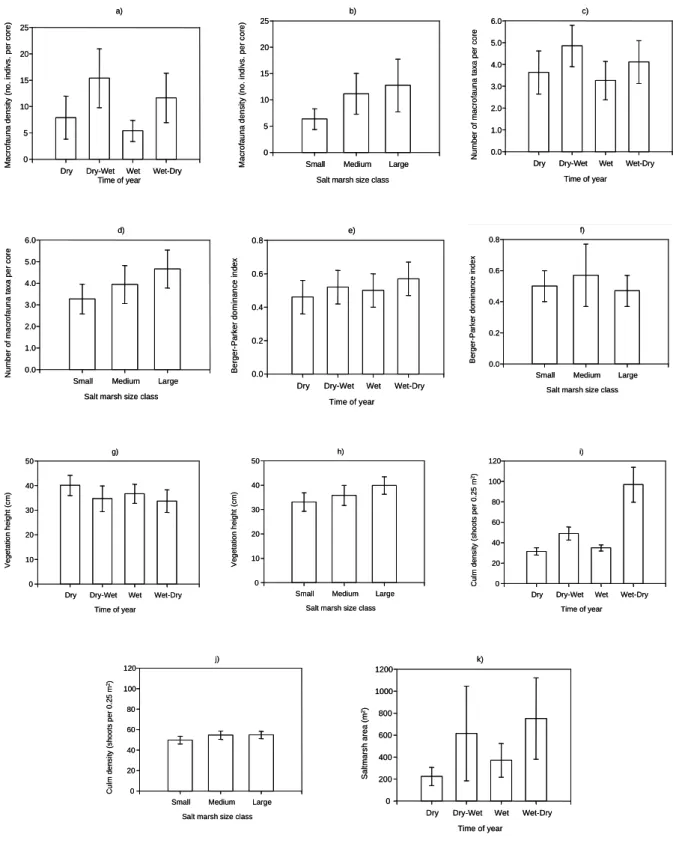
Mean values of macrofauna density, number of taxa, Berger-Parker dominance, height of vegetation, culm density, and salt marsh area are shown according to time of year and salt marsh size class in Figure 1 a-k.
Significant seasonal differences were only found for macrofauna density (Table 2a) and culm density (Table 2e) and differences were significant for all the pairs of sample means (Tukey, p<0.05). Mean macrofauna density was higher in both the transitional periods between the wet and dry seasons (Fig. 1a), whereas mean culm density was greater in the transition from the wet to the dry season by a factor of 2 to 3 times that at other times of the year (Fig. 1i). No differences in macrofauna or vegetation were found between salt marshes of different sizes and no significant interaction was found for any of the variables studied (Table 2). Significant differences among the individual salt marshes were detected for both vegetation height and culm density (Table 2d,e) within the combinations of time of year and salt marsh size class. Mean salt marsh area (m2) did not differ significantly over time (Table 2f, Fig. 1k). Macrofauna density was positively correlated with number of taxa (rs=0.864, p<0.001) and culm
density (rs=0.3802, p<0.001). Number of taxa was
negatively correlated with Berger-Parker dominance (rs=0.3474, p<0.001) and positively
correlated with culm density (rs=0.2630, p<0.01).
Salt marsh area was positively correlated with macrofauna density (rs=0.2052, p<0.05) and
Table 1 - Seasonal variation in abundance of taxa (number of individuals summed over 36 replicate cores per season) and percentage contribution to overall abundance.
Taxa Dry Transition
Dry-Wet Wet
Transition
Wet-Dry Total %
Actiniaria 1 5 0 1 7 0.64
Crustacea 4 3 0 0 7 0.64
Stomatopoda sp 0 1 0 0 1 0.09
Penaeus sp.1 1 0 0 0 1 0.09
Penaeus sp. 2 1 0 0 0 1 0.09
Amphipoda sp. 1 1 3 6 7 17 1.56
Amphipoda sp. 2 0 0 1 0 1 0.09
Isopoda 21 20 14 47 102 9.38
Tanaidacea 1 3 3 1 8 0.74
Clibanarius sp. 3 1 0 0 4 0.37
Brachiura(juvenile) 0 0 0 1 1 0.09
Uca sp. 1 0 5 3 4 12 1.1
Uca sp. 2 0 0 1 0 1 0.09
Sesarma sp. 0 4 0 0 4 0.37
Eurytium limosum 0 1 0 0 1 0.09
Copepoda 0 0 0 1 1 0.09
Apis sp. (juvenile) 0 1 0 0 1 0.09
Odonata(juvenile) 1 2 0 1 4 0.37
Diptera(juvenile) 0 0 0 1 1 0.09
Delphacidae (juvenile) 0 1 0 0 1 0.09
Bivalvia 0 1 0 0 1 0.09
Lucina pectinata 2 3 1 3 9 0.83
Sphenia antillensis 3 12 0 0 15 1.38
Mytella guyanensis 4 41 4 1 50 4.6
Crassostrea sp. 1 0 2 1 4 0.37
Tagelus plebeius 6 9 0 0 15 1.38
Macoma constricta 3 7 3 4 17 1.56
Tellina sp. 0 1 1 0 2 0.18
Protothaca pectorina 0 0 1 0 1 0.09
Anachis helenae 1 0 0 0 1 0.09
Gastropoda 0 0 1 0 1 0.09
Littoraria angulifera 2 0 0 7 9 0.83
Nassarius vibex 2 1 0 0 3 0.28
Neritina virginea 1 0 14 87 102 9.38
Nemertinea 5 3 0 1 9 0.83
Nematoda 1 0 7 21 29 2.67
Heteromastus sp. 15 10 11 18 54 4.97
Perinereis sp. 13 7 3 2 25 2.3
Isolda sp. 12 139 15 1 167 15.36
Capitella sp. 42 13 11 11 77 7.08
Lumbrineris sp. 1 1 0 0 2 0.18
Sigambra sp. 14 4 7 12 37 3.4
Nephtys sp. 1 1 0 0 2 0.18
Laeonereis sp. 40 87 18 63 208 19.14
Notomastus sp. 2 4 1 2 9 0.83
Namalycastis sp. 8 21 17 16 62 5.7
Time of year
Dry Dry-Wet Wet Wet-Dry
M a c ro fa u n a d e n s it y (n o . in d iv s . p e r c o re ) 0 5 10 15 20 25 a)
Time of year
Dry Dry-Wet Wet Wet-Dry
M a c ro fa u n a d e n s it y (n o . in d iv s . p e r c o re ) 0 5 10 15 20 25 a)
Salt marsh size class
Small Medium Large
M a c ro fa u n a d e n s it y (n o . in d iv s . p e r c o re ) 0 5 10 15 20 25 b)
Salt marsh size class
Small Medium Large
M a c ro fa u n a d e n s it y (n o . in d iv s . p e r c o re ) 0 5 10 15 20 25 b)
Time of year
Dry Dry-Wet Wet Wet-Dry
N u m b e r o f m a c ro fa u n a ta x a p e r c o re 0.0 1.0 2.0 3.0 4.0 5.0 6.0 c)
Time of year
Dry Dry-Wet Wet Wet-Dry
N u m b e r o f m a c ro fa u n a ta x a p e r c o re 0.0 1.0 2.0 3.0 4.0 5.0 6.0 c) d)
Salt marsh size class Small Medium Large
N u m b e r o f m a c ro fa u n a ta x a p e r c o re 0.0 1.0 2.0 3.0 4.0 5.0 6.0 d)
Salt marsh size class Small Medium Large
N u m b e r o f m a c ro fa u n a ta x a p e r c o re 0.0 1.0 2.0 3.0 4.0 5.0 6.0 e)
Time of year
Dry Dry-Wet Wet Wet-Dry
B e rg e r-P a rk e r d o m in a n c e in d e x 0.0 0.2 0.4 0.6 0.8 e)
Time of year
Dry Dry-Wet Wet Wet-Dry
B e rg e r-P a rk e r d o m in a n c e in d e x 0.0 0.2 0.4 0.6 0.8 f)
Salt marsh size class Small Medium Large
B e rg e r-P a rk e r d o m in a n c e in d e x 0.0 0.2 0.4 0.6 0.8 f)
Salt marsh size class Small Medium Large
B e rg e r-P a rk e r d o m in a n c e in d e x 0.0 0.2 0.4 0.6 0.8 g)
Time of year Dry Dry-Wet Wet Wet-Dry
V e g e ta ti o n h e ig h t (c m ) 0 10 20 30 40 50 g)
Time of year Dry Dry-Wet Wet Wet-Dry
V e g e ta ti o n h e ig h t (c m ) 0 10 20 30 40 50 h)
Salt marsh size class Small Medium Large
V e g e ta ti o n h e ig h t (c m ) 0 10 20 30 40 50 h)
Salt marsh size class Small Medium Large
V e g e ta ti o n h e ig h t (c m ) 0 10 20 30 40 50 i)
Time of year Dry Dry-Wet Wet Wet-Dry
C u lm d e n s it y (s h o o ts p e r 0 .2 5 m 2) 0 20 40 60 80 100 120 i)
Time of year Dry Dry-Wet Wet Wet-Dry
C u lm d e n s it y (s h o o ts p e r 0 .2 5 m 2) 0 20 40 60 80 100 120 j)
Salt marsh size class Small Medium Large
C u lm d e n s it y (s h o o ts p e r 0 .2 5 m 2) 0 20 40 60 80 100 120 j)
Salt marsh size class Small Medium Large
C u lm d e n s it y (s h o o ts p e r 0 .2 5 m 2) 0 20 40 60 80 100 120 k)
Time of year
Dry Dry-Wet Wet Wet-Dry
S a lt m a rs h a re a (m 2) 0 200 400 600 800 1000 1200 k)
Time of year
Dry Dry-Wet Wet Wet-Dry
S a lt m a rs h a re a (m 2) 0 200 400 600 800 1000 1200
Figure 1 - Mean values (± 95% confidence interval) of macrofauna and vegetation variables
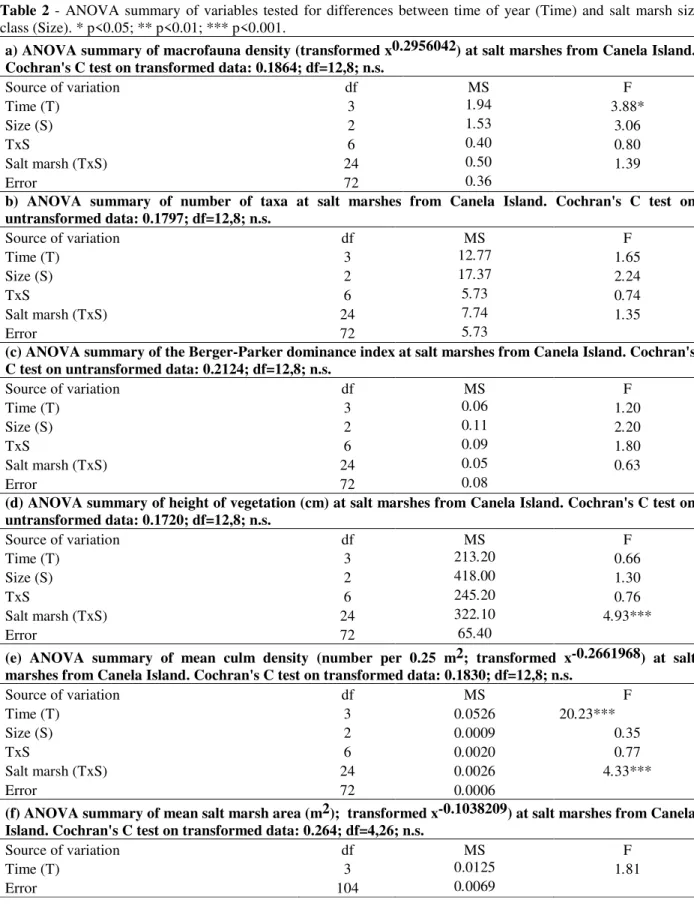
Table 2 - ANOVA summary of variables tested for differences between time of year (Time) and salt marsh size class (Size). * p<0.05; ** p<0.01; *** p<0.001.
a) ANOVA summary of macrofauna density (transformed x0.2956042) at salt marshes from Canela Island. Cochran's C test on transformed data: 0.1864; df=12,8; n.s.
Source of variation df MS F
Time (T) 3 1.94 3.88*
Size (S) 2 1.53 3.06
TxS 6 0.40 0.80
Salt marsh (TxS) 24 0.50 1.39
Error 72 0.36
b) ANOVA summary of number of taxa at salt marshes from Canela Island. Cochran's C test on untransformed data: 0.1797; df=12,8; n.s.
Source of variation df MS F
Time (T) 3 12.77 1.65
Size (S) 2 17.37 2.24
TxS 6 5.73 0.74
Salt marsh (TxS) 24 7.74 1.35
Error 72 5.73
(c) ANOVA summary of the Berger-Parker dominance index at salt marshes from Canela Island. Cochran's C test on untransformed data: 0.2124; df=12,8; n.s.
Source of variation df MS F
Time (T) 3 0.06 1.20
Size (S) 2 0.11 2.20
TxS 6 0.09 1.80
Salt marsh (TxS) 24 0.05 0.63
Error 72 0.08
(d) ANOVA summary of height of vegetation (cm) at salt marshes from Canela Island. Cochran's C test on untransformed data: 0.1720; df=12,8; n.s.
Source of variation df MS F
Time (T) 3 213.20 0.66
Size (S) 2 418.00 1.30
TxS 6 245.20 0.76
Salt marsh (TxS) 24 322.10 4.93***
Error 72 65.40
(e) ANOVA summary of mean culm density (number per 0.25 m2; transformed x-0.2661968) at salt marshes from Canela Island. Cochran's C test on transformed data: 0.1830; df=12,8; n.s.
Source of variation df MS F
Time (T) 3 0.0526 20.23***
Size (S) 2 0.0009 0.35
TxS 6 0.0020 0.77
Salt marsh (TxS) 24 0.0026 4.33***
Error 72 0.0006
(f) ANOVA summary of mean salt marsh area (m2); transformed x-0.1038209) at salt marshes from Canela Island. Cochran's C test on transformed data: 0.264; df=4,26; n.s.
Source of variation df MS F
Time (T) 3 0.0125 1.81
Assemblage composition and abundance
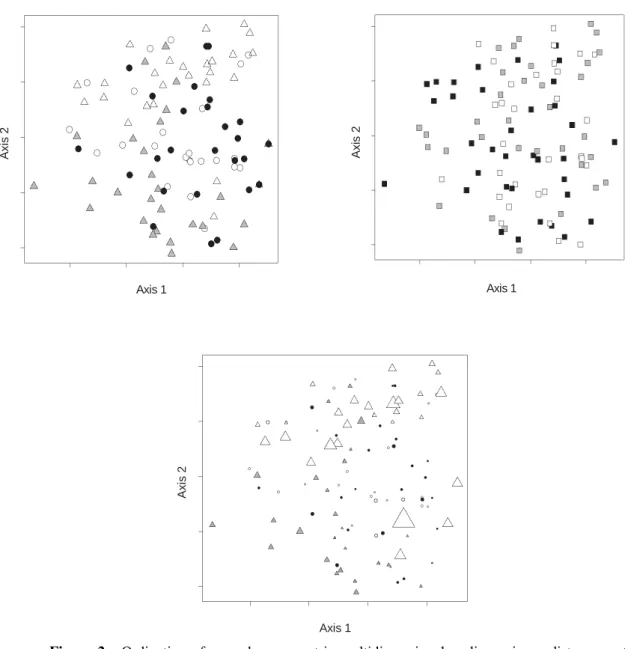
Differences in the composition of the fauna between the seasons were detected by ANOSIM (R= 0.0903, p<0.001) and cores from both the transitional periods (triangles in Fig. 2a) were well separated on Axis 2 of the ordination. The transition from the dry to the wet season was
characterized by higher densities of the polychaete
Isolda sp. and the infaunal bivalves Sphenia
antillensis and Mytella guyanensis. The transition from the wet to dry season featured higher densities of an isopod, the epifaunal snail Neritina
virginea, Isopoda and a nematode species.
Axis 1
A
x
is
2
Axis 1
A
x
is
2
Axis 1
A
x
is
2
Axis 1
A
x
is
2
Axis 1
A
xi
s
2
Axis 1
A
xi
s
2
Figure 2 - Ordination of cores by non-metric multidimensional scaling using a distance matrix
The polychaete Laeonereis sp. was most abundant in both the transition periods (Tables 1, 3). Cores collected in the wet and dry seasons (circles in Fig. 2a) tended to group together in the middle of the ordination, between cores from the transitional periods. There was greater variability in the macrofaunal assemblage during the wet season as indicated by the spread of cores (filled circles) in
the ordination (Fig. 2a). Dry season cores were characterized by higher densities of Capitella sp.
and Perinereis sp., whereas Namalycastis sp.
predominated in the transition to the wet season (Tables 1, 3). With regard to salt marsh size, no distinct groupings of cores were observed (Fig. 2b) and this was supported by ANOSIM (R= 0.0063, n.s.).
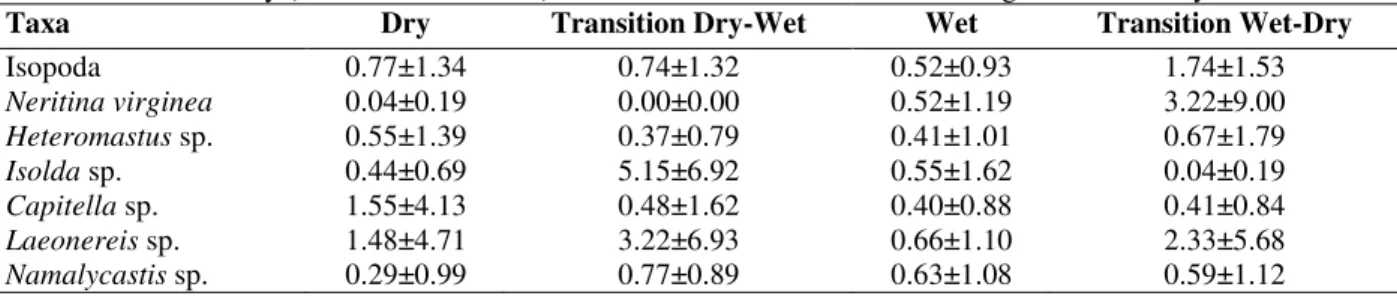
Table 3 - Mean density (± standard deviation) of the 7 most abundant taxa according to the time of year.
Taxa Dry Transition Dry-Wet Wet Transition Wet-Dry
Isopoda 0.77±1.34 0.74±1.32 0.52±0.93 1.74±1.53
Neritina virginea 0.04±0.19 0.00±0.00 0.52±1.19 3.22±9.00 Heteromastus sp. 0.55±1.39 0.37±0.79 0.41±1.01 0.67±1.79 Isolda sp. 0.44±0.69 5.15±6.92 0.55±1.62 0.04±0.19 Capitella sp. 1.55±4.13 0.48±1.62 0.40±0.88 0.41±0.84 Laeonereis sp. 1.48±4.71 3.22±6.93 0.66±1.10 2.33±5.68 Namalycastis sp. 0.29±0.99 0.77±0.89 0.63±1.08 0.59±1.12
Cores group, however, in relation to culm density (open triangles) that tends to increase from the right to the left of the ordination (Fig. 2 c). Cores from the wet and dry seasons had lowest values, whereas those from the transitional periods had higher values. Culm density was intermediate for cores from the transition from dry to wet seasons and highest for cores from the transition from wet to dry seasons (Fig. 1 i, 2 c).
DISCUSSION
Generally, polychaetes (Isolda, Nereis, Leonereis,
Capitella), gastropods (Neritina, Littoraria,
Heleobia) and isopod crustaceans (Sphaeromopsis,
Tholozodium) tend to dominate salt marsh
assemblages in Brazil (Flynn et al., 1996, 1998; Lana and Guiss, 1991, 1992; Netto and Lana, 1996, 1997). Similar dominant taxa occurred in the present study, with the exception of Nereis, which was not found, and Heleobia, which has a southern Brazilian distribution (Rios, 1994). Infaunal organisms such as polychaetes may use roots and rhizomes as refuges and the underground plant structure may provide greater availability of food such as detritus and various types of infaunal prey associated with the vegetation (Tararan, 1994; Attolini et al., 1997; Flynn et al. 1998; Pagliosa and Lana, 2000; Lana and Guiss, 1991). Epifaunal organisms such as Neritina feed on the epidermis of grasses and detritus (Lana and Guiss, 1991), presumably consuming the associated film of
algae and microorganisms. Isopods are also epifaunal animals and although their feeding biology is not well known, they are frequently associated with rhizomes (Lana e Guiss, 1992; Tararan, 1994). As Spartina beds from different parts of their range are very similar structurally, it is not surprising that similar faunas occur in both the north and south of Brazil.
The number of macroinvertebrate species found in surveys of Brazilian salt marshes varied between 31 and 98 (see above references). The real number of species in the present study, however, might be greater as taxonomic difficulties precluded the identification of all individuals to species level. Densities of macroinvertebrates in salt marshes at Canela Island (number of individuals/m2 in vegetated areas only) also varied widely, with values between 125-9250 m2. This range was similar to that found for North and South American salt marshes (Kneib, 1984; Rader, 1984; Flynn et al., 1996, 1998; Netto and Lana, 1996, 1997; Lana and Guiss, 1991, 1992). In comparison to other studies from the Bragança region, present estimates were higher than those from a mangrove tidal creek bank (0.59-6.6 individuals m2) and intertidal flats (1.2-14.9 individuals m2) (Acheampong, 2001). At the Furo Grande mangrove forest, Figueira (2002) found macrofauna densities between 642-969 individuals m2. The average culm density (number per m2) for
al., 1998; Netto and Lana, 1996, 1997). Salt marsh height (cm) at Canela Island showed no significant difference between the time of the year or salt marsh size class and varied from 12.67 to 69.3, a smaller range when compared to other studies in Brazil (Bonnet et al., 1994; Netto and Lana, 1996, 1997; Lana et al., 1991). Such differences in salt marsh vegetation could be due to the effects of tidal range (Schaeffer-Novelli, 2002), which was small (< 1 m) in the south and south-east of Brazil (Costa and Davy, 1992), whereas at Canela Island macro-tides with amplitudes of 3.5 to 5 m occur (Acheampong, 2001). Differences in salinity, degree of inundation, nutrient availability and temperature may also be responsible for variation in productivity and growth (Schaefer-Novelli, 2002) of salt marshes in northern and southern Brazil.
At Canela Island, macrofauna density and number of taxa were greater when culm density was high. Differences in form and spatial dispersion of
Spartina culms might lead to changes in the
structure of the associated macrofauna due to the reduction in foraging efficiency of large predators (Flynn et al., 1996). This was particularly noticeable for the epifaunal snail Neritina
virginea, higher densities of whichwere recorded
from denser stands of Spartina, suggesting the use of vegetation as a refuge from predators (Bonnet, et al. 1994) and a substrate on which epiphytes, the snail's main food source, grow (Lana and Guiss, 1991; Bonnet, et al. 1994). Differences in faunal composition occurred according to the height and density of salt marshes in São Paulo, where polychaetes predominated in tall dense stands (Flynn et al., 1998), mollusks in both tall sparse, and, short dense stands, and finally epifaunal isopods in short, sparse stands (Flynn et al., 1996). There may be competition for structural refuges such as Spartina culms that provided protection from predators and/or adverse environmental conditions (Rader, 1984). The risk of predation by blue crabs on the snail Littoraria irrorata in a North Carolina salt marsh decreased with distance from the sea, especially where Spartina was tall or dense (Lewis and Eby, 2002). On the other hand, Lana and Guiss (1992) found a negative relationship between epifaunal abundance and aerial plant biomass, possibly due to lower light availability that limited the growth of algal films, in turn limiting densities of grazing species. At Canela Island, macrofauna density and number of taxa were greater during the transitions between
wet and dry seasons. Such variation could be related to temporal changes in salt marsh vegetation such as greater availability of detritus and energy in underground biomass due to the effects of seasonal freshwater runoff (Lana et al., 1991; Netto and Lana, 1997; Flynn et al., 1998, Pagliosa and Lana, 2000). Furthermore, seasonal variation in rainfall causes wide variation in salinity at Canela Island. Heavy rains, especially at low tide may affect the distribution and abundance of benthic invertebrates by causing dislodgement or mortality (Lana and Guiss, 1991; Pagliosa and Lana, 2000; Gomes, 2006). Higher densities of
Neritina virginea and Isopoda during the transition
from the wet to the dry season may be the result of decreasing rainfall and may reflect greater food availability (epiphytes) as decreasing cloud cover increases light availability. Higher culm density and thus greater surface area for epiphyte growth, as well as protection from predators, may have benefited these epifaunal animals at Canela Island at this time of the year. Seasonal variation in salinity may influence larval settlement as certain species such as the nestling bivalve Sphenia
antillensis only settles at the end of the dry season
when salinity is highest (pers. obs.). The wet and dry seasons at Canela Island represent extremes in terms of rainfall and salinity and species that do not tolerate such extremes are absent or present at low densities. However, during the transitional periods, higher macrofauna density and diversity may occur due to the joint presence of marine and brackish water species both of which groups tolerate intermediate conditions.
root systems penetrating the sediment may help create an environment with higher oxygen content (Lana and Guiss, 1992). This probably allows the establishment of mangrove species. In fact, we observed colonization of salt marsh by mangrove seedlings and the presence of bare sediment around these seedlings, presumably the effects of shading or alleopathy. Similar pioneer relationships was recorded in French Guyana by Lescure (1980).
Finally, variation in productivity and sucessional characteristics of northern Brazilian species of
Spartina should be investigated in more detail in order to evaluate their role in local coastal ecosystems, including their interaction with the fauna (Silliman and Bortolus, 2003; Rosa and Bemvenuti, 2005).
ACKNOWLEDGMENTS
This study was financed by The Millennium Program, Brazil and was part of the Brazilian-German Cooperative Project MADAM (Mangrove Dynamics and Management). A scholarship to CFB was financed by the Brazilian National Research Council (CNPq). A special thanks to V. F. Monteiro; P. A. Carmona; N. R. Leite; D. A. Gloria; S. C. C. Pinheiro and S. C. A. Sodré for their help in the field and laboratory.
RESUMO
Dados sobre a densidade e diversidade da macrofauna em relação à altura e densidade de
Spartina brasiliensis foram obtidos em bancos de
marismas em um estuário tropical no norte do Brasil. A amostragem foi realizada quatro vezes durante um ano, nas estações chuvosa, seca e nos períodos de transição entre estas. A amostragem foi realizada em marismas de três classes de tamanho: pequeno, médio e grande. As variáveis foram analisadas em relação às estações do ano e das classes de tamanho das marismas. Um total de 46 táxons foram encontrados, com os poliquetos, isopodos e o gastropódo Neritina virginea
dominando a fauna, resultados similares a estudos realizados em marismas no sul do Brasil. A densidade e a diversidade da macrofauna foram correlacionadas positivamente com a densidade de colmos da vegetação, indicando um possível papel
da vegetação em proteção contra predação. Todas as três variáveis foram maiores durante os períodos transicionais entre as estações chuvosa e seca e mudanças sazonais em precipitação, salinidade e disponibilidade de luz possam influenciar mortalidade, disponibilidade de alimento e assentamento da macrofauna. Não houve um efeito de tamanho da marisma sobre a macrofauna ou a vegetação. O efeito beneficial da vegetação sobre a macrofauna é apoiado por outros estudos de marismas brasileiras.
REFERENCES
Acheampong, E. (2001), Distribution of macrozoobenthos abundance and biomass in intertidal soft sediments of North-East Brazil. Master's Degree Dissertation, University of Bremen, Germany, 69 p.
Alongi, D. M. and Sasekumar, A. (1992), Benthic Communities. In: Tropical Mangrove Ecosystems. Coastal and Estuarine Studies, ed. A. I. Robertson and D. M. Alongi. American Geophysical Union, Washington, D.C., pp.137-171.
Attolini, F. S.; Flynn, M. N. and Tararam, A. S. (1997), Influence of Spartina alterniflora and tide level on the structure of polychaete associations in an euryhaline salt marsh in Cananéia lagoon estuarine region (SE Brazil). Revista Brasileira de Oceanografia,45, 25-34.
Barletta, M; Barletta-Bergan, A. and Saint-Paul, U. (1998), Description of the fisheries structure in the mangrove-dominated region of Bragança (State of Pará, North Brazil). Ecotropica, 4, 41-53.
Bonnet, B. R. P.; Lana, P. C. and Guiss, C. (1994), Influência da gramínea Spartina alterniflora sobre a distribuição e densidade de Neritina virginea (Gastropoda; Neritidae) em marismas da Baía de Paranaguá (Paraná, Brasil). Neritica, 8, 99-108. Cohen, M. C. L. and Lara, R. J. (2003), Temporal
changes of mangrove vegetation boundaries in Amazonia: application of GIS and remote sensing techniques. Wetlands Ecology and Management, 11,
223-231.
Costa, C. S. B. and Davy, A. J. (1992), Coastal salt marsh communities of Latin America. In: Coastal Plant Communities of Latin America, ed. U. Seeliger. Academic Press, Inc., San Diego, pp. 179-199. Daiber, F. C. (1977), Salt-marsh animals: distributions
related to tidal flooding, salinity and vegetation. In: Ecosystems of the world. I Wet coastal ecosystems, ed. V. J. Chapman. Elsevier Scientific Publishing Company, Amsterdam, pp. 79-108.
mangrove tidal creek in North Brazil. Estuarine Coastal and Shelf Science, 52, 249-259.
Figueira, E. A. G. (2002), Caracterização da comunidade macrobentônica dos manguezais do Furo Grande. Bragança, Pará. Master's Degree Dissertation, Universidade Federal do Pará, Campus de Bragança, Brazil, 109 p.
Flynn, M. N.; Tararam, A. S. and Wakabara, Y. (1996), Effects of habitat complexity on the structure of macrobenthic association in a Spartina alterniflora marsh. Revista Brasileira de Oceanografia,44, 9-21. Flynn, M. N.; Wakabara, Y. and Tararam, A. S. (1998),
Macrobenthic associations of the lower and upper marshes of a tidal flat colonized by Spartina alterniflora in Cananéia lagoon estuarine region (southeastern Brazil). Bulletin of Marine Science, 63,
427-442.
Glaser, M. (2003), Interrelations between mangrove ecosystem, local economy and social sustainability in Caeté estuary, North Brazil. Wetlands Ecology and Management, 11, 256-272.
Gomes, C. P. (2006), Ciclo sazonal de gametogênese em Mytella guyanensis (Mollusca, Bivalvia). Master's Degree Dissertation. Universidade Federal do Pará, Campus de Bragança, 77 p.
Ihaka, R. and Gentleman, R. (1996), R: A language for data analysis and graphics. Journal of Computational and Graphical Statistics, 5, 299-314.
Kneib, R. T. (1984), Patterns of invertebrate distribution and abundance in the intertidal salt marsh: causes and questions. Estuaries, 7, 392-412. Koch, V. and Wolff, M. (2002), Energy budget and
ecological role of mangrove epibenthos in the Caeté estuary, North Brazil. Marine Ecology Progress Series,228, 119-130.
Lana, P. C. and Guiss, C. (1991), Influence of Spartina alterniflora on structure and temporal variability of macrobenthic associations in a tidal flat of Paranaguá Bay (southeastern Brazil). Marine Ecology Progress Series, 73, 231-244.
Lana, P. C. and Guiss, C. (1992), Macrofauna - plant-biomass interactions in a euhaline salt marsh in Paranaguá Bay (SE Brazil). Marine Ecology Progress Series, 80, 57-64.
Lana, P. C.; Camargo, M. G.; Brogim, R. A. and Issac, V. J. (1996), O bentos da costa brasileira. Avaliação crítica e levantamento bibliográfico (1858-1996). Ministério do Meio Ambiente, dos Recursos Hídricos e da Amazônia Legal/Comissão Interministerial para os Recursos do Mar/Fundação de Estudos do Mar, Rio de Janeiro, 431 p.
Lescure, J. P. (1980). Ecological aspects of the mangrove forest in French Guiana. In Memorias del seminario sobre el estudio cientifico e impacto humano en el ecosistema de manglares. UNESCO, Oficina Regional de Ciencia y Tecnologia para America Latina e el Caribe, Montevideo, Uruguai, pp. 76–93.
Lewis, D. B. and Eby, L. A. (2002), Spatially heterogeneous refugee and predation risk in intertidal salt marshes Oikos, 96, 119-129.
Lillebo, A. I.; Flindt, M. R.; Pardal, M. A. and Marques, J. C. (1999), The effect of macrofauna, meiofauna and microfauna on the degradation of Spartina maritima detritus from a salt marsh area. Acta Oecologica,20, 249-258.
Netto, S. A. and Lana, P. C. (1996), benthic macrofauna of Spartina alterniflora marshes and nearby unvegetated tidal flats of Paranaguá Bay (SE Brazil). Neritica, 8, 41-55.
Netto, S. A. and Lana, P. C. (1997), Intertidal zonation of benthic macrofauna in a subtropical salt marsh and nearby unvegetated flat (SE Brazil). Hydrobiologia,
353, 171-180.
New, R. T. (1998), Invertebrate surveys for conservation. Oxford University Press, Oxford, p.256.
Pagliosa, P. R. and Lana, P. C. (2000), Population dynamics and secondary production of Nereis oligohalina (Nereididae: Polychaeta) from a subtropical marsh in southeast Brazil. Bulletin of Marine Science,67, 259-268.
Panitz, C. M. N. (1992), Ecological aspects of salt marsh ecosystems in Santa Catarina Island, Brazil. In: Coastal plant Communities of Latin America. U. Seeliger (ed.), Academic Press. New York, pp.213-230
Rader, D. N. (1984), Salt-marsh benthic invertebrates: small-scale patterns of distribution and abundance. Estuaries, 7, 413-420.
Rios, E. (1994), Seashells of Brazil. Editora da FURG, Rio Grande, 481 p.
Rosa, L. C. and Bemvenuti, C. E. (2005), Effects of the burrowing crab Chasmagnathus granulate (Dana) on meiofauna of estuarine intertidal habitats of Patos Lagoon, Southern Brazil. Brazilian Archives of Biology and Technology, 48 (2), 267-274.
Sampaio, D. S. (2004), Comparação da macrofauna bentônica em bosques de mangue sob diferentes graus de degradação no município de Bragança - Pará - Brasil. Master's Degree Dissertation. Universidade Federal do Pará, Campus de Bragança, Brazil, 84 p. Schaeffer-Novelli, Y. (2002), Manguezal, marisma e
apicum (Diagnóstico Preliminar). In: Fundação BIO-RIO; MMA - Ministério do Meio Ambiente. Avaliações e ações prioritárias para conservação da biodiversidade das Zonas Costeira e Marinha. Brasília: MMA/SBF. CD-ROM.
Silliman, B. R. and Bortholus, A. (2003), Underestimation of Spartina productivity in western Atlantic marshes: marsh invertebrates eat more than just detritus. Oikos , 101, 549-554.
Instituto Oceanográfico da Universidade de São Paulo, 169 p.
Underwood, A. J. (1997), Experiments in ecology. Their logical design and interpretation using analysis of variance. Cambridge University Press, Cambridge, 535 p.
Venables, W. N. and Ripley, B. D. (2002), Modern Applied Statistics with S. Springer-Verlag, New York, 512 p.
West, R. C. (1977), Tidal salt marsh and mangal formations of Middle and South America. In: Ecosystems of the world. I Wet coastal ecosystems, ed. V. J. Chapman. Elsevier Scientific Publishing Company, Amsterdam, pp. 193-213.
Weisberg, S. B.; Ranasinghe, J. A.; Schaffner, L. C. and Frithsen, J. B. (1997), An estuarine benthic index of biotic integrity (B-IBI) for Chesapeake Bay. Estuaries,20, 149-158.
Wolff, M.; Koch, V. and Issac, V. J. (2000), A trophic flow model of the Caeté mangrove estuary (North Brazil) with considerations for the sustainable management of its resources. Estuarine Costal and Shelf Science,50, 789-803.
Zar, J. H. (1999), Biostatistical analysis. Prentice Hall, Upper Saddle River, New Jersey, 929 p.