INTRODUCTION
China clay and Ball clay are main clay raw materials used in the ceramic industry all over the world. Due to high consumption, these raw materials have become a scarce resource in Sri Lanka and in many other countries [1]. In order to reduce the usage of ball clay and china clay, industries are looking for means to incorporate readily available red clay into the ceramic body composition (specially in wall tiles and loor tiles) [2, 3]. In addition, due to the presence of higher luxing oxides (specially, K2O, Na2O and Fe2O3 with clay minerals illite and montmorillonite), red clay is capable of vitrifying at low temperature compared to china clay and ball clay [4-10]. Therefore, the usage of red clay will also be a good option for the energy crisis in the ceramic industry. Furthermore, the continuous development of red clay industry creates economical and environmental beneits
since red clay can be mixed with waste materials of some industries such as granite, marble and steel industry to produce many ceramic products [7, 8, 11, 12].
Despite the vast use of red clay for roof tiles, pottery ware, ornamental ware, bricks and terracotta tile in Sri Lanka, poor understanding of the chemical composition, texture and mineralogy on properties of red clay has reduced the quality of the inal products. Therefore, a proper study and understanding of red clay is essential to improve the quality and reduce the defects of the products thereby decreasing raw material wastage and increasing the proit margins of the industry. It is desirable to study effects of the chemical, mineralogical and textural properties of red clay on the properties of red clay product as these properties of red clay vary with the location of the deposit [2]. Furthermore, the variation of the sand content of red clay within the same deposit and also among the deposits is very common in red
Identiication of an appropriate body composition for red clay products
(Identiicação de uma composição adequada para produtos
de argila vermelha)
P. Hettiarachchi1, J. T. S. Motha1, H. M. T. G. A. Pitawala2
1Industrial Technology Institute, P.O. Box 787, 363, Bauddhaloka Mawatha, Colombo 7, Sri Lanka
2Department of Geology, University of Peradeniya, Sri Lanka
Abstract
This study focuses on the identiication of an appropriate composition of raw materials for ceramic products from commonly available red clays in Sri Lanka.The raw materials were characterized in terms of particle size distribution, chemical and mineralogical composition. Different formulations of samples were prepared, and the linear shrinkage, water absorption and lexural strength of the inal products were measured. Microstructures of ired samples were observed under a scanning electron microscope. The best quality product was obtained when the sample contains a high amount of illite clay in a mixture of 80 wt.% clay-silt and 20 wt.% sand. The presence of higher concentrations of the metal oxides Na2O, K2O and Fe2O3 (total ~21 wt.%) in the clay-silt fraction of
samples has resulted in obtaining higher technological properties of the body. The lexural strength and the water absorption of the product are 26.82 MPa and 6.51% respectively. If the raw materials contain lower amounts of the oxides Na2O, K2O and Fe2O3,
higher amounts of clay-silt fraction (up to 90 wt.%) must be added to obtain an optimum quality product.
Keywords: red clay, illite, vitriication, ceramic products.
Resumo
Este estudo é centrado na identiicação de uma composição adequada de matérias-primas para produtos cerâmicos a partir de argilas vermelhas disponíveis em Sri Lanka.As matérias-primas foram caracterizadas por meio de determinação de distribuição de tamanho de partículas, composição química e mineralógica. Foram preparadas diferentes formulações e medidas a retração linear, a absorção de água e a resistência à lexão. As microestruturas das amostras queimadas foram observadas em microscópio eletrônico de varredura. O produto de melhor qualidade foi obtido com amostras com maior quantidade de ilita em uma mistura de 80 peso% de silte e 20 peso% de areia. A presença de maiores concentrações dos óxidos metálicos Na2O, K2O e Fe2O3 (total ~21
peso%) na fração silte das amostras resultou em melhores propriedades tecnológicas. A resistência à lexão e a absorção de água do produto são 26,82 MPa and 6,51%, respectivamente. Nas matérias-primas com menores concentrações dos óxidos Na2O, K2O e
Fe2O3, maiores quantidades de fração silte (até 90 peso%) devem ser adicionadas para obter um produto de qualidade otimizada.
clay deposits of Sri Lanka [2]. Therefore, the identiication of the technological and physical property variation of red clay based products with the sand content and inding a suitable body composition with optimum sand content is also equally important for the industry.
The main objective of the present investigation is to identify the effect of mineralogical and chemical composition of red clay and their textures on the quality of the inal product. The efforts were also made to identify an appropriate body composition required to obtain a high quality product.
MATERIAL AND METHODS
Raw materials characterization
Clay samples were collected from different deposits situated in different climate zones of Sri Lanka (see Fig. 1). A pure quartz powder (53-253 µm) of which the chemical composition was known, was used to change the sand fraction of samples. The chemical composition of raw materials was measured by atomic absorption spectrophotometer (AAS) at Industrial Technology Institute (ITI), Colombo, Sri Lanka. Primary and secondary mineral phases of samples were identiied using X-ray diffraction (XRD) analysis (Siemens, Germany). Particle size distribution of clay-silt fraction was assessed using a laser particle size analyzer (Analysette 22 Compact). Clay-silt and the sand fraction were separated using a 53 µm sieve.
Sample preparation
Different batch compositions were prepared by mixing different proportions of clay-silt and sand (see Table I).
The body compositions with more than 90% of clay-silt fraction or less than 50% were not selected for the study in order to obtain a high quality product. Batches (500 g) were prepared by ball milling the constituents with water (1:1) for 30 min. The resultant slurry was oven dried overnight at 110 ºC and powdered gently to pass through a 250 µm sieve. The resulting powder with 6% moisture (by weight) was kept in a dessicator for 24 h. Rectangular, 70 mm × 2.5 mm ×3 mm, specimens obtained by uniaxial pressing at 20 MPa were dried at 110 ºC for 24 h and ired at 1000 ºC in a laboratory furnace. The heating rate was 10 °C/ min with 0.5 h soaking at the maximum temperature and cooling was done by natural convection inside the furnace after it was turned off. These specimens were tested for linear shrinkage, lexural strength and water absorption. Linear shrinkage was measured using the Mitutoyo vernier caliper. Water absorption was determined by taking the weight difference between sintered and the water saturated samples (immersed for 2 h in boiling water). Flexural rupture strength was determined by three point bending test machine (model LT 10 KS, Tinius Olsen) using a cross head speed of 0.5 mm/min. The microstructure of the fracture surface of selected ired samples was studied under a scanning electron microscope (LEO 1420).
RESULTS AND DISCUSSION
Characterization of raw materials
It was observed that the wet zone clays (RC1 and RC3) are rich in kaolinite group clays (Table II) and have a higher amount of Al2O3 (up to 33.11 wt.% , see Table III). Further, these clays are low in alkaline oxides (Na2O and K2O, < 1.39 wt.%, see Table III). In contrast, the clays from the dry zone are rich in illite and have a low amount of Al2O3 (< 22.01 wt.%) and a higher amount of alkaline oxides (up to 5.62 wt.%). The studies indicated that the chemical compositions of the samples are in close agreement with their mineralogical compositions. This is due to the fact that the kaolinite group clay with 1:1 type layer structure does not allow holding cations within the structural layers and results in a higher amount of Al2O3.On the other hand, illite with 2:1 type layer structure having interlayer cations results in a lower amount of Al2O3 and considerable amount of K2O Figure 1: The major climate zones of Sri Lanka and the locations
of collected samples [1].
[Figura 1: Principais zonas climáticas em Sri Lanka e localização de coleta das amostras [1 ].]
Formula Clay-silt (wt.%) (wt.%)Sand
a 50 50
b 60 40
c 70 30
d 80 20
e 90 10
Table I - The mixing proportion of sand and clay-silt of the tested formulas.
and Fe2O3 according to the theoretical composition [5, 6, 9]. The chemical analysis showed considerable amounts of Fe2O3 with each clay sample while the highest amount was measured from RC2 (10.22 wt.%) and lowest from RC3 (4.51 wt.%). Moreover, the amount of Fe2O3 is higher in the dry zone samples compared to that of the wet zone samples (see Table III).
Particle size distribution of clay-silt fraction of each clay sample is shown in Table IV. RC1 contains the lowest clay fraction (< 2 µm) and the silt fraction of RC1 is rich in coarse particles (particles within 10 and 53 µm). The highest clay fraction is measured in RC5 (33.04%) and it has the lower amount of coarse particles. A comparatively high amount of clay fraction and ine fraction (< 10 µm) was measured in
RC2. The clay and silt fractions of RC3 and RC4 are almost similar.
Technological characterization
Fig. 2 shows the variation of lexural strength of green bodies with increasing clay-silt fraction. It was observed that the dry strength of all samples increases with increase in the fraction of clay-silt. The results show that higher iner Raw
materials Major secondary minerals Minor secondary minerals (minor quantities) Primary minerals Sand content of clay (wt.%)
RC1 nacrite gibbsite quartz 14.20
RC2 illite -- quartz 25.06
RC3 kaolinite illite quartz 26.70
RC4 illite kaolinite quartz 34.15
RC5 illite nacrite quartz 35.12
Table II - Mineralogical composition and sand content of studied clays. [Tabela II - Composição mineralógica e teor de areia nas argilas estudadas.]
Constituents (wt.%) RC1 RC2 RC3 RC4 RC5 Quartz
SiO2 41.1 56.89 48.75 52.98 59.69 99.20
Al2O3 31.48 14.32 33.11 22.01 17.91 0.32
Fe2O3 6.05 10.22 4.51 6.84 7.71 0.01
Na2O 0.62 2.61 0.07 2.36 0.87 0.05
K2O 1.77 3.01 1.57 2.01 1.82 0.02
CaO 0.28 1.92 0.17 1.22 0.75 0.04
MgO 0.35 0.87 0.97 0.56 0.50 0.17
TiO2 1.49 1.02 0.10 0.91 1.21 0.02
LoI 16.58 9.5 10.75 11.11 9.54 0.08
Table III - Chemical composition and loss on ignition of raw materials. [Tabela III - Composição química e perda sob queima das matérias primas.]
Clay
samples (vol.%)< 2 µm < 10 µm (vol.%) < 53 µm (vol.%)
RC1 17.19 39.82 44.99
RC2 26.38 54.21 19.41
RC3 23.62 48.12 28.26
RC4 23.73 48.90 27.37
RC5 33.04 44.36 22.60
Table IV - Particle size distribution of the clay-silt fraction of studied clays.
[Tabela IV - Distribuição de tamanho de partículas da fração de silte das argilas estudadas.]
Figure 2: The variation of lexural strength of green bodies as a function of clay-silt and sand of tested red clays.
[Figura 2: Resistência à lexão dos corpos a verde em função da composição de silte e de areia das argilas testadas.]
a b c d e
4
3
2
1
0
Formula
fraction increases the strength of the dry body. A relatively higher dry strength was measured in RC5 and RC2 whereas, RC1 shows the lower dry strength compared to other samples. This can be explained considering the particle size distribution of clay-silt fraction (Table IV). RC2 and RC5 are composed of higher amounts of both clay fraction and ine particle fraction (< 10 µm). Accordingly, these samples have higher dry strength as dry strength increases with decreasing particle size. RC1 has lower amount of clay and ine fractions and accordingly, it has lower dry strength.
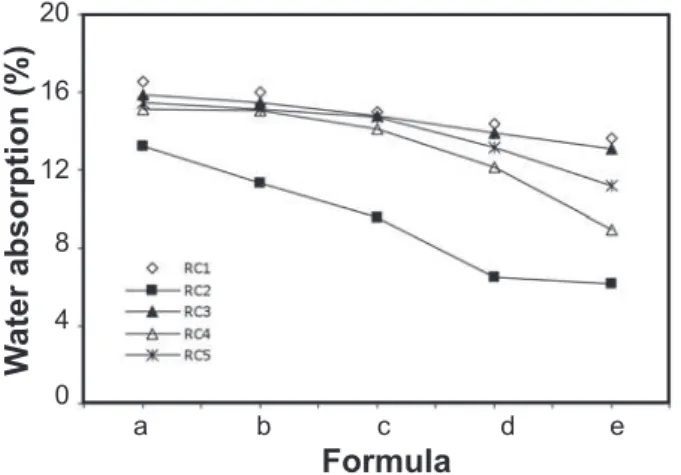
Fig. 3 and Fig. 4 show the gresiication diagrams of linear shrinkage and water absorption of sintered bodies at 1000 °C respectively. It was clearly observed that the linear shrinkage increases with increasing clay-silt fraction for all samples except for RC2, which shows the similar trend from composition a to d and then, a slight decrease at e. This may be due to formation of a high amount of a liquid phase with lower viscosity resulting in the blotting of the samples. In addition, RC2 shows higher shrinkage for every composition whereas, RC1 and RC3 show the lower
linear shrinkage compared to other clays. An almost opposite trend of linear shrinkage was observed with values of water absorption for such clays, as expected (see Fig. 4). Further, signiicantly lower water absorption was measured for every composition of RC2. In contrast, higher water absorption was measured in RC1. The samples rich in kaolinite (RC1 & RC3) gave normally higher water absorption compared to illite rich samples.
The results of linear shrinkage and water absorption could be explained considering the sintering behavior of a red clay body. The densiication of a red clay body takes place by two mechanisms; solid state sintering is prominent below 950 °C and liquid phase sintering is prominent above 950 °C [13-15]. In addition, the liquid phase sintering has a more signiicant effect on the densiication than the solid state sintering. Therefore, the major factors controlling the liquid phase sintering such as the amount and the viscosity of the liquid phase play a key role in densiication. Even though the viscosity and the amount of liquid phase were mainly controlled by temperature and content of the luxing oxides, only the luxing oxide content affected the variation of the viscosity and amount of the liquid phase of each sample in the present study, since the iring temperature was constant (1000 °C). The low temperature active luxing oxides such as alkaline oxides (N2O and K2O) and Fe2O3 mainly contributed to the liquid formation at 1000 °C [16, 17]. Accordingly, the higher amount of alkaline oxide and Fe2O3 (see Table III) of RC2 has given rise to the higher amount of liquid phase which increases the density of the body by decreasing the porosity. However, when the clay-silt fraction increases up to 90 wt.%, the high amount of liquid phase with lower viscosity which could not be penetrated by the entrapped air has resulted in the blotting of the sample [18]. However, the blotting was eliminated by increasing the sand content up to 20 wt.% of the body composition, since sand mainly acts as iller at 1000 °C, reducing the amount of liquid phase. It is possible that this can also be performed by increasing the Al2O3 content of the body composition, which could be easily done by blending kaolinite group clay, since kaolinite is a refractory mineral with a high amount of Al2O3. In addition, other illite rich samples (RC4 and RC5) with relatively higher amounts of alkaline oxides and Fe2O3 gave a higher densiication due to formation of higher amounts of liquid phase whereas, the samples rich in kaolinite group minerals with lower amounts of alkaline oxides and Fe2O3 (RC1 and RC3) gave a lower densiication due to the formation of lower amounts of liquid phase. In addition, there is a higher increasing rate of linear shrinkage and higher decreasing rate of water absorption from composition d to e of all clay samples except RC2. This indicates that a higher amount of liquid phase has formed when increasing clay-silt fraction from composition d to e.
The transformation of the mineralogical structure of kaolinite and illite at high temperature further explains the vitriication behavior of the sample. The illite crystal structure breaks down between 700 °C and 850 °C and crystallizes spinel and primary mullite from 950 °C while Figure 3: Linear shrinkage of the samples as a function of clay-silt
and sand of tested red clays at 1000 ºC.
[Figura 3: Retração linear das amostras em função do teor de silte e de areia das argilas testadas a 1000 ºC.]
5
4
3
2
1
0
a b c d e
Formula
Linear shrinkage (%)
Figure 4: Water absorption of samples as a function of clay-silt and sand of tested red clays at 1000 °C.
[Figura 4: Absorção de água das amostras em função do teor de silte e de areia das argilas testadas a 1000 ºC.]
20
16
12
8
4
0
a b c d e
Formula
W
alkali cations resulted from the crystalline structure of illite start to form liquid phase at 950 °C [5, 18]. In contrast, kaolinite group clay crystallizes the spinel, mullite and forms the residual amorphous SiO2 from 950 °C and this SiO2 forms cristoballite at 1300 °C without forming any liquid phase at low temperature [5, 19]. Therefore, the higher densiication due to higher amount of liquid phase measured in illite rich samples (RC2, RC4 and RC5) is further conirmed by the observed results.
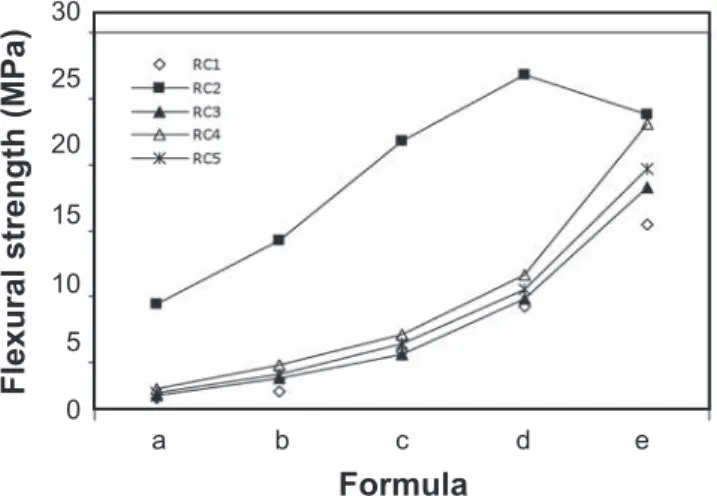
Fig. 5 shows the variation of lexural strength with increasing clay-silt fraction of the body composition. The lexural strength increases gradually from composition a to e with increasing fraction of clay-silt except for RC2 which shows a slight decrease in composition e. In addition, the lexural strength in every composition of RC2 were signiicantly higher than that of other clay samples while a comparatively lower strength was measured in samples of RC1and RC3. These results could be explained considering the fracture mechanics [20]. The large pores connected with the surface of the material greatly reduce the strength of the material. Therefore, the strength of a ceramic body increases when the pore size becomes small and they are isolated from the surface. It is clear that the measured values of lexural strength are in close agreement with the values of the water absorption. The lexural strength increases with increasing the clay-silt fraction because of the higher densiication. In addition, due to higher densiication of RC2 samples, they exhibit signiicantly higher lexural strength. However, the slight reduction of the strength of the composition e is due to blotting and small cracks on the sample as explained earlier. Further, the lower lexural strength was measured in RC1 and RC3 due to higher open porosity that was indicated by the measured high water absorption.
The fracture surfaces of ired samples of composition e of kaolinite rich sample (RC1) and composition e of illite rich clay sample (RC4) are shown in Fig. 6A and 6B, respectively. The fracture surface of composition d of
RC2 is shown in Fig. 6C. The rough surface with irregular inter connected pores is observed on RC1 sample (Fig. 6A) whereas, the smooth surface with considerably lower
a b c d e
30
25
20
15
10 5
0
Formula
Flexural strength (MPa)
Figure 5: Flexural strength of the samples as a function of clay-silt and sand of tested red clays at 1000 °C.
[Figura 5: Resistência à lexão das amostras em função do teor de silte e de areia das argilas testadas a 1000 ºC.]
Figure 6: SEM micrographs of fracture surface of samples ired at 1000 °C (A- composition eof RC1, B- e of RC4, C- d of RC2).
[Figura 6: Micrograias obtidas em microscópio eletrônico de varredura de superfícies de fratura queimadas a 1000 °C (A- composição e de RC1, B- e de RC4, C- d de RC2.]
(a)
(b)
porosity, in which most of them are isolated from the surface, is observed on RC2 and RC4 samples (Figs. 6C and 6B). This indicates that a signiicantly higher amount of liquid phase has developed on RC2 and RC4 samples than RC1. It can be clearly observed that the rounded smaller size pores are present in RC2 compared to the other two samples. It can be concluded that the measured value of water absorption, linear shrinkage and lexural strength are in close agreement with the observed fracture surface morphology.
CONCLUSIONS
The clay samples of dry zone were rich in illite group clay with a higher amount of alkaline oxides (Na2O and K2O) and Fe2O3. Samples from the wet zone were rich in the kaolinite group clay with a lower amount of alkaline oxides and Fe2O3. A high quality product with higher lexural strength and densiication can be obtained at 1000 °C when the clay comprises mainly of illite. When the amount of Na2O, K2O and Fe2O3 of clay-silt fraction is around 21 wt.%, the best quality product (lexural strength up to 26.82 MPa and water absorption < 6.51%) can be obtained by a composition of 80 wt.% clay-silt and 20 wt.% sand at 1000 °C. If the amount of Na2O, K2O and Fe2O3 is lower, a 90 wt.% of clay-silt fraction must be added to obtain the optimum quality at 1000 °C.
ACKNOWLEGEMENTS
The authors would like to acknowledge the inancial support provided by National Sciences Foundation of Sri Lanka (Grant N. RG/2006/SUNR/01). They would also like to thank W. H. A. G. Premathilaka, S. M. N. C. Senanayaka and H. M. S. Karunarathna for their collaboration.
REFERENCES
[1] M. M. J. W. Herath, Sri Lankan Minerals and Industries, 5th Ed., Geological Survey and Mines Bureau, Sri Lanka
(2003) p. 182.
[2] M. M. J. W. Herath, Economic Geology Sri Lanka, 1st Ed., Geological Survey and Mines Bureau, Sri Lanka (1995) p. 72.
[3] R. W. Smith, J. Am. Ceram. Soc. 16, 1 (1933) 36. [4] F. G. Garcia, V. R. A. Costa, G. G. Ramos, M. G. Rodriguez, Appl. Clay Sci. 5, 1 (1990) 361.
[5] M. C. Conville, W. E. Lee, J. Am. Ceram. Soc. 88, 8 (2005) 2267.
[6] W. D. Kingery, H. K. Bowen, D. R. Uhlmaun, Introduction to Ceramics, 2nd Ed., John Wiley & Sons, New York, USA (1995) 39.
[7] P. Torres, R. S. Manjate, S. Quaresma, H. R. Fernandes, J. M. F. Ferreira, J. Eur. Ceram. Soc. 27, 16 (2007) 4649. [8] P. Torres, H. R. Fernandes, S. Olhero, J. M. F. Ferreira, J. Eur. Ceram. Soc. 29, 1 (2009) 23.
[9] R. E. Grim, W. F Bradley, J. Am. Ceram. Soc. 23, 8 (1940) 242.
[10] R. E. Grim, J. Am. Ceram. Soc. 22, 1 (1939) 141. [11] S. N. Monteiro, L. A. Peçanha, C. M. F. Vieira, J. Eur. Ceram. Soc. 24, 8 (2004) 2349.
[12] C. M. F. Vieira, P. M. Andrade, G. S. Maciel, F. Vernilli, S. N. Monteiro, Ceram. Int. 32, 2 (2006) 137.
[13] F. A. C. Milheiro, M. N. Freire, A. G. P. Silva, J. N. F. Holanda, Ceram. Int. 31, 5 (2005) 757.
[14] R. R. Vander, J. O. Everhart, J. Am. Ceram. Soc. 12, 5 (1951) 361.
[15] S. J. G. Sousa, J. N. F. Holanda, Ceram. Int. 31, 2 (2005) 215.
[16] P. Alizadeh, B. E. Yekta, A. Gervei, J. Eur. Ceram. Soc. 24, 13 (2004) 3529.
[17] B. Sonuparlak, M. Sarikaya, I. A. Aksay, J. Am. Ceram. Soc. 70, 11 (1987) 837.
[18] C. M. Riley, J. Am. Ceram. Soc. 34, 4 (1951) 121. [19] T. N. McVay, C. L. Thompson, J. Am. Ceram. Soc. 11, 11 (1928) 829.
[20] S. J Schneider, Engineered Materials Handbook, Vol. 4, Ceramics and Glasses, ASM International, USA (2000) p. 426.