SUMMARY
Objective: To compare bone mineral density (BMD) and body composition (BC) of college students with diferent lifestyles. Methods: Transversal study with 85 students of Medicine (MED) and Physical Education (PE) at the Universidade Regional de Blu-menau, SC, Brazil. he anthropometric, socio-demographic, clinical, and lifestyle vari-ables were obtained through densitometric anamnesis and densitometric varivari-ables by dual-energy X-ray (DXA). he statistical tests used were: Student’s t-test, Chi-square test, and logistic regression. Results: PE male students showed a higher amount of lean body mass (79.5 ± 5.9 vs. 75.1 ± 5.3; p = 0.03) and a lower amount of body fat (16.7 ± 6.1 vs. 21.6 ± 5.6; p = 0.02) and PE female students showed a higher amount of lean body mass (68.2 ± 5.5 vs. 65.3 ± 5.5; p = 0.05). he BMD of the neck of femur (NOF), total femur (TF), and total body (TB) was higher in PE students of both gen-ders. PE students practiced more physical activities than MED students. Low bone mass (LBM) was more frequent in MED students (34.9% vs. 4.7%; p = 0.001), provided that the risk of a MED student to show LBM was nine times higher for lumbar spine (LS), ive times for NOF, eight times for TF, and seven times for TB. Conclusion: BC and BMD were diferent among the students; MED students have shown a higher risk of having LBM, and PE students practiced more physical activities.
Keywords: Osteoporosis; students; lifestyle; densitometry; photon absorptiometry; bone density.
©2012 Elsevier Editora Ltda. All rights reserved.
Study conducted at the Department of Medicine, Universidade Regional de Blumenau, Blumenau, SC, Brazil
Submitted on: 05/25/2011
Approved on: 02/02/2012
Financial Support:
Program of Scientific Initiation Scholarships of the Universidade Regional de Blumenau (PIBic-FURB), Brazil
Correspondence to:
Deisi Maria Vargas Rua Antônio da Veiga, n°140
Victor Konder 89120-000 Blumenau, SC, Brazil Phone: +55 (47) 3321-0277/0610 [email protected]
Conlict of interest: None.
Bone mass and body composition in college students
CRISTINA REUTER1, CARLOS EFRAIN STEIN2, DEISI MARIA VARGAS3
INTRODUCTION
Epidemiological evidences reveal that bone development in childhood and adolescence is one of the determinants of bone mass in maturity and senescence, and that the low acquisition thereof or “a low peak of bone mass” would be a risk factor for osteoporosis in adulthood1-4. he bone
mass peak consists of maximum bone mass achieved at the beginning of adulthood; 90% of this peak is obtained by age 18 and the remaining by age 25, approximately2,4. One
of the consequences of aging in human beings is the pro-gressive loss of bone mass. A low peak of bone mass at the end of adolescence, an excessive bone loss in adulthood, or the association of both events may lead to osteoporo-sis. he International Osteoporosis Foundation (IOF) esti-mates that a 10% increase in the peak of bone mass reduces the risk of osteoporotic fractures in adulthood by 50%3.
In the last years, several factors related to the occurrence of low bone mass (LBM) have been identiied, showing the association of bone mass with genetic factors; gender; race; hormonal proile; use of medications; chronic dis-eases; and factors related to lifestyle, such as low calcium intake, sedentary lifestyle, smoking, and excessive cafeine, alcohol, and protein consumption1-8. Epidemiologic data
analyzed by the National Academy of Science showed that the maintenance of a diet with proper intake of nutrients, especially calcium, contributes to achieve the bone mass peak and reduce the osteoporosis level in adulthood7. he
regular practice of physical activities is another lifestyle characteristic essential to the acquisition of bone mass, as evidenced by studies with children, adolescents, and young adults9-14.
College students are still in the age group of mineral acquisition and, therefore, their lifestyles may inluence this process. It is empirically known that medicine (MED) students have an “unhealthy” lifestyle, as they have their free time reduced due to an intense load of academic activ-ities (full time), with less available time to practice physical activities and to have balanced meals. On the other hand, physical education (PE) students have a lower course load (part time) with a syllabus that contains practical classes of sports that mandatorily represent the practice of regu-lar physical activities. Additionally, many of them practice other activities in their free time, usually related to physi-cal exercises. hus, in order to evaluate the impact of dif-ferent lifestyles on bone mass and body composition (BC) in young adults, the bone mineral density (BMD) and BC of MED and PE students was studied and compared.
METHODS
An observational, prospective, and transversal study was conducted with a group of individuals comprised of stu-dents of both genders in the last semesters of MED and PE courses at the Universidade Regional de Blumenau
(FURB). MED students enrolled in the fourth and ith years and PE students enrolled in the third and fourth years were invited to participate in the study. he MED sample comprised 34.8% (43 students of a total of 124) and the PE sample, 32.1% (42 students of a total of 131). Data was collected at the bone densitometry clinic located in Blumenau, Santa Catarina, in 2008 and 2009.
he socio-demographic, clinical, and lifestyle data were collected by the X-ray technician and densitometer operator through densitometric anamnesis before the densitometric examination and ater training. he densi-tometric anamnesis followed the recommendations of the International Society for Clinical Densitometry (ISCD). he variables studied were: program; age; gender; weight; height; body mass index (BMI); time of physical activity; calcium intake in childhood, adolescence and adulthood; history of fracture; family history of osteoporosis; smok-ing; use of vitamin and mineral supplement; and use of medication and related diseases. Calcium intake was cal-culated based on a 24-hour dietary recall and expressed in mg/day. his calculation used the recommendations of the Sociedade Brasileira de Densitometria Clínica (SBDens), which measure daily calcium intake as follows: 1 cup of milk (240 mL) = 300 mg of calcium; 1 cup of yoghurt (240 mL) = 400 mg; one slice of cheese (28.35 g) = 200 mg; calcium from other sources = 250 mg15. he calculation
was performed through an Excel® spreadsheet. Physical
activity was calculated weekly based on the questionnaire applied and expressed in minutes per week. he densi-tometric variables studied were: BMD in standard score (Z-score) of the lumbar spine, neck of femur, total femur, and total body; percentage of lean body mass, body fat, and bone mass of the total body.
Data on body composition and BMD were obtained through a dual-energy X-ray (DXA) examination. he densitometry was made using the Explorer equipment from Hollogic®. he results of the BMD were expressed in
g/cm² (grams of mineral tissue per area) and subsequently transformed into a standard deviation of the average age, gender, weight, and height, pursuant to the reference val-ues provided by the manufacturer, generating the Z-score. he examinations were performed by a densitometer op-erator certiied by the SBDens and the reports issued by a clinical densitometrist qualiied by the SBDens and by the International Society for Clinical Densitometry (ISCD). During the examinations, the operator veriied the posi-tion of the patient; if it was not appropriate, she interrupt-ed the examination for repositioning, aiming at ensuring quality.
he densitometric diagnosis was made based on Ze-mel16 criteria, where a Z-score lower than -1 standard
the densitometer operator in a Camry® digital scale and an
stadiometer-type anthropometer from Tonelli®.
he gender and the program were evaluated with re-spect to the following variables: age; weight; height; BMI; time of weekly physical activity; calcium intake in child-hood, adolescence, and adulthood; and Z-score of tometric variables using the Student’s t- test. he densi-tometric diagnosis was evaluated with respect to gender and program using the chi-square test. p-values < 0.05 were deemed statistically signiicance. Procedures of bi-nary logistic regression were used for the multivariable analysis. he programs used were LHStat 2.1® (analysis of
data by Cláudio Loesh from the Universidade Regional de Blumenau – 09/18/2008) and Epi InfoTM 3.5.1®
(Data-base and statistics sotware for public health professionals – 10/25/2007). Four models of regression were obtained, whose dependent variables were named as: (1) lumbar spine, (2) neck of femur, (3) total femur and (4) total body, one model to each dependent variable. he level of signii-cance for the inclusion of variables in the models was es-tablished as 5%.
his article was iled with the Ethics Committee of the Universidade Regional de Blumenau under the number 008/08 and approved on February 13, 2008, all partici-pants previously signed the informed consent.
RESULTS
Eighty-ive college students participated in the study, 42 from the PE program and 43 from the MED program (49.5% versus 50.5%). From the PE students, 27 were fe-male and 15 were fe-male (64.3% versus 35.7%), and from the MED students, 25 were female and 18 were male (58.1% versus 41.9%).
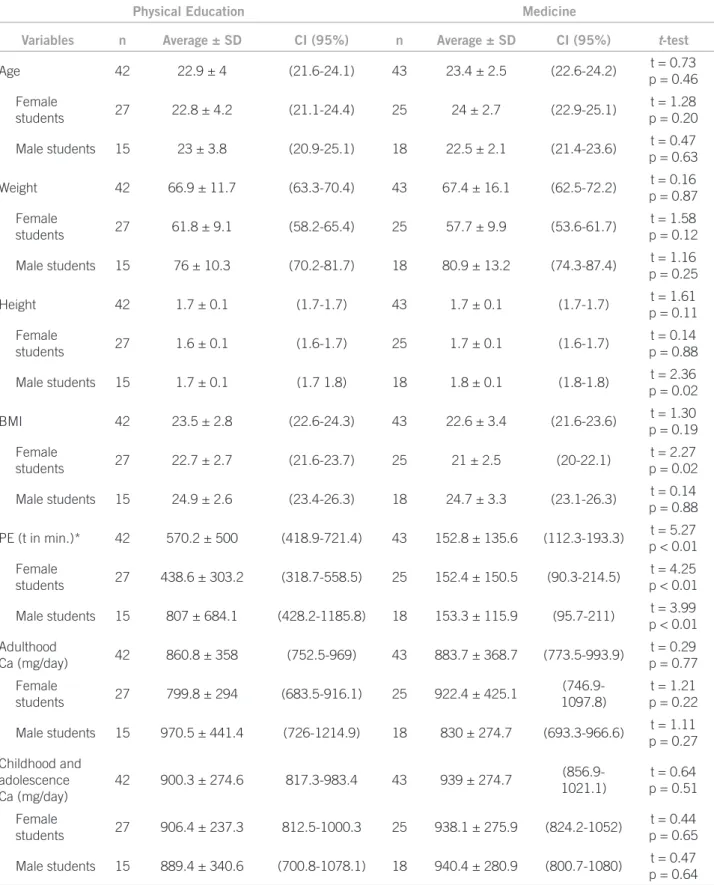
Table 1 shows the results of the variables: age; body weight; height; BMI; time of physical exercises expressed in minutes; calcium intake in milligrams in adulthood, childhood and adolescence. hese variables were stratiied irst by course and then by gender. Time spent in the week-ly practice of physical activities was higher in PE students of both sexes. Height was higher in MED male students and BMI was higher in PE female students.
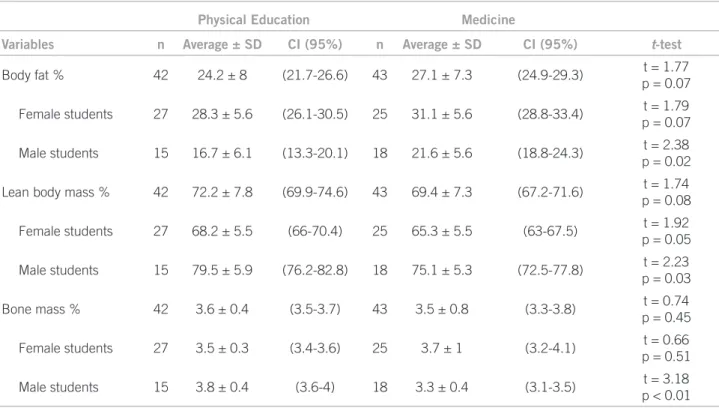
Table 2 shows the results of the body composition. MED male students have shown higher amounts of body fat and lower amounts of lean body mass. MED female stu-dents, however, showed lower amounts of lean body mass, with no signiicant diferences for body fat.
Table 3 presents BMD in Z-score in the evaluated parts of the body, which were higher in PH students both in the proximal femur (neck of femur and total femur) and in the total body for both genders. he BMD of the lumbar spine was statistically diferent only in male students.
Regarding the densitometric diagnosis, a higher preva-lence of LBM was observed in MED students (34.9% versus
4.7%; p = 0.001). In the stratiication by gender, LBM re-mained more prevalent for females in the MED program (36.0% versus 3.7%; p < 0.01), nonetheless for males, there was no signiicant diference between the courses, although the frequency of LBM was approximately ive times higher for MED students (33.3% versus 6.6%; p = 0.08).
here was no signiicant diference regarding the his-tory of previous fractures between the courses (32.6% versus 26.1%; p = 0.68). Also, there was no association of drugs with bone mass between the courses. Among the most used drugs (currently or previously) in the PH students group were oral contraceptive (24.9%), satiety agents (4.9%), and L-thyroxine (4.9%). In the group of MED students, the most used drugs were oral contracep-tive (27.9%), the association of inhaled corticosteroid/ β2-adrenergic (4.6%), satiety agents (4.6%), and oral cor-ticosteroid (4.6%). 7.3% of PE students and 6.9% of MED students used vitamin supplement. No student mentioned the use of a calcium supplement or cigarettes. One female MED student reported previous smoking habits (2 packs/ year), but she did not meet the criteria for LBM.
Physical Education Medicine
Variables n Average ± SD CI (95%) n Average ± SD CI (95%) t-test
Age 42 22.9 ± 4 (21.6-24.1) 43 23.4 ± 2.5 (22.6-24.2) t = 0.73
p = 0.46
Female
students 27 22.8 ± 4.2 (21.1-24.4) 25 24 ± 2.7 (22.9-25.1)
t = 1.28 p = 0.20
Male students 15 23 ± 3.8 (20.9-25.1) 18 22.5 ± 2.1 (21.4-23.6) t = 0.47
p = 0.63
Weight 42 66.9 ± 11.7 (63.3-70.4) 43 67.4 ± 16.1 (62.5-72.2) t = 0.16
p = 0.87
Female
students 27 61.8 ± 9.1 (58.2-65.4) 25 57.7 ± 9.9 (53.6-61.7)
t = 1.58 p = 0.12
Male students 15 76 ± 10.3 (70.2-81.7) 18 80.9 ± 13.2 (74.3-87.4) t = 1.16
p = 0.25
Height 42 1.7 ± 0.1 (1.7-1.7) 43 1.7 ± 0.1 (1.7-1.7) t = 1.61
p = 0.11
Female
students 27 1.6 ± 0.1 (1.6-1.7) 25 1.7 ± 0.1 (1.6-1.7)
t = 0.14 p = 0.88
Male students 15 1.7 ± 0.1 (1.7 1.8) 18 1.8 ± 0.1 (1.8-1.8) t = 2.36
p = 0.02
BMI 42 23.5 ± 2.8 (22.6-24.3) 43 22.6 ± 3.4 (21.6-23.6) t = 1.30
p = 0.19
Female
students 27 22.7 ± 2.7 (21.6-23.7) 25 21 ± 2.5 (20-22.1)
t = 2.27 p = 0.02
Male students 15 24.9 ± 2.6 (23.4-26.3) 18 24.7 ± 3.3 (23.1-26.3) t = 0.14
p = 0.88
PE (t in min.)* 42 570.2 ± 500 (418.9-721.4) 43 152.8 ± 135.6 (112.3-193.3) t = 5.27
p < 0.01
Female
students 27 438.6 ± 303.2 (318.7-558.5) 25 152.4 ± 150.5 (90.3-214.5)
t = 4.25 p < 0.01
Male students 15 807 ± 684.1 (428.2-1185.8) 18 153.3 ± 115.9 (95.7-211) t = 3.99
p < 0.01
Adulthood
Ca (mg/day) 42 860.8 ± 358 (752.5-969) 43 883.7 ± 368.7 (773.5-993.9)
t = 0.29 p = 0.77
Female
students 27 799.8 ± 294 (683.5-916.1) 25 922.4 ± 425.1
(746.9-1097.8)
t = 1.21 p = 0.22
Male students 15 970.5 ± 441.4 (726-1214.9) 18 830 ± 274.7 (693.3-966.6) t = 1.11
p = 0.27
Childhood and adolescence Ca (mg/day)
42 900.3 ± 274.6 817.3-983.4 43 939 ± 274.7
(856.9-1021.1)
t = 0.64 p = 0.51
Female
students 27 906.4 ± 237.3 812.5-1000.3 25 938.1 ± 275.9 (824.2-1052)
t = 0.44 p = 0.65
Male students 15 889.4 ± 340.6 (700.8-1078.1) 18 940.4 ± 280.9 (800.7-1080) t = 0.47
p = 0.64
SD, standart deviation; BMI, body mass index; PE, physical education. *Weekly physical exercises (time in minutes).
Table 1 – Anthropometric and lifestyle variables stratified by program and gender
he model showed a seven times higher probability of a MED student to be diagnosed with LBM in comparison with a PE student. In the four logistic regression models
Table 2 – Body composition parameters stratified by program and gender
Physical Education Medicine
Variables n Average ± SD CI (95%) n Average ± SD CI (95%) t-test
Body fat % 42 24.2 ± 8 (21.7-26.6) 43 27.1 ± 7.3 (24.9-29.3) t = 1.77
p = 0.07
Female students 27 28.3 ± 5.6 (26.1-30.5) 25 31.1 ± 5.6 (28.8-33.4) t = 1.79
p = 0.07
Male students 15 16.7 ± 6.1 (13.3-20.1) 18 21.6 ± 5.6 (18.8-24.3) t = 2.38
p = 0.02
Lean body mass % 42 72.2 ± 7.8 (69.9-74.6) 43 69.4 ± 7.3 (67.2-71.6) t = 1.74
p = 0.08
Female students 27 68.2 ± 5.5 (66-70.4) 25 65.3 ± 5.5 (63-67.5) t = 1.92
p = 0.05
Male students 15 79.5 ± 5.9 (76.2-82.8) 18 75.1 ± 5.3 (72.5-77.8) t = 2.23
p = 0.03
Bone mass % 42 3.6 ± 0.4 (3.5-3.7) 43 3.5 ± 0.8 (3.3-3.8) t = 0.74
p = 0.45
Female students 27 3.5 ± 0.3 (3.4-3.6) 25 3.7 ± 1 (3.2-4.1) t = 0.66
p = 0.51
Male students 15 3.8 ± 0.4 (3.6-4) 18 3.3 ± 0.4 (3.1-3.5) t = 3.18
p < 0.01
Physical Education Medicine
Z-score n Average ± SD CI (95%) n Average ± SD CI (95%) t-test
Lumbar spine 42 0.3 ± 1.1 (0-0.6) 43 -0.4 ± 1.2 (0 - -0.1) t = 3.18
p < 0.01
Female students 27 0.1 ± 0.9 (0-0.5) 25 -0.4 ± 1.3 (0 - 0.1) t = 1.85
p = 0.07
Male students 15 0.7 ± 1.2 (0-1.3) 18 -0.5 ± 1 (0 - 0.1) t = 2.85
p < 0.01
Neck of femur 42 1.1 ± 1.1 (0.7-1.4) 43 0.1 ± 1.2 (0 - 0.5) t = 3.80
p < 0.01
Female students 27 0.8 ± 0.9 (0.5-1.2) 25 -0.1 ± 1.1 (0 - 0.4) t = 3.16
p < 0.01
Male students 15 1.5 ± 1.3 (0.8-2.3) 18 0.4 ± 1.4 (0 - 1) t = 2.50
p = 0.01
Total femur 42 0.7 ± 1 (0.4-1) 43 -0.1 ± 1.1 (0 - 0.2) t = 3.43
p < 0.01
Female students 27 0.3 ± 0.9 (0-0.7) 25 -0.4 ± 1 (0 - 0) t = 2.83
p < 0.01
Male students 15 1.3 ± 1 (0.7-1.8) 18 0.2 ± 1.2 (0 - 0.8) t = 2.58
p = 0.01
Total body 42 -0.1 ± 0.9 (0-0.1) 43 -0.9 ± 1 (0 - -0.6) t = 3.57
p < 0.01
Female students 27 -0.1 ± 0.9 (0-0.2) 25 -0.8 ± 0.9 (0 - -0.5) t = 2.83
p < 0.01
Male students 15 -0.2 ± 0.9 (0-0.4) 18 -0.9 ± 1.1 (0 - -0.4) t = 2.09
p = 0.04
DISCUSSION
he results of this study evidenced that there was a difer-ence in the BMD and in the BC among MED and PE col-lege students, especially regarding male students. here are studies that have attributed the diferences in bone mass to intrinsic and extrinsic factors5. he former group derives
from genetic constitution, gender, race and hormonal fac-tors, which determine roughly 80% of the bone mass peak. he latter group is related to the use of medications, pres-ence of chronic diseases, and lifestyle habits that mainly include dietary patterns, alcohol intake, smoking, and physical activities5.
his study highlights the impact of lifestyle on bone mass in young adults, especially with respect to physical activity. According to the literature, there are no studies that assess bone mass and BC in college students with dif-ferent life habits. Nevertheless, there have been some stud-ies that have measured bone mass in college students in medical school. In Brazil, a study conducted in the Facul-dade de Medicina da UniversiFacul-dade de São Paulo with 100 students of both genders and similar ages, demonstrated a frequency of LBM of about 50%11. Students’ lifestyles were
analyzed, as well as their associated diseases and use of medication11. he authors found that a diference between
students with normal BMD and students with reduced BMD was the amount of physical activity performed, evi-dencing a higher frequency of LBM in students who en-gaged in physical activity for less than ive hours a week11.
All male participants from the MED program showed lower BMD in all four measured parts in comparison to the participants from the PE program. As for females, this standard was maintained, with exception of the lumbar spine. A Swedish study with MED students found gen-der diferences in the association of physical activity and BC with BMD12. In the male gender, the BMD in the total
body, neck of femur, and lumbar spine, as well as weight and lean body mass, was positively associated with the amount of weekly physical activity. In women, the BMD was associated with weight, lean body mass, and fat body mass. hese results suggest that the efect of physical activ-ity on bone mass varies according to gender and skeletal segment studied, which may explain the diferences of BMD between the genders observed in this study.
In Japan, the evaluation of BMD in college students from several courses evidenced a positive efect of physi-cal exercise on BMD, especially impact exercises17,while in
New York a study with 50 ultra-Orthodox Jewish adoles-cents, whose habits encourage academic and intellectual activity to the detriment of physical activity, showed that a sedentary lifestyle can be detrimental to BMD14. he BMD
of these adolescents with ages from 15 to 19 years showed lumbar spine BMD values below reference values with an average Z-score of - 1.2 ± 1.2 SD, -1.7 ± 1.1 in males and -0.6 ± 1.0 in females.
Calcium intake is another extrinsic factor that inter-feres with bone mass. Calcium is essential to healthy bone development. Its proper consumption during childhood and adolescence contributes to bone growth and acquisi-tion of bone mass4. his study has not veriied
diferenc-es in the calcium intake between PE and MED students. Nevertheless, the daily average consumption is below the 1,000 mg/day recommended for the age group from 19 to 30 years17, evidencing the inadequacy of these young
adults concerning calcium consumption. his inding oc-curs in other national and international studies7,18-20. In
Brazil, the study on calcium consumption by teenagers attending public schools in Osasco (SP) showed that the daily average consumption is approximately half of the amount recommended for both males and females20. he
daily average veriied was 628.8 ± 353.8 mg/day for boys and 565.6 ± 295.4 mg/day for girls, which are below the recommended amount for this age group. he reduction in calcium daily intake seems to be a trend of the mod-ern society. he substitution of milk and milk products by non-dairy products such as juices and sot drinks has contributed to that, in addition to the increase of alcohol, cafeine, oxalate, phytate, and protein consumption, which reduces calcium retention in the body7,21,22. Inadequate
calcium consumption is a risk factor that makes it reach-ing the bone mass peak more diicult, which, associated with a sedentary lifestyle, can have an even worse negative impact.
As for BC, male PE students showed higher amounts of bone mass and lean body mass and lower amounts of body fat compared to MED students of the same gen-der, possibly a relection of the higher physical activity. he literature describes a positive association between lean body mass and bone mass23-25. Lean body mass plays
an important role in bone deposition and bone health in the long term, as it maintains mechanical pressure on the bone. Some clinical tests already conirmed that it is a key predictor of increased bone mineral content26. In this
re-search, results of greater lean body mass and greater bone mass found in PE students reinforce the hypothesis that bone performance is driven by muscle development, a principle based on the mechanostat theory. With respect to body fat, literature is controversial. Although the tradi-tional paradigm suggests that adiposity beneits the skel-eton and protects against osteoporosis, there are scientiic papers which challenge this widely disseminated view and present evidences that, despite the increase of mechani-cal load, the adipose tissue is not beneicial to the bone structure in young men and women24. Two studies with
women from childhood until adult life showed that body fat is negatively associated with bone mass26,27.hese
LBM prevalence was greater in MED students, espe-cially in females. Despite the quantitative diference in bone mass and frequency of LBM observed between the two groups, the occurrence of bone fractures was not dif-ferent up to the moment of this study. A higher probability of MED students to be diagnosed with LBM in the four bone parts studied (lumbar spine, total body, neck of fe-mur and total fefe-mur) was identiied. hus, it can be as-sumed that MED students may not reach a proper bone mass peak, which can be a risk factor to osteoporosis and fractures in the adult age.
CONCLUSION
MED students from FURB have shown lower bone mass, diferent BC and higher risk of having LBM than PE stu-dents. hese diferences may be attributed to lifestyle, especially to the quantitative variations in physical ac-tivities. Interventions intended to change lifestyle habits, particularly stimulation of regular physical activities, as well as orientations on proper calcium daily intake, could contribute to optimize these young adults’ bone health. Studies to evaluate the occurrence of fractures in these young adults during their adult life could be useful to clarify whether the quantitative diferences in bone mass veriied in this research afect or not the incidence of frac-tures in later ages.
REFERENCES
1. Oliver H, Jameson KA, Sayer AA, Cooper C, Dennison EM. Growth in early life predicts bone strength in late adulthood: he Hertfordshire cohort study. Bone. 2007;41:400-5.
2. Bonjour JF, Chevalley T, Ferrari S, Rizzoli R. he importance and relevance of peak bone mass in the prevalence of osteoporosis. Salud Publica Mex. 2009;51(Suppl 1):S5-S17.
3. Bonjour JP, Invest in your bones, how diet, life styles and genetics afect bone development in young people. IOF. 2001; p.1-10. [cited 2010 Sept 21]. Avail-able from: www.iobonehealth.org/download/osteofound/.../invest_in_your_ bones.pdf.
4. Sawyer AJ, Bachrach LK. Rationale for bone densitometry in childhood and adolescence. In: Sawyer AJ, Bachrach LK, Fung EB. Bone densitometry in growing patients: guidelines for clinical practice. Totowa: Humana Press; 2007. p.1-13.
5. Campos LMA, Liphaus BL, Silva CAA, Pereira RMR. Osteoporose na infância e na adolescência. J Pediatr. 2003;79:481-8.
6. Frazão P, Navieira M. Fatores associados à baixa densidade mineral óssea em mulheres brancas. Rev Saúde Pública. 2007;41:740-8.
7. Greer FR, Krebs NF, Committee on Nutrition. Optimizing bone health and cal-cium intakes of infants, children and adolescents. Pediatrics. 2006;117:578-85. 8. Bueno AL, Czepielewski MA. he importance for growth of dietary intake of
calcium and vitamin D. J Pediatr. 2008;84:386-94.
9. Branca F, Valtueña S. Calcium, physical activity and bone health - building bones for a stronger future. Public Health Nutr. 2001;4:117-23.
10. Ortega FB, Ruiz JR, Castillo MJ, Sjöström M. Physical itness in childhood and adolescence: a powerful marker of health. Int J Obes. 2008;32:1-11. 11. Silva MAG, Lima F, Pereira RMR. Estudo da densidade mineral óssea em 100
alunos de graduação da Faculdade de Medicina da Universidade de São Paulo. Rev Bras Reumatol. 1998;38:291-6.
12. Hogstrom M, Nordstrom A, Alfredson H, Lorentzon R, horsen K, Nordstrom P. Current physical activity is related to bone mineral density in males but not in females. Int J Sports Med. 2007;28:431-6.
13. Juníchi ABO, Sonoe M, Takeshi A, Norie H; Keiko A. Relationship between bone mass and life-style among university students. J Educ Health Sci. 2003;48:359-68.
14. Taha W, Chin D, Silveberg AI, Lashiker L, Khateeb N, Anhalt H. Reduced spi-nal bone mineral density in adolescents of an ultra-orthodox jewish commu-nity in Brooklyn. Pediatrics. 2001;107:1-6.
15. Reis SR. Evoluímos! Às vezes sem sair do lugar. Conectividade óssea. 16ª ed. Informativo Oicial da SBDens; 2008.
16. Zemel BS, Petit M. Evaluation. In: Sawyer AJ, Bachrach LK, Fung EB. Bone densitometry in growing patients: guidelines for clinical practice. Totowa: Hu-mana Press; 2007. p.115-25.
17. Institute of Medicine of the National Academies. Dietary reference intakes for calcium and vitamin D. Report brief 2010. [cited 2010 Nov 24]. Available from: http://www.iom.edu/.
18. Leite M, Padrão P, Moreira P. Ingestão nutricional e estimativa da den-sidade mineral óssea em adolescentes do sexo feminino. Acta Med Port. 2007;20:299-306.
19. Mesías M, Seiquer I, Navarro MP. Calcium nutrition in adolescence. Crit Rev Food Sci Nutr. 2011;51:195-209.
20. Lerner BR, Lei DL, Chaves SP, Freire RD. O cálcio consumido por adolescentes de escolas públicas de Osasco, São Paulo. Rev Nutr. 2000;13:57-63. 21. Fiorito LM, Marini M, Mitchell DC, Smiciklas-Wright H, Birch LL. Girls’ early
sweetened carbonated beverage intake predicts diferent patterns of bever-age and nutrient intake across childhood and adolescence. J Am Diet Assoc. 2010;110:543-50.
22. Rajeshwari R, Yang SJ, Nicklas TA, Berenson GS. Secular trends in children’s sweetened-beverage consumption (1973 to 1994): the Bogalusa heart study. J Am Diet Assoc. 2005;105:208-14.
23. Ptudowski P, Matusik H, Olzaniecka M, Lebiedowski M, Lorenc RS. Refer-ences values for the indicators of skeletal and muscular status of healthy polish children. J Clin Densitom. 2005;8:164-77.
24. Rauch F, Bailey DA, Baxter-Jones A, Mirwald R, Faulkner R. he muscle-bone unit during the pubertal growth spurt. Bone. 2004;34:771-5.
25. Capozza RF, Cointry GR, Cure-Ramirez P; Ferretti JL, Cure-Cure C. A DXA study of muscle-bone relationships in the whole body and limbs of 2512 nor-mal men and pre- and post-menopausal woman. J Bone. 2004;35:283-95. 26. Burrows M, Baxter-Jones A, Mirwald R, Macdonald H, McKay H. Bone
min-eral accrual across growth in a mixed-ethnic group of children: are Asian chil-dren disadvantaged from an early age? Calcif Tissue Int. 2009;84:366-78. 27. Janicka A, Wren TAL, Sanchez MM, Dorey F, Kim OS, Gilsanz V. Fat mass is