ABSTRACT: Mullite is an excellent structural material due to its high temperature stability, high electrical insulation capabilities and creep resistance. This material has a number of technological applications, such as rocket nozzles used in the aerospace industry. In this work, mullite was obtained by sol-gel process, using silicic sol, aluminum nitrate and ethylene glycol, besides the following volume ratios of silica sol dispersion to ethylene glycol: 1/0; 1/1; 1/2; and 1/3. After drying, the samples were thermal treated at temperatures of 1,000; 1,100; 1,200 and 1,250°C. The samples were characterized by scanning electron microscopy (SEM), X-ray diffraction (XRD) and specific surface area (Bruner-Emmett-Teller – BET). SEM showed that mullite particles are fine and nearly equiaxed. The sample without ethylene glycol showed 3/2 mullite after heat treatment at 1,250°C. The sample with intermediate ethylene glycol concentration presented two crystallization processes: the first at 1,000°C forming mullite and spinel phases, and the second at 1,250°C forming only 3/2 mullite. However, the sample with the highest ethylene glycol concentration crystallized directly to mullite at 1,000°C with the highest yield. There is a strong dependence on the specific surface area with temperature. The Rietveld refinement showed that the a cell lattice of mullite and the Al/Si molar ratio in the mullite formula depend on the ethylene glycol presence and on the calcination temperature. The lattice parameters b and c are not dependent on the alumina content, but the parameter a increases with the increase in the alumina content. Samples prepared with higher ethylene glycol concentrations reached higher mullite yields at lower temperatures.
KEYWORDS: Mullite, Sol-gel, Ethylene glycol, Rietveld reinement.
Inluence of Ethylene Glycol on the Mullite
Crystallization Processes Analyzed by
Rietveld Reinement
Flaviano Willians Fernandes1, Tiago Moreira Bastos Campos1, Luciana de Simone Cividanes1,
João Paulo Barros Machado1, Evelyn Alves Nunes Simonetti1, Gilmar Patrocínio Thim1
INTRODUCTION
Mullite has the nominal composition of 3Al2O3. 2SiO2 (3:2 mullite) and is the only stable crystalline phase in the SiO2 -Al2O3 binary system at atmospheric pressure (Schneider et al.,
2008). Mullite is known as an important material for electronic, optical and high-temperature structural applications because of its excellent properties, such as high-temperature strength, creep resistance, low thermal expansion coeicient and good dielectric properties, even at elevated temperatures and high oxidative atmosphere (Chakraborty, 2008; Cividanes et al., 2010a, 2011).
Mullite has a number of technological applications, such as rocket nozzles used in the aerospace industry (Schneider et al., 2008).
The mullite structures consist of chains of distorted edge-sharing Al−O octahedra at the corners and center of each unit cell running parallel to the c-axis. The chains are crosslinked by Si−O and Al−O corner-sharing tetrahedrons. he mullite crystal system is orthorhombic - dipyramidal class (H-M Symbol 2/m 2/m 2/m); Space Group: Pbam (Schneider and Komarneni, 2005; Shackelford and Doremus, 2008). Mullite is a solid solution of silica and alumina and its stoichiometry is based on the alumina/silica molecular ratio (Campos et al.,
2012; Chakraborty, 2008; Cividanes et al., 2010b; Fischer et al.,
1996; Gerardin et al., 1994; Schneider et al., 2008). he chemical
formula of mullite is oten given by Al4+2xSi2-2xO10-x, where x=0,
x=0.25 and x=0.4 correspond to sillimanite, 3:2 mullite and 2:1
mullite, respectively (Campos et al., 2012; Chakraborty, 2008;
Cividanes et al., 2010a; Fischer et al., 1996). he amount of oxygen
vacancies per unit cell is represented by x, which is related to the
1.Instituto Tecnológico de Aeronáutica – São José dos Campos/SP – Brazil
Author for correspondence: Gilmar Patrocínio Thim | Praça Marechal Eduardo Gomes, 50 – Vila das Acácias | CEP 12.228-900 São José dos Campos/SP – Brazil | Email: [email protected]
replacement of silicon ions (Si4+) by aluminum ions (Al3+) in the
tetrahedral sites of the mullite structure (Mazza et al., 2008).
With increasing alumina content, the cation Si4+ is replaced by
the cation Al3+ and the anion (oxygen) and the oxygen vacancies
are created to maintain charge neutrality (Campos et al., 2012;
Cividanes et al., 2011; Okada, 2008). In order to accommodate
the structural defects, signiicant distortions in the aluminum and silicon polyhedra are caused. In mullite, there are three tetrahedral “chains” in the unit cell. herefore, the distorted alumina tetrahedrons have to be arranged in an oxygen-deicient tri-cluster (three tetrahedrons sharing single corner-bridging oxygen). hese clusters constitute a distinctive element of mullite crystal structure (Schneider and Komarneni, 2005; Shackelford and Doremus, 2008). Oxygen vacancies tend to cluster with short-range order along speciic crystallographic directions which depend on the alumina content in mullite formula (Cividanes et al., 2010a).
Moreover, oxygen vacancies tend to correlate in parallel with the lattice parameter a and, in a lesser extent, with b,consideringthat
mullite with lower alumina concentration tends to show more random vacancy distribution (Fischer et al., 1996; Gerardin et al.,
1994; Yabuki et al., 2002). One can assume that the lattice parameter a shows a linear dependence on the Al
2O3 content (Fischer et al.,
1996; Gerardin et al., 1994; Yabuki et al., 2002).
The mullite crystallization sequence depends on the homogeneity of silicon and aluminum in the precursor (Aksaf and Pask, 1975; Campos et al., 2012; Cividanes et al., 2010b;
Inoue, 2004; Richardson et al., 1988). When the precursor is
homogeneous, the mullite crystallization temperature is lower, and the alumina content in the mullite structure is the same of the starting material. herefore, the control of the hydrolysis and condensation rate of the starting materials is very important to increase the precursor homogeneity (Chakraborty, 2008). Otherwise, phase segregation can occur, which not only promotes the crystallization of undesirable phases, such as α-alumina and spinel, but also determines a higher mullitization temperature.
In the literature, many ceramic synthesis methods are described, such as: mixtures of solid reagents, coprecipitation of mixed salts, sol-gel, spray pyrolysis etc. (Cividanes et al., 2010a; Schneider et al.,
1994). Depending on the application and value of the inal product, each method can be justiied, since each one has its peculiarity. he sol-gel process has been used for the mullite synthesis to generate products with high purity and homogeneity. In addition, it is a versatile and good reproducible method (Cividanes et al., 2010b).
Moreover, the temperature required for the mullite crystallization is low (1,000–1,350°C) compared to traditional methods, such as
mixing of reactive powder (1,500–1,700°C) as a consequence of the high homogeneity degree of the precursor (Cividanes et al.,
2010b; Hong and Messing, 1998).
he tetraethylorthosilicate (TEOS) in alcoholic medium is one of the most frequently used silica source for synthesizing mullite by sol-gel (Oliveira et al., 2010; Cividanes et al., 2010b).
One of the purposes of this study was the replacement of TEOS by silicic acid (aqueous medium), with the aim of reducing costs. he use of silicic acid as silica source leads to higher mullite crystallization temperature. hus, chemical additives may be used to reduce this temperature, which can overcome the most sol-gel process shortcoming that is to control the hydrolysis and condensation reaction rates of the precursors. his diference in the reactivity of the starting materials can result in phase segregation prior to gelation process. However, the sol homogeneity level can be controlled by the action of chemical additives, such as carboxylic acids, β-diketones or functional alcohols, which act as chelating agents and modify the precursor reactivity (Brandhuber
et al., 2005; Campos et al., 2012; Chakraborty, 2008; Inoue, 2004;
McMahon et al., 1999; Richardson et al., 1988).
Rietveld proposed a method for refinement of crystal structures based on mathematical algorithms, which consists in comparing the experimental data obtained from X-ray difraction with calculated data (Rietveld, 1969). This method can be used for the unit cell reinement, crystal structure reinement, microstructure analysis, quantitative analysis of phases and determining the preferred orientation (Le Bail, 2004; Langford
et al., 2000). In this work, the Rietveld reinement is used for the
determination of a, b and c cell lattices of mullite synthesized
at various temperatures. As the parameter a is related to the
alumina content of mullite formed, the Al/Si molar ratio and the x factor of mullite formula can be calculated.
herefore, in this paper, mullite was obtained by sol-gel process using silicic acid and aluminum nitrite as silica and alumina precursors. Ethylene glycol was used as an agent to control the homogeneity level. he efect of ethylene glycol was analyzed by means of Rietveld reinement method.
EXPERIMENTAL
(Vetec) was used as a chemical additive in four volumetric proportions in relation to silica sol dispersion: 1/0, 1/1, 1/2 and 1/3, and the samples were named as S-0, S-1, S-2 and S-3, respectively. The procedure of obtaining silica sol and the mullite precursor gel/xerogel were described elsewhere (Campos et al., 2012). The xerogels were pre-calcined at 430°C
(for removal of organic matter), and then were calcined at 1,000; 1,100; 1,200 and 1,250°C for 5 hours. The amounts of mullite crystallized in these samples were determined by a calibration curve constructed using the X-ray diffraction (XRD) techniques described below.
Calcined samples were analyzed by XRD, in a Philips X-ray diffractometer, PW 1830/1840 model, using CuKα radiation and operating at 40 kV and 25 mA. h e XRD analysis was performed between 10° and 90°, with a scan step time of 10.1600 s and with a step size of 0.0170°. The Rietveld rei nement was performed with the data obtained from the standard reference material LaB6. h is rei nement led to a set of instrumental function parameters and the results are obtained by a validation method using a proi le matching method. A modii ed pseudo-Voigt function (TCHZ) was used to i t the proi les.
A calibration curve for mullite was used to quantify the amount of crystallized mullite in the samples calcined at 1,000; 1,100; 1,200 and 1,250°C. This curve is based on XRD analysis of solid mixtures of pure CaF2 and pure mullite, where CaF2 is used as internal standard. The XRD intensities at 26° (related to mullite) and 28° (related to CaF2) were determined, and the relative yield of mullite crystallization was determined according to Eq. 1:
x 100 (1)
where I
26 stands for the intensity of the XRD profile at 26° (2θ)
divided by the mass of the calcined sample and I
28 stands for
the intensity of the same XRD profile at 28° (2θ) divided by the mass of CaF2 introduced into the calcined sample.
Rietveld refinements were used to analyze the XRD data with the GSAS/EXPGUI software, and the a, b and c cell lattices
were determined. Then, the molar concentration of alumina in the mullite (m) was obtained with the linear relationship
between the lattice parameter a and the concentration of
alumina (m), according to Eq. 2 (Fischer et al., 1996):
m = 144.5 x a-1029.5 (2)
At er calculating the molar concentration of alumina (m),
the parameter x of the mullite equation (Al
4+2xSi2-2xO10-x) was
determined with the Eq. 3 (Fischer et al., 1996; Schneider et al., 2008):
(3)
h en, the “concentration” of Al and Si in this material (4+2x
and 2-2x, respectively) was determined. h erefore, the molar
ratio Al/Si (mullite stoichiometry) can be obtained.
Scanning electron microscopy (SEM) analyses were made using the Jeol JSM-5310 microscope, in order to observe the inl uence of heat treatment on the microstructure of ceramic powders. h e surface area analysis of the materials calcined at 1,000; 1,100; 1,200 and 1,250°C were made by Bruner-Emmett-Teller (BET) specific surface area measurements, using a Quantachrome NOVA-1200 equipment and nitrogen as the gas.
RESULTS
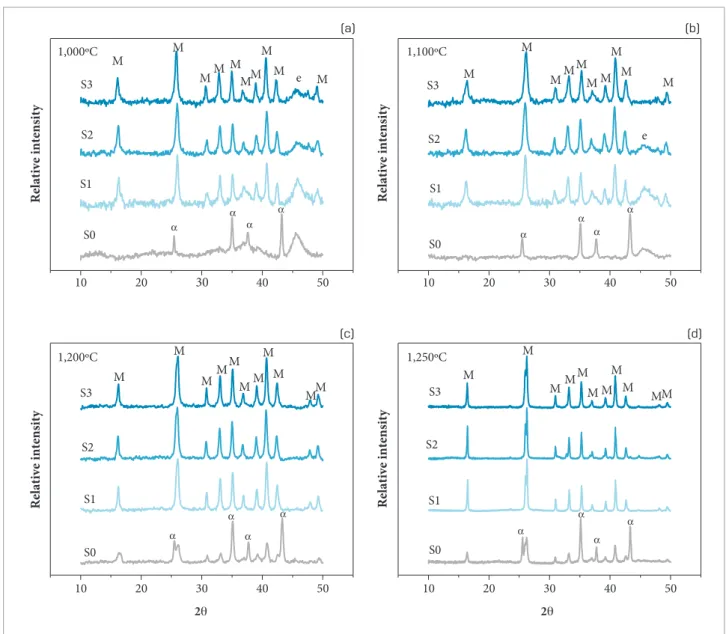
Figure 1 shows the X-ray dif raction of samples S-0, S-1, S-2 and S-3 calcined at 1,000; 1,100; 1,200 and 1,250°C for 5 hours. Figure 1(a) shows the crystallization of only α-alumina at er i ring sample S-0 at 1,000°C, while samples S-1, S-2 and S-3 formed mullite and spinel phase at er i ring at the same temperature. h e intensities of mullite peaks at 26° of the samples S-1, S-2 and S-3 are practically the same. Using these peaks as references, one can observe the decrease of the intensity in the spinel peak, in 45°, as the ethylene glycol (EG) content is increased. h erefore, EG should increase the homogeneity of mullite precursors and should make it possible to mullite crystallizes at 1,000°C, which is the mullite crystallization temperature of single phase precursor (the most homogeneous one). h is increase in the homogeneity was observed in a previous work of our research group (Campos
et al., 2012). h is work showed, using images of a scanning
electronic microscope with energy dispersive X-ray (EDX-elemental mapping), that the samples prepared with EG are constituted by silicon and aluminum particles whose sizes are much smaller than those present in the sample prepared without EG. h is previous work (Campos et al., 2012) also showed
Sample without EG had low contents of aluminum with these coordinations (Campos et al., 2012).
Figure 1(b) shows that α-alumina is still the only crystalline phase in the sample S-0 and samples prepared with EG crystallized mullite. Figure 1 also shows that the sample with the highest EG concentration, S-3, did not show the presence of spinel phase, but the other two samples prepared with EG did.
Figure 1(c) shows the disappearance of the spinel phase in all samples ired at 1,200°C and the formation of mullite phase. hus, mullite was formed by consumption of spinel. One can still observe that while the samples S-1, S-2 and S-3 formed only mullite at 1,200°C, the sample S-0 formed mullite
and α-alumina. Mullite could be obtained from sample S-3 at 1,200°C, which is close to the crystallization temperature for mullite obtained from TEOS (Oliveira et al., 2010; Ban et al.,
1996). Figure 1(d) shows the mullite formation in all samples calcined at 1,250°C, but sample S-0 continues to form the
α-alumina phase together with mullite phase.
Table 1 shows the parameters obtained from Rietveld reinements for mullite crystallization at 1,000°C. here are no data for sample S-0 since mullite did not crystallized at this temperature from this sample. One can see that sample S-1 crystallized mullite with the major percentage of alumina (70%) and samples S-2 and S-3 show practically the same percentage (~ 67%). However, the mullite yield
Figure 1. X-ray diffraction patterns of samples S-0, S-1, S-2 and S-3 calcined for 5 hours at: (a) 1,000°C; (b) 1,100°C; (c) 1,200°C and (d) 1,250°C; M: mullite; e: spinel; α: α-alumina.
10
1,000ºC 1,100ºC
1,200ºC 1,250ºC
20 30 40 50 10 20 30 40 50
10 20 30 40 50 10 20 30 40 50
S0 S1 S2
S3 M
M M
M M M M M M
Relative intensity
M
e MM
M
M M M
M M
M S3
S2
S1
Relative intensity
S0
e M
S0 S1 S2 S3
M
M
M MM
MM M
M
MM
Relative intensity
2θ
M
M
MM M
M M M
M MM S3
S2
S1
S0
Relative intensity
2θ (c)
(b)
is quite diferent between the samples, where the sample prepared with the highest EG concentration showed the highest yield (52%), while the sample prepared with the lowest EG concentration showed the lowest mullite yield (35%). he cell parameters b and c do not depend on the alumina content in the mullite formula,
as reported in the literature. herefore, they are virtually constant in all experiments. he parameter a determined for mullite from
all samples is very similar too.
It is important to note that the alumina content showed in Table 1 is the Al2O3 molar content that is present in the mullite structure, according to the chemical formula of mullite: Al
4+2xSi2-2xO10-x. In this table, 3/2 mullite has 60%
of Al2O3 molar content, and 2/1 mullite has 67%.
Table 2 shows that alumina contents in all samples treated at 1,100°C are lower than that treated at 1,000°C. Therefore, samples were initially rich in alumina and the thermal treatment at 1,100°C provoked the incorporation of silica into
mullite formula. Samples prepared with higher concentration of EG lead to mullite with higher contents of alumina and higher crystallization yields. The lattice parameters b and c
are not depended on the alumina content, but the parameter
a increases with the increase of alumina content.
Table 3 shows that S-0 crystallized mullite with 53% of alumina, while all samples prepared with EG reach alumina contents closer to mullite 3/2 (64%). However, mullite at this temperature prepared from all samples with EG always formed mullite with virtually the same value of alumina content. One can conclude that the alumina content of mullite depends on the presence of EG, but does not depend on its concentration. However, the mullite yield is strongly dependent on the EG concentration. Samples prepared with higher EG concentration showed higher yield than samples prepared with lower concentration.
Table 4 shows that at 1,250°C all samples crystallize mullite with composition near to Al/Si = 3/2 and all samples that
Table 3. Mullite crystallization for samples calcined at 1,200°C.
Sample Al2O3 (% mol) x Yield (%) a (Å) b (Å) c (Å)
S-0 53±2 0.1±0.1 41±4 7.493±0.008 7.687±0.007 2.872±0.002
S-1 64±2 0.33±0.08 69±4 7.563±0.002 7.690±0.002 2.8885±0.0007
S-2 64±2 0.35±0.08 81±4 7.568±0.003 7.700±0.002 2.8877±0.0007
S-3 65±2 0.36±0.08 90±4 7.575±0.003 7.699±0.003 2.8891±0.0008
Table 2. Mullite crystallization for samples calcined at 1,100°C.
Sample Al2O3 (% mol) x Yield (%) a (Å) b (Å) c (Å)
S-1 62±2 0.29±0.08 37±4 7.552±0.007 7.675±0.005 2.879±0.001
S-2 64±2 0.34±0.08 51±4 7.568±0.005 7.693±0.003 2.887±0.001
S-3 67±2 0.41±0.08 62±4 7.589±0.006 7.673±0.003 2.884±0.001
Table 1. Mullite crystallization for samples calcined at 1,000°C.
Sample Al2O3 (% mol) x Yield (%) a (Å) b (Å) c (Å)
S-1 70±2 0.48±0.08 35±4 7.61±0.01 7.72±0.01 2.891±0.003
S-2 67±2 0.41±0.08 40±4 7.58±0.01 7.72±0.01 2.888±0.002
S-3 68±2 0.43±0.08 52±4 7.59±0.01 7.72±0.01 2.890±0.002
Table 4. Mullite crystallization for samples calcined at 1,250°C.
Sample Al2O3 (% mol) x Yield (%) a (Å) b (Å) c (Å)
S-0 63±2 0.32±0.08 66±4 7.560±0.004 7.696±0.004 2.886±0.001
S-1 65±2 0.36±0.07 100±4 7.571±0.001 7.696±0.001 2.8886±0.0002
S-2 65±2 0.36±0.07 100±4 7.572±0.001 7.691±0.001 2.8878±0.0003
were prepared with EG reached a yield of 100%, while the sample prepared without EG reached a yield of 66%. All cell lattices are practically the same in the mullite crystallized at this temperature.
Schneider and Komarneni (2005) showed the influence of the Al2O3 content of mullite ceramics on the mechanical properties of the material. They showed that 3/2 mullite (60 mol % Al2O3) has about 380 MPa of bending strength at 1,300°C in air, while 2/1 mullite (67 mol % Al2O3) has about 240 MPa at the same conditions. They also showed that 3/2 mullite has about 3.4 MPa.m1/2 of fracture toughness and
2/1 mullite has about 2.4 MPa.m1/2, both at 1,300°C in air.
Therefore, one can conclude that 3/2 mullite shows better mechanical properties than 2/1 mullite, which can increase the life time and the reliability of the 3/2 mullite-based pieces for using in aerospace applications. The 2/1 mullite-based pieces can fail during application in a shorter time than 3/2 mullite, because of the Al2O3 content. Therefore, Rietveld method can be used as an analytical tool to ensure that the alumina content would not interfere with the mullite properties, since it can determine a cell lattice of mullite
and this parameter is related to alumina content.
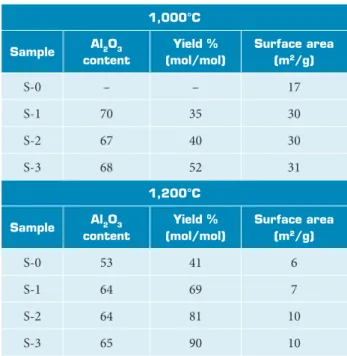
The results obtained by BET for samples S-0, S-1, S-2 and S-3 calcined at 1,000 and 1,200°C are shown in Table 5. Samples S-1, S-2 and S-3 show higher surface area than S-0 when they were fired at 1,000°C. However, these surface areas are practically the same after firing at 1,200°C, since the surface area of samples S-1, S-2 and S-3 decreased substantially when they were fired at 1,200°C. These results can be correlated to the results previously expressed in Tables 1 to 4, which showed that EG increased the homogeneity of the mullite precursors, accelerating the incorporation of silica into mullite formula, decreasing the alumina contents or increasing the mullite yield. EG molecules should act during the sol-gel stage decreasing the polymerization kinetics of silica, resulting in small silica clusters. These small silica clusters may be more homogeneously mixed with those of alumina. Single phase mullite gels are very homogeneous because they have aluminum and silicon mixed in an atomic level.
Therefore, EG increases the homogeneity of the precursor, favoring the overall mullite kinetics. The higher surface area of the samples prepared with EG calcined at 1,000°C should be correlated with the homogeneity of these samples.
Campos et al. (2012) also showed that samples prepared
with EG were constituted by silicon and aluminum particles whose sizes are much smaller than those present in the sample prepared without EG. Samples prepared with EG also showed good homogeneity, since they crystallizes mullite in lower temperatures compared to the sample prepared without EG.
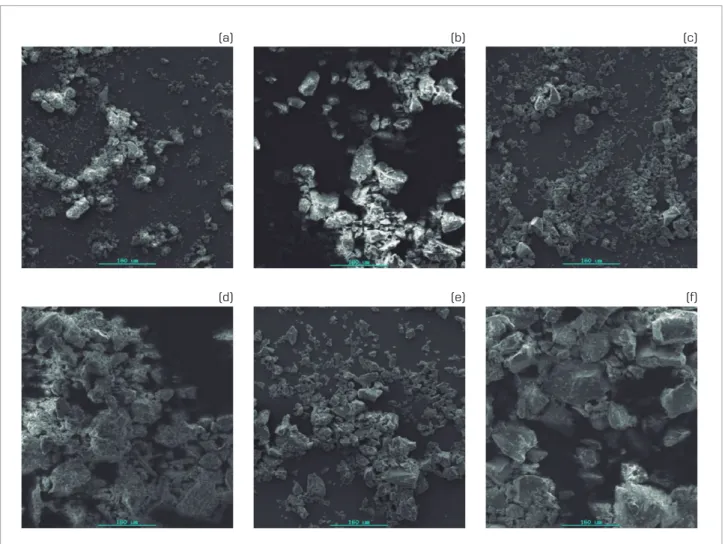
Figure 2 shows the SEM micrographs of samples S-0, S-1 and S-3 calcined at 1,000°C for 5 hours (Fig. 2a, b and c, respectively) and 1,250°C for 5 hours (Fig. 2d, e and f, respectively). SEM micrograph of sample S-2 is not shown because it was very similar to the samples S-1 and S-3.
It can be seen from the images, and in agreement with the BET results, that samples with the same EG/silanol volumetric proportion and calcined at 1,000°C present smaller particles compared to samples calcined at 1,250°C. Furthermore, for both temperatures (1,000 and 1,250°C), it is clear that S-0 sample presents particles with irregular shapes and samples S-1 and S-3 contain particles with near-angular shapes. This changing in the morphology of the particles is explained by the changing in the phases (from α-alumina to mullite, or from mullite with different alumina contents) present in the samples.
Table 5. Effect of heat treatment on mullite amount and surface area.
1,000°C
Sample Al2O3 content
Yield % (mol/mol)
Surface area (m2/g)
S-0 – – 17
S-1 70 35 30
S-2 67 40 30
S-3 68 52 31
1,200°C
Sample Al2O3 content
Yield % (mol/mol)
Surface area (m2/g)
S-0 53 41 6
S-1 64 69 7
S-2 64 81 10
CONCLUSIONS
EG has a positive efect in the crystallization of mullite, with the suppression of undesirable phases like α-alumina. he experimental methodology used here showed to be efective for obtaining mullite powder with ine particles, and in the temperature near 1,200°C (near the crystallization temperature when using TEOS as precursor), with a lower cost than the methods that use TEOS as silica source. hese ine powders have adequate characteristics to be applied in the sintering process of heat insulation or heat exchanges parts.
he X-ray analysis and the Rietveld reinement showed that
a cell lattice of mullite and the Al/Si molar ratio in the mullite
formula depend on the presence of EG and on the calcination temperature. However, diferent EG concentrations inluence
the a cell lattice virtually in the same way. he samples prepared
with higher concentration of EG lead to mullite with higher crystallization yields at lower temperatures.
The Rietveld method showed to be efficient to analyze the Al2O3 content in the mullite, which is associated to the mechanical properties of mullite. hen, this method can be used to ensure that the mullite ceramics will not fail during aerospace application.
ACKNOWLEDGMENTS
he authors gratefully acknowledge CNPq, FAPESP and CAPES for inancial support.
Figure 2. Scanning electron microscopy micrographs of samples S-0, S-1 and S-3 calcined at: 1,000°C for 5 hours (a, b and c, respectively) and 1,250°C for 5 hours (d, e and f, respectively).
(a)
(d)
(b)
(e)
(c)
REFERENCES
Aksaf, İ.A.and Pask, J.A., 1975, “Stable and Metastable Equilibria in the System SiO2 -Al2O3”, Journal of the American Ceramic Society, Vol. 58, No. 11-12, pp. 507-512. doi: 10.1111/j.1151-2916.1975. tb18770.x
Ban, T., Hayashi, S., Yasumori, A., and Okada, K., 1996, “Characterization of Low Temperature Mullitization”, Journal of the European Ceramic Society, Vol. 16, No. 2, pp. 127-132. doi: 10.1016/0955-2219(95)00131-X
Brandhuber, D., Torma, V., Raab, C., Peterlik, H., Kulak, A., and Hu, N., 2005, “Glycol-Modiied Silanes in the Synthesis of Mesoscopically Organized Silica Monoliths with Hierarchical Porosity”, Chemistry of Materials, Vol. 17, No. 16, pp. 4262-4271. doi: 10.1021/ cm048483j
Campos, T.M.B., Cividanes, L.S., Brunelli, D.D., Sakane, K.K., and Thim, G.P., 2012, “Effect of ethylene glycol on the mullite crystallization”, Journal of the European Ceramic Society, Vol. 32, No. 4, pp. 835-842. doi: 10.1016/j.jeurceramsoc.2011.09.028
Chakraborty, A.K., 2008, “Si-incorporated alumina phases formed out of diphasic mullite gels”, Journal of Materials Science, Vol. 43, No. 15, pp. 5313-5324. doi: 10.1007/s10853-008-2775-y
Cividanes, L.S, Brunelli, D.D., Bertran, C.A., Campos, T.M.B., and Thim, G.P., 2011, “Urea effect on the mechanism of mullite crystallization”, Journal of Materials Science, Vol. 46, No. 23, pp. 7384-7392. doi: 10.1007/s10853-011-5699-x
Cividanes, L.S, Campos, T.M.B., Rodrigues, L.A., Brunelli, D.D., and Thim, G.P., 2010a, “Review of mullite synthesis routes by sol–gel method”, Journal of Sol-Gel Science and Technology, Vol. 55, No. 1, pp. 111-125. doi: 10.1007/s10971-010-2222-9
Cividanes, L.S, Campos, T.M.B., Bertran, C.A., Brunelli, D.D., and Thim, G.P., 2010b, “Effect of urea on the mullite crystallization”, Journal of Non-Crystalline Solids, Vol. 356, No. 52-54, pp. 3013-3018. doi: 10.1016/j.jnoncrysol.2010.05.076
Fischer, R.X., Schneider, H. and Voll, D., 1996, “Formation of Aluminum Rich 9:1 Mullite and its Transformation to Low Alumina Mullite upon Heating”, Journal of the European Ceramic Society, Vol. 16, No.2, pp. 109-113.
Gerardin, C., Sundaresan, S., Benziger, J., and Navrotsky, A., 1994, “Structural Investigation and Energetics of Mullite Formation from Sol-Gel Precursors”, Chemistry of Materials, Vol. 6, No. 2, pp 160-170. doi: 10.1021/cm00038a011
Hong, S.H. and Messing, G.L., 1998, “Anisotropic Grain Growth in Diphasic-Gel-Derived Titania-Doped Mullite”, Journal of the American Ceramic Society, Vol. 81, No. 5, pp. 1269-1277. doi: 10.1111/ j.1151-2916.1998.tb02478.x
Inoue, M., 2004, “Glycothermal synthesis of metal oxides”, Journal of Physics: Condensed Matter, Vol. 16, No. 14, pp. S1291-S1303. doi:10.1088/0953-8984/16/14/042
Langford, J., Louër, D. and Scardi, P., 2000, “Effect of a Crystallite Size Distribution on X-ray Diffraction Line Proiles and Whole-powder-pattern Fitting”, Journal of Applied Crystallography, Vol. 33, No. 2, pp. 964-974. doi: 10.1107/S002188980000460X
Le Bail, A., 2004, “Monte Carlo Indexing with McMaille”, Powder Diffraction, Vol. 19, No. 3, pp. 249-254. doi: 10.1154/1.1763152
Mazza, D., Ronchetti, S., and Costanzo, A., 2008, “Atomistic simulations on mullite Al2(Al2+2xSi2−2x)O10−x in a variable range of composition”, Journal of the European Ceramic Society, Vol. 28, No. 2, pp. 367-370. doi: 10.1016/j.jeurceramsoc.2007.03.003
McMahon, C.N., Alemany, L., Callender, R.L., Bott, S.G. and Barron, A.R., 1999, “Reaction of Al(tBu)
3 with Ethylene Glycol: Intermediates to Aluminum Alkoxide (Alucone) Preceramic Polymers”, Chemistry of Materials, Vol. 11, No. 11, pp. 3181-3188. doi: 10.1021/ cm990284q
Okada, K., 2008, “Activation Energy of Mullitization from Various Starting Materials”, Journal of the European Ceramic Society, Vol. 28, No. 2, pp. 377-382. doi: 10.1016/j.jeurceramsoc. 2007.03.015
Oliveira, T.C., Ribeiro, C.A., Brunelli, D.D., Rodrigues, L.A. and Thim, G.P., 2010, “The Kinetic of Mullite Crystallization: Effect of Water Content”, Journal of Non-Crystalline Solids, Vol. 356, No. 52-54, pp. 2980-2985. doi: 10.1016/j.jnoncrysol.2010.05.078
Richardson, J.W., Pluth, J.J., Smith, J.V. and Dytrych, W.J., 1988, “Conformation of Ethylene Glycol and Phase Change in Silica Sodalite”, The Journal of Physical Chemistry, Vol. 92, No. 1, pp. 243-247. doi: 10.1021/j100312a052
Rietveld, H.M., 1969, “A Proile Reinement Method for Nuclear and Magnetic Structures”, Journal of Applied Crystallography, Vol. 2, pp. 65-71. doi:10.1107/S0021889869006558
Shackelford, J.F. and Doremus, R.H., 2008, “Ceramic and Glass Materials”, Springer, New York, USA.
Schneider, H., Voll, D., Saruhan, B. and Schmücker, M., 1994, “Constitution of the γ-alumina Phase in Chemically Produced Mullite Precursors”, Journal of the European Ceramic Society, Vol. 13, No. 5, pp. 441-448. doi: 10.1016/0955-2219(94)90022-1
Schneider, H. and Komarneni, S., 2005, “Mullite”, Wiley-VCH, Weinheim, Germany.
Schneider, H., Schreuer, J. and Hildmann, B., 2008, “Structure and Properties of Mullite – A Review”, Journal of the European Ceramic Society, Vol. 28, No. 2, pp. 329-344. doi: 10.1016/j. jeurceramsoc.2007.03.017