*e-mail: [email protected]
Effect of Steatite Waste Additions on the Physical
and Mechanical Properties of Clay Composites
Túlio Hallak Panzeraa,*, Kurt Streckera, Luiddimar Geraldo de Oliveiraa,
Wander Luiz Vasconcelosb, Marco Antônio Schiavonc
a
Department of Mechanical Engineering, Federal University of São João del-Rei – UFSJ,
Campus Sto Antônio, Praça Frei Orlando 170, CEP 36307-352, São João del-Rei, MG, Brazil
b
Department of Metallurgical and Materials Engineering,
Federal University of Minas Gerais – UFMG, CEP 31270-901, Belo Horizonte, MG, Brazil
c
Department of Natural Sciences, Federal University of São João del-Rei - UFSJ,
Campus Sto Antônio, Praça Frei Orlando 170, CEP 36307-352, São João del-Rei, MG, Brazil
Received: September 22, 2010
Mineral rock wastes are being widely investigated due to possible damage to the environment when discarded indiscriminately in the nature, but also because of their great potential as ceramic raw materials. This work aims to study the effect of steatite particle additions on the mechanical properties of clay composites. A comprehensive series of experiments have been conducted to assess the influence of: steatite particle size, steatite fraction and compacting pressure on the performance of clay composites. The composite of superior properties was manufactured with 20 wt. (%) of steatite, 100-200 US-Tyler of steatite particle size and 30 MPa of compacting pressure.
Keywords: steatite, clay, composites, mechanical properties
1. Introduction
In recent years, the investigation of industrial wastes for use as alternative materials has been intensified across the world. The raw materials used in the traditional ceramic industry generally are constituted of plastic and non-plastic materials, of varied compositions, reason which allows the presence of many residual substances1.
The main industrial wastes used as dispersive phase in ceramic composites are commonly from: the mining2-6, the ceramic industry7, the steel mill8-9 and the energy industries10-11, besides other urban residues12 which can be incorporated after adequate treatment.
Mineral rock wastes are widely studied due to the great environmental impact when discarded indiscriminately in the nature and also to their huge potential as ceramic raw materials13.
The steatite mineral, commonly known as soapstone, is the name given to a metamorphic rock, basically composed of talc and many other minerals such as magnetite and silica14-15. Talc is a hydrated magnesium silicate, with the following chemical formulation: Mg3Si4O10(OH)2[16].
The effect of steatite additions in clay composites was investigated in this work. A full factorial Design of Experiment (DOE) was adopted in order to identify the main and the interaction effects of the factors compacting pressure, weight fraction and particle size of the steatite waste, on the responses, such as: linear shrinkage, apparent density, apparent porosity and flexural strength.
2. Materials and Methods
The ceramic composites were constituted of two phases, the clay matrix phase and the steatite waste powders used as dispersive phase.
2.1. Matrix phase: São Simão clay
A chemical analysis by X-ray fluorescence was conducted to characterize the São Simão clay. The results are shown in Table 1,
where a high percentage of silicon oxide (48.90%) and aluminium oxide (36.30%) were identified. The apparent density of 1.31 g.cm–3 was obtained by nitrogen gas picnometry technique.
2.2. Dispersive phase: steatite waste
The mineral wastes of steatite were collected in the city of Congonhas (Minas Gerais, Brazil). The powder of steatite was dried in an oven at 80 °C for 24 hours and classified by sieving in two particle size envelopes: 16-40 and 100-200 US-Tyler. Table 2 shows the chemical analysis of the steatite material obtained by X-ray fluorescence spectroscopy, identifying high contents of silicon oxide (44.73%) and magnesium oxide (29.28%), as expected for a magnesium silicate. The apparent density (0.76 g.cm–3) of steatite particles was determined by nitrogen gas picnometry technique.
2.3. Full factorial planning
The full factorial planning of type nk consists of investigating all possible combinations of the experimental factors (k) and its respective levels (n). The result of the factorial nk corresponds to the number of the experimental conditions existent in the experiment17-18.
The chosen responses in this experiment and their respective standards were: linear shrinkage19, apparent density20, apparent porosity21 and flexural strength22. Two qualitative experiments were performed for the microstructural analysis, that is, X-ray diffraction analysis (XRD) and backscatter scanning electron microscopy (SEM).
2.4. Manufacturing process
The material’s preparation and the procedures of curing followed the recommendations of the British Standard (BS12390-2)[23] in order to assure small variability in the manufacturing process. A randomization procedure was adopted to prepare and carry out the sample tests, allowing an arbitrary ordinance of the experimental conditions, preventing that non-controlled factors affected the responses17-18.
A prismatic steel die was used to manufacture the specimens. The ceramic powder was mixed using a constant water percentage of 6 wt. (%). The ceramic material was leaked and compacted under two pressure levels, 10 and 30 MPa, during 30 seconds. The composites were subsequently sintered with a heating rate of 3 °C/min up to the temperature of 1200 °C followed by 40 minutes of isothermal sintering. The dimensions of the prismatic green samples were: 20.5 × 5 × 70.6 mm.
Six specimens were manufactured for each experimental condition. Taking into account 12 experimental conditions and 2 replicates, 144 specimens were prepared. The replicate consists of a repetition of the experimental condition in order to provide an estimate of the magnitude of the experimental error against which the differences among the treatments are judged. The extension of this error is important to decide whether significant effects exist or can be attributed to the action of factors17-18.
3. Experimental Results
Table 4 exhibits the P-values of the Analysis of Variance (ANOVA) for the mean of the responses. The P-values indicate which of the effects in the system are statistically significant, based on the examination of the experimental data from replicate 1 and replicate 2. If the P-value is less than or equal to 0.05 the effect is considered to be significant. A α-level of 0.05 is the level of significance which implies that there is 95% probability of the effect being significant. The results will be presented via ‘main effect’ and ‘interaction’ plots. These graphic plots cannot be considered typical ‘scatter’ plots, but serve to illustrate the statistical analysis and provide the variation on the significant effects. The main effect of a factor only must be interpreted individually if there is no evidence that it does not interact with other factors. When one or more interaction effect of superior order is significant, the factors that interact must be considered jointly17-18.
The ‘main effects’ plot is most useful when several factors such as particle size, weight fraction and compacting pressure affect the composite property. These plots are used to compare the changes in the mean level to examine which of the processing factors influences the response (e.g. apparent density) the most. A ‘main effect’ is present when different levels of a factor affect the response differently.
An ‘interaction’ is present when the change in the mean response of the composite (e.g. apparent density) from a low to high level of a factor (e.g. particle size) depends on the level of a second factor (e.g. weight fraction)17. Interactions plots are used to visualize the interaction effect of two or more factors (e.g. size and geometry; size and pressure; geometry and pressure; size, geometry and pressure) on the response and to compare the relative strength of the effects.
The value of ‘R2 adjust’ shown in the ANOVA analysis indicates how well the model predicts responses for new observations. Larger values of adjusted R2(adj) suggest models of greater predictive ability17-18. Table 4 shows the values of R2(adj) for the responses. A variation from 85.70 to 95.10% can be observed, which demonstrate the quality of adjustment of the models being satisfactory.
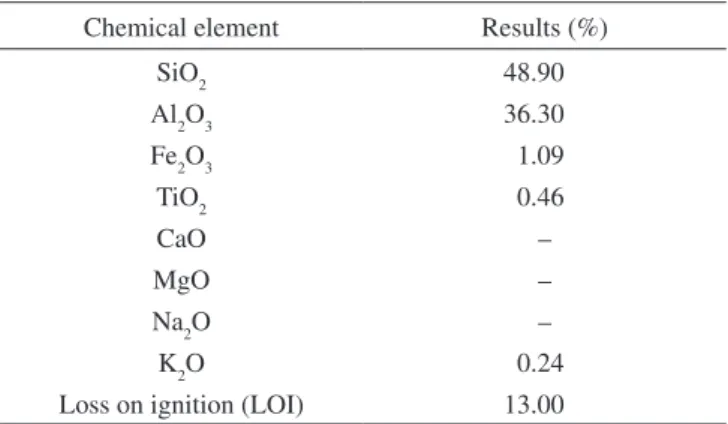
The ‘residuals plots’ can be useful for comparing the plots to determine whether your model meets the assumptions of the analysis. Table 1. Chemical analysis of São Simão clay.
Chemical element Results (%)
SiO2 48.90
Al2O3 36.30
Fe2O3 1.09
TiO2 0.46
CaO –
MgO –
Na2O –
K2O 0.24
Loss on ignition (LOI) 13.00
Table 2. Chemical analysis of steatite.
Chemical element Results (%)
SiO2 44.73
Al2O3 3.70
Fe2O3 8.38
TiO2 < 0.001
CaO 2.95
MgO 29.28
NaO2 <0.001
K2O <0.001
MnO 0.13
P2O5 0.01
Loss of ignition (LOI) 10.34
Table 3. Planning matrix.
Particle size (US-Tyler) Fraction of steatite (%) Pressure of compaction (MPa)
C1 16-40 5 10
C2 16-40 5 30
C3 100-200 5 10
C4 100-200 5 30
C5 16-40 20 10
C6 16-40 20 30
C7 100-200 20 10
C8 100-200 20 30
C9 16-40 40 10
C10 16-40 40 30
C11 100-200 40 10
C12 100-200 40 30
levels which were investigated in this work, establishing a factorial planning matrix of type 312121 that provide 12 distinct experimental combinations.
Table 4. Analysis of variance (P-values).
Experimental factors Linear shrinkage
(%)
Apparent porosity (%)
Apparent density (g.cm–3)
Flexural strength (MPa)
Main effects
Fraction of steatite 0.000 0.428 0.040 0.000
Particle size 0.951 0.135 0.878 0.000
Compaction 0.247 0.000 0.000 0.000
Interaction effects
Fraction of steatite * Particle size 0.098 0.066 0.351 0.000
Fraction of steatite * Compaction 0.017 0.004 0.063 0.004
Particle size * Compaction 0.525 0.641 0.098 0.420
Fraction of steatite * Particle size * Compaction 0.872 0.742 0.261 0.474
R2 (adjust) % 85.70 90.68 85.78 95.10
The normal probability plot indicates whether the data are normally distributed, other variables are influencing the response, or outliers exist in the data. The residuals for all responses investigated in this work are normally distributed following a straight line, validating the ANOVA analysis.
3.1. X-ray diffraction (XRD)
The X-ray diffraction (XRD) patterns were collected with powder samples with a diffractometer (Shimadzu, model XRD-6000) operating at 40 kV and 30 mA, with a CuKα radiation (λ = 0.15418 nm) as incident beam. Figure 1 exhibits the XRD results for the samples C2, C3, C4, C8, C11 and C12.
The XRD patterns of the sample set are displayed in Figure 1 with the corresponding assignments, according to the Joint Committee on Powder Diffraction Standards - JCPDS. The peaks in sample C2 were attributed to quartz and mullite crystalline phases. In sample C3, besides these crystalline phases, the crystallization of cristobalite started, as observed by the appearance of a peak at ~21.9o (2θ). The composites C2, C3 and C4 were manufactured with 5% of steatite particles, but with different levels of particle sizes and compaction pressures.
For the following samples a decrease in the relative intensity of the peaks assigned to quartz can be observed and also an increase in the relative intensity of mullite and cristobalite peaks. This behaviour implies that not only the particle size of steatite, but also the compaction pressure affects the formation of mullite and cristobalite phases.
In addition, in the samples C11 and C12 cordierite (2MgO.2Al2O3) has been detected, due to the higher steatite content used. Apparently, cordierite is formed by the reaction of mullite (3Al2O3.SiO2) and steatite (3MgO.4SiO2.H20). The higher cordierite content observed in sample C12 in comparison to sample C11, both prepared with 40 wt. (%) of steatite is attributed to the higher compaction pressure applied in sample C12, which increases the contact points between particles and thus accelerates the cordierite phase formation.
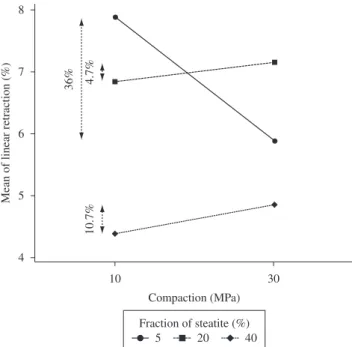
3.2. Linear shrinkage
The linear shrinkage of the clay composites varied from 3.52 to 8.48%. The interaction of the factors ‘fraction of steatite and compaction’ affected the linear shrinkage response exhibiting a P-value less than 0.05 (Table 4). It is possible to observe in Figure 2 the steatite fractions of 20 and 40% provided a reduction of the linear shrinkage of the composites. The presence of magnesium oxide (MgO) in the steatite particles increases the thermal shock resistance and diminishes the sintering shrinkage24. An increase of the compacting pressure tends to reduce the existing spaces between particles. The enhancement of the particle packing provides the
reduction of the atomic diffusion distances, consequently, increasing the linear shrinkage due to liquid phase formation. This phenomenon is more evident when a significant percentage of steatite (20 and 40%) is added.
The linear shrinkage of the composites manufactured with 5% of steatite diminished with the increase of the compacting pressure. This behaviour can be explained by the large particle packing factor obtained in the system, as well as the assumption that the samples have already been close to the final density of the sintered material.
3.3. Apparent porosity
The apparent porosity varied from 24.86 to 43.45%. The interaction of second order factors, ‘fraction of steatite and compaction’, presented a significant effect on the apparent porosity, exhibiting a P-value of 0.004 (Table 4).
Figure 4. Main effect plots for apparent density, fraction of steatite and the compaction.
Figure 5. Interaction effect plot for flexural strength, fraction of steatite and particle size.
Figure 2. Interaction effect plot for linear shrinkage, fraction of steatite and compaction.
Figure 3. Interaction effect plot for apparent porosity, fraction of steatite and compaction.
shrinkage, but also the diminishing of the apparent porosity. Studies, carried out by Bajza25, showed that an increase in the compacting pressure can be the main reason for the density increase, diminishing the pore diameters and consequently providing high strength of ceramic products.
3.4. Apparent density
The apparent density for the composites varied from 1.59 to 2.08 g.cm–3. The main factors “fraction of steatite” and “pressure of compaction” showed significant effects exhibiting P-values less than 0.05 (Table 4).
Figure 4a and 4b shows the main effects of the factors ‘fraction of steatite’ and ‘compaction’ on apparent density, respectively. The change of the fraction levels from 5 to 20% represents a percentage increase of 4.6% on the apparent density (Figure 4a). On the other hand, the addition of 40% of steatite did not provide the same behaviour, which can be explained by the presence of cordierite phase in the materials microstructure. Figure 4b shows that the increase of the compacting pressure provides an increase of the apparent density of the composites. The particle packing factor is enhanced with the increase of pressure, consequently increasing the density of the composites.
3.5. Flexural strength
Figure 6. Interaction effect plot for flexural strength, fraction of steatite and compaction.
The interaction effect plot exhibited in Figure 5 shows that the smaller particles of steatite (100/200 US-Tyler) provided a percentage increase on the flexural strength of 28.26 and 60.47% for the steatite fractions of 20 and 40%, respectively. However, the same behaviour is not observed for the composite with 5% of steatite, showing a percentage reduction of 5.21% when the particle size level is 100-200 US-Tyler. Based on the XRD results, the addition of fine particles of steatite into clay composites contributed to the formation of crystalline phases, i.e, quartz, mullite, cristobalite and cordierite. This behaviour can be attributed to the major particle packing capacity and sintering of grains of smaller diameters, enhancing the mechanical strength of the composites.
The interaction effect plot of Figure 6 exhibits the effect of compacting pressure on the flexural strength response. The strength of the composites is increased when the compacting pressure levels change from 10 to 30 MPa. As it was observed in Figure 5, the addition of steatite particles provided an improvement of the mechanical strength of the composites. The steatite fraction of 20% compacted with 30 MPa exhibited a superior strength. This behaviour is in accordance to the apparent porosity (Figure 3) and density (Figure 4a) results, where the composite manufactured with 20% of steatite showed lower porosity and higher density.
3.6. Microstructure
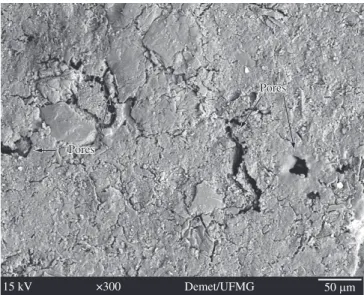
Backscatter-mode scanning electron microscopy (SEM) was used for examination of the composites C3 and C11 which correspond to the materials manufactured with 100-200 US-Tyler particle size, 10 MPa of pressure and 5 and 40% of steatite fraction respectively. Figure 7 and 8 exhibit the images of the composites C3 and C11, respectively. It is possible to observe that the microstructure of the composite C3 presents a smaller pore size than C11. The increase of the steatite fraction with low pressure of compaction (10 MPa) can be the main factor responsible for the increase of the apparent porosity as shown in Figure 3, beyond the decrease of the flexural strength shown in Figure 6.
On the other hand, Figure 9 shows the microstructure of C4 composite, manufactured with 100-200 US-Tyler particle size, 30 MPa of pressure and 5% of steatite fraction, exhibiting smaller pore sizes compared to C3 and C11, which explains the effect of pressure on the porosity and the mechanical strength of the composites.
Figure 7. Composite C3, backscatter-mode scanning electron microscopy image.
4. Conclusion
The addition of steatite in clay composites revealed promising effects on the mechanical properties. The pressure of compaction of 30 MPa provided an increase of the linear shrinkage, the apparent density, the apparent porosity and the strength of the composites. The presence of magnesium oxide in the steatite increases the thermal shock resistance and diminishes the sintering shrinkage. The steatite particle size distribution of 100-200 US-Tyler affected the flexural strength providing a significant increase of the composite’s strength when manufactured with 20 and 40% of steatite which was attributed to the crystalline phases formed, mainly cordierite. The steatite fraction of 20% exhibited superior results of density, porosity and mechanical strength. Finally, in this experiment, the clay based composite of superior properties is that one manufactured with 20% of steatite, 100-200 US-Tyler of particle size and 30 MPa of compacting pressure.
Acknowledgments
The authors would like to express their gratitude to the financial support received by FAPEMIG under grant no. CEX 00221/06 and PIBIC.
Reference
1. Modesto C, Bristot V, Menegali G, Brida M, Mazzuco M, Mazon A et al. Obtenção e caracterização de materiais cerâmicos a partir de resíduos sólidos industriais. Cerâmica Industrial. 2003; 8:14-18.
2. Acchar W, Ramalho EG, Fonseca YA, Hotza D and Segadaes AM. Using granite rejects to aid densification and improve mechanical properties of alumina bodies. Jounal of Materials Science. 2005; 40:3905-3909.
3. Acchar W, Vieira FA and Segadaes AM. Using ornamental stone citting rejects as raw materials for red clay ceramic products: properties and microstructure development. Materials Science and Engineering. 2006; 606-610.
4. Menezes RR, Ferreira HS, Neves AG, Lira HL and Ferreira HC. Use of granite sawing wastes in the production of ceramic bricks and tiles.
Journal of the European Ceramic Society. 2005; 25:1149-1158.
5. Monteiro SN, Pecanha LA and Vieira CMF. Reformulation of roofing tiles body with addition of granite waste from sawing operations. Journal of the European Ceramic Society. 2004; 24:2349-2356.
6. Yalcin N and Sevinc V. Utilization of bauxite waste in ceramic glazes.
Ceramics International. 2000; 26:485-493.
7. Pereira FR, Hotza D, Segadaes AM and Labrincha JA. Ceramic formulations prepared with industrial wastes and natural sub-products.
Ceramics International. 2006; 32:173-179.
8. Domingues EA and Ullman R. Ecological bricks made with clays and steel dust pollutants. Applied Clay Science. 1996; 11:237-249.
9. Malhotra SK and Dave NG. Investigations into the effect of addition of flyash and burnt clay pozzolana on certain engineering properties of cement composites. Cement and Concrete Composites. 1999; 21:285-291.
10. Monteiro SN, Silva FAN and Vieira CMF. Microstructural evaluation of a clay ceramic incorporated with petroleum waste. Applied Clay Science.
2006; 33:171-180.
11. Monteiro SN and Vieira CMF. Effect of oily waste addition to clay ceramic. Ceramics International. 2005; 31:353-358.
12. Rim KA, Ledhem A, Douzane O and Dheilly Queneudec RMM. Influence of the proportion of wood on the thermal and mechanical performances of clay-cement-wood composites. Cement and Concrete Composites.
1999; 21:269-276.
13. Dondi M, Marsigli M and Fabbri B. Recycling of industrial and urban wastes in brick production: a review (Part 2). Tile & Brick International.
1997; 13:302-309.
14. Mielcarek W, Wozny DN and Prociow K. Correlation between MgSiO3 phases and mechanical durability of steatite ceramics. Journal of the European Ceramic Society. 2004; 24:3817-3821.
15. White JS. Particle-size distribution of steatite talc. Journal of the American Ceramic Society. 1944; 27:320-323.
16. Amaral LF, Salomão R, Frollini E and Pandolfelli VC. Mechanisms of magnesium oxide hydration. Cerâmica. 2007; 53:368-372.
17. Werkema MCC and Aguiar S. Planejamento e análise de experimentos: como identificar e avaliar as principais variáveis influentes em um processo. Belo Horizonte: Fundação Christiano Ottoni, Escola de Engenharia da UFMG; 1996.
18. Montgomery DC. Introduction to statistical quality control. New York: John Wiley & Sons; 1997.
19. ASTM. ASTM C326–03. Standard Test Method for Drying and Firing Shrinkages of Ceramic Whiteware Clays; 1996.
20. BRITISH STANDARD. BS 1881-114, Testing concrete, Methods for determination of density of hardened concrete; 1983.
21. BRITISH STANDARD. BS 10545-3, Determination of water absorption, apparent porosity, apparent relative density and bulk density; 1997.
22. BRITISH STANDARD. BS EN 658-3, Advanced technical ceramics. Mechanical properties of ceramic composites at room temperature, Determination of flexural strength. 2002.
23. BRITISH STANDARD. BS EN 12390-2, Testing hardened concrete, Making and curing specimens for strength tests. 2000.
24. Reed JS. Principles of ceramic processing. New York: John Wiley & Sons; 1994.