Abstract
Objective: To compare the growth of Brazilian children and adolescents with reference growth charts.
Methods: School-based cross-sectional study involving 41,654 students (23,328 boys and 18,326 girls) aged 7 to 17 years. Physical growth variables (body weight, height) and body mass index (BMI) were measured. Height, 50th percentile, and BMI, 85th percentile, were compared with the World Health Organization (WHO) reference values, and weight, 50th percentile, was compared with the Centers for Disease Control and Prevention (CDC) growth charts.
Results: Mean height and body weight of Brazilian schoolchildren were generally higher than the WHO and CDC reference values for both genders at most ages. BMI values of Brazilian schoolchildren were signiicantly lower than the WHO obesity values at all ages.
Conclusion: The growth in body weight, height, and BMI of children and adolescents in the urban area of Brazil is increasingly similar to those reported in developed countries. Further prospective studies should be conducted in Brazil comparing their results with the international growth charts to enable more accurate inferences.
J Pediatr (Rio J). 2010;86(2):115-120: Growth, anthropometry, child health, adolescent health, cross-sectional studies.
O
RiginAlA
RtiCleCopyright © 2010 by Sociedade Brasileira de Pediatria
115 introduction
Physical growth has been traditionally monitored by means of anthropometric measures of body weight and height that are internationally accepted for this purpose.1 Based on these measures, health agencies, such as the Center for Disease Control and Prevention (CDC)2 have designed standard physical growth curves that have been used for many years as reference values in several countries. Even though some countries (Italy,3 Saudi Arabia,4 Iran,5 Turkey,6 India,7 and Greece8) have designed their own growth charts, they also compare their data with the CDC reference values.
Some critics have been made regarding the CDC growth charts. For instance, the controversial aspects are related to the fact that the sample comprises only U.S. individuals and that the growth charts underestimate the physical growth of healthy children.9 In that sense, the World Health Organization (WHO) has developed a set of growth charts10 designed based on a study conducted on four continents taking into consideration ethnic diversity, similar life conditions of the children assessed in different countries, same sample design, and epidemiological and statistical methods to guarantee control and quality of the charts.
Comparison between the growth of Brazilian children
and adolescents and the reference growth charts:
data from a Brazilian project
Diego Augusto Santos Silva,1 Andreia Pelegrini,2 edio luiz Petroski,3 Adroaldo Cesar Araujo gaya4
1. Professor, Educação Física, Programa de Pós-Graduação em Educação Física, Núcleo de Pesquisa em Cineantropometria e Desempenho Humano (NuCIDH), Universidade Federal de Santa Catarina (UFSC), Florianópolis, SC, Brazil. Bolsista CAPES.
2. Mestre, Educação Física, Programa de Pós-Graduação em Educação Física, NuCIDH, UFSC, Florianópolis, SC, Brazil. Bolsista CAPES. 3. Doutor, Educação Física, Programa de Pós-Graduação em Educação Física, NuCIDH, UFSC, Florianópolis, SC, Brazil.
4. Doutor, Educação Física, Universidade Federal do Rio Grande do Sul (UFRGS), Porto Alegre, RS, Brazil. Coordenador, Projeto Esporte Brasil.
Financial support: Ministry of Sports/Project Sports Brazil (Projeto Esporte Brasil).
No conflicts of interest declared concerning the publication of this article.
Suggested citation: Silva DA, Pelegrini A, Petroski EL, Gaya AC. Comparison between the growth of Brazilian children and adolescents and the reference growth charts: data from a Brazilian project. J Pediatr (Rio J). 2010;86(2):115-120.
Manuscript submitted Aug 20 2009, accepted for publication Dec 4 2009.
In Brazil, there have been initiatives aimed at designing a growth chart.11,12 One of them was conducted in the state of São Paulo11 and another one was carried out by the National Institute of Nutrition (Instituto Nacional de Nutrição).12 The irst growth chart was published in 1982 and the second one in 1990 and both of them need to be revised due to the effect of the secular tendency on growth.13 In addition to these initiatives, isolated studies conducted in different regions and municipalities have been developed.14-16
For some time, the CDC growth charts were used as reference values in Brazil2; however, after the publication of the WHO values,10 the Ministry of Health recommended the use of these growth charts in the country. Few comparative studies involving Brazilian samples and using the recent WHO growth charts have been conducted.16 Some investigations compared CDC data.14,15 Nevertheless, such surveys were conducted with isolated populations due to the dificulty of selecting a sample from the several Brazilian regions.
Thus, the objective of the present study is to compare the growth of Brazilian children and adolescents with the CDC and WHO reference values for physical growth.
Methods
Data for this school-based cross-sectional study were collected from the Project Sports Brazil (Projeto Esporte Brasil, PROESP-BR), a permanent source of indicators of growth, development and nutritional status of Brazilian children and adolescents from 7 to 17 years old, whose main objective is to deine the somatomotor proile, habits and motor skill factors of children and adolescents with the purpose of collecting indicators to support policies of Physical Education and Sports for children and youths in Brazil.
The PROESP-BR is part of a set of projects undertaken by the network of Centers of Sports Excellence (Centros de Excelência Esportiva, CENESP), linked to the Department of Sports Excellence and Events Promotion of the National Department of High Performance Sports of the Ministry of Sports. Detailed information on the design and methodological aspects of the PROESP-BR has been published elsewhere.17 The project was approved by the Research Ethics Committee of Universidade Federal de Santa Catarina (UFSC), Florianópolis, state of Santa Catarina, Brazil (Substantiated Report - 218/08).
The population of the present study comprised students aged between 7 and 17 years enrolled in public and private schools located in the ive Brazilian regions (North, Northeast, Central West, Southeast, and South). The sample was selected using a non-probabilistic and intentional method. Information about the PROESP-BR was disclosed at schools and the Physical Education teachers who chose to participate in the study assessed students and sent data to the project coordination.
Between 2004 and 2005, information regarding students from 23 Brazilian states and the Federal District were entered into the PROESP-BR database. Data were collected from three states of the Central West region [Goiás (n = 1,835), Mato Grosso (n = 1,438), and Mato Grosso do Sul (n = 1,023)] and the Federal District (n = 2,473), from eight states of the Northeast region [Alagoas (n = 401), Bahia (n = 984), Maranhão (n = 655), Paraíba (n = 226), Pernambuco (n = 1,300), Piauí (n = 1,034), Rio Grande do Norte (n = 905), and Sergipe (n = 280)], from ive states of the North region [Amazonas (n = 492), Amapá (n = 1,094), Pará (n = 1,141), Rondônia (n = 353), and Tocantins (n = 791)], from four states of the Southeast region [Espírito Santo (n = 371), Minas Gerais (n = 2,526), Rio de Janeiro (n = 4,361), and São Paulo (n = 7,507)], and from three states of the South region [Paraná (n = 1,540), Santa Catarina (n = 91) e Rio Grande do Sul (n = 8,833). Among the students assessed, 97.1% were enrolled in schools located in the urban areas of the municipalities.
Anthropometric data (height and body weight) were collected by the Physical Education teachers of each school that participated in the PROESP-BR. All teachers were trained and were aware of the instructions regarding the administration of the tests and collection of measures by means of a website that included a video for standardization purposes and to provide better visual presentation of the techniques of measure collection,17 developed by members of the staff of the School of Physical Education of Universidade Federal do Rio Grande do Sul (UFRGS), Porto Alegre, state of Rio Grande do Sul, Brazil.
Body weight was measured using a digital anthropometric scale graduated from 0 to 150 kg, with resolution of 0.05 kg, and height was measured using a wall-mounted portable stadiometer graduated from 0 to 200 cm, with a graduation of 0.2 cm.17 Body mass index (BMI) was calculated using the body weight in kg divided by the height in m2.
The means of the physical growth variables of the present study were compared with the WHO reference values for height and BMI10 and with the CDC reference values for body weight.2 This was done because the WHO does not provide data regarding the body weight of adolescents and, in that sense, the CDC curves are the most recent reference values for this variable. We considered the 50th percentile (P-50) as the reference value for body weight and height of the growth charts, as it has been recommended in other studies.3-4,15 With regard to BMI, the WHO reference values were the 85th percentile (P-85), since youths with BMI above these values are classiied as being overweight.10
Height (cm) Body weight (kg) BMi (kg/m2)
Age (years) Female Male Female Male Female Male
7 125.6±6.9 127.7±6.9* 27.0±5.6 27.5±5.5 17.0±2.9 16.8±2.4
8 131.0±8.2 131.6±7.5 30.1±7.3 30.0±7.4 17.4±3.1 17.2±3.4
9 137.7±6.8 137.4±7.7 32.0±7.1 33.4±8.1* 17.0±3.1 17.6±3.4*
10 142.4±7.5* 141.3±7.3 35.4±8.1* 34.3±8.0 17.4±3.1* 17.1±3.2
11 148.8±7.8* 146.1±7.7 40.0±9.0* 38.9±9.3 18.0±3.2 17.9±3.1
12 154.3±7.3* 152.1±8.8 45.0±9.4* 42.5±10.4 18.9±3.3* 18.1±3.2
13 157.7±6.8 158.9±9.4* 48.2±9.0 47.8±11.4 19.4±3.2* 18.8±3.2
14 160.3±6.6 165.6±9.0* 51.2±8.2 53.6±11.5* 20.0±3.0* 19.4±3.1
15 160.7±6.7 169.7±8.3* 53.1±8.6 57.7±11.6* 20.6±3.1* 19.9±3.1
16 163.6±9.6 173.4±8.1* 57.7±11.4 63.1±10.7* 21.4±3.1* 20.9±2.9
17 162.5±6.5 174.2±7.0* 57.1±9.1 66.1±11.2* 21.6±3.1 21.7±3.2
table 1 - Descriptive values for height, body weight, and BMI of Brazilian children and adolescents – Project Sports Brazil (Brazil, 2004-2005)
BMI = body mass index.
* p < 0.05, difference between sexes at the same age.
test was used to check the differences between the age groups. Student’s t test for one sample was used to compare the mean values of each growth variable with the CDC and WHO reference values. For all analyses, the signiicance level was set at 5%.
Results
Our sample comprised 41,654 students aged from 7 to 17 years. Their mean age was 12.24±1.98 years old, and 44% of them were girls and 56% were boys. Regarding the distribution according to sex, the female sample was 15.4, 11.0, 11.8, 33.8, and 28%, and the male sample was 17.0, 12.2, 11.2, 36.7, and 22.9% for the Central West, Northeast, North, Southeast, and South regions, respectively.
Table 1 shows the mean and standard deviation values for height, body weight, and BMI of Brazilian children and adolescents. When we compared sexes in terms of height, we found statistically higher values for males at ages 7, 13, 14, 15, 16, and 17 years old, and for females at ages 10, 11, and 12 years old. In terms of body weight, from 10 to 12 years old, the female individuals had higher values than the males, and for the 14-year old or older participants this trend was inverted. BMI was different for those aged 10, 12, 13, 14, 15 and 16 years. The females at these ages had higher BMI values than the males.
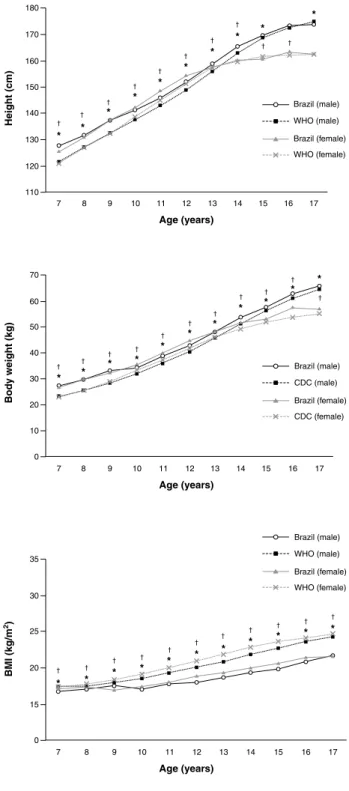
Figure 1 shows, respectively, the comparison between height, body weight, and BMI of the children and adolescents who participated in the present study and the reference values analyzed. Brazilian youths had, at most ages, higher
values than the WHO reference values for height and the CDC values for body weight (p ≤ 0.05). BMI was different at all ages and in both sexes, and the WHO reference values were higher than those found in the present study (p ≤ 0.05).
Discussion
The present school-based study is the irst study conducted in Brazil involving a sample of students from the ive Brazilian regions. Its objective was to compare the growth of Brazilian students with international reference values for physical growth.2,10 We believe that the fact that the sample included children and adolescents who were currently attending school does not impair its capacity of analysis of Brazilian youths in general. Therefore, the present study may be a useful comparative parameter for future investigations because the sample included individuals from the ive different regions.
BMI = body mass index; CDC = Centers for Disease Control and Prevention; WHO = World Health Organization.
* p < 0.05 = comparing the values of the males of the present study with the reference growth charts.
† p < 0.05 = comparing the values of the females of the present study
with the reference growth charts.
Figure 1 - Comparison of the height, body weight, and BMI of Brazilian students with the reference growth charts of the WHO and CDC
CDC data2 regarding the U.S. population demonstrated that females had higher height values than males around 11-12 years old, and that 2 years later this trend is inverted.
When body weight was compared between sexes, the investigators found that female students from 10 to 12 years old were heavier than the male ones, with an inversion of this process taking place when the adolescents turned 14 years old. These differences are explained by Riggs et al.18 and Wells,19 and they are related to the hormonal inluences that affect females earlier than males, since estrogen (female sexual hormone) causes pelvic widening, breast development, and increased fat deposition, mainly in the thighs and in the hip region, resulting in increased body weight. On the other hand, testosterone (male sexual hormone) starts to intensely affect males at a later age than estrogen affects females, and it increases bone formation and protein synthesis, causing higher height and more muscle mass.
The survey conducted by the WHO,10 involving youths with high socioeconomic status from Brazil, Ghana, India, Norway, Oman, and the USA, found similar results to those of the present study when comparing body weight according to sex. In Italy, a study that established growth charts for children and adolescents3 demonstrated that the body weight values of females were higher than those of males after 11 years old and that after the adolescents turned 13 years old this trend was inverted. Therefore, it may be suggested that the magnitude of the body weight growth of children and adolescents of the Brazilian urban area is increasingly similar to that reported in developed countries, which was not true 2 or 3 decades ago.11,12
After comparing the height and body weight values of both sexes with the WHO and CDC reference values, we found that Brazilian youths reached and surpassed the reference values at most ages. Epidemiological studies conducted in Italy,3 Iran,5 and India7 also found that for most ages the reference values were lower. On the other hand, studies conducted in Saudi Arabia4 and Turkey6 indings were lower than the reference values. In a study conducted with Brazilian-native Suruí, Xavánte and Wari children16 in the Brazilian Amazon, the authors found that this population has lower height for age when compared with the WHO physical growth charts.
Such indings evidence that, in addition to the genetic factors that are inherent to each ethnic group, different economic conditions of the country and population investigated have an inluence on the physical growth of children and adolescents, since they are a direct relect of nutritional, environmental, and maturational factors connected to growth.1,13
References
1. World Health Organization. Physical status: the use and interpretation of anthropometry. Report of a WHO Expert Committee. World Heatlh Organ Tech Rep Ser. 1995;854:1-452.
2. Kuczmarski RJ, Ogden CL, Grummer-Strawn LM, Flegal KM, Guo SS, Wei R, et al. CDC growth charts: United States. Adv Data. 2000;(314):1-27.
3. Cacciari E, Milani S, Balsamo A, Dammacco F, De Luca F, Chiarelli F, et al. Italian cross-sectional growth charts for height, weight and BMI (6-20 y). Eur J Clin Nutr. 2002;56:171-80.
4. El Mouzan MI, Al Herbish AS, Al Salloum AA, Foster PJ, Al Omar AA, Qurachi MM, et al. Comparison of the 2005 growth charts for Saudi children and adolescents to the 2000 CDC growth charts. Ann Saudi Med. 2008;28:334-40. Erratum in: Ann Saudi Med. 2008;28:474.
5. Mahyar A, Asefzadeh S. Comparison of weight, height and BMI of Iranian girl students with NCHS standard. NCD Malaysia. 2005;4:11-15.
6. Neyzi O, Furman A, Bundak R, Gunoz H, Darendeliler F, Bas F. Growth references for Turkish children aged 6 to 18 years. Acta Paediatr. 2006;95:1635-41. Erratum in: Acta Paediatr. 2007;96:324.
7. Sharma A, Sharma K, Mathur KP. Growth pattern and prevalence
of obesity in afluent schoolchildren of Delhi.Public Health Nutr. 2007;10:485-91.
8. Papadimitriou A. Sex differences in the secular changes in pubertal maturation. Pediatrics. 2001;108:E65.
9. de Onis M, Garza C, Onyango AW, Borghi E. Comparison of the WHO child growth standards and the CDC 2000 growth charts. J Nutr. 2007;137:144-8.
10. WHO Multicentre Growth Reference Study Group. WHO Child Growth Standards: length/height-for-age, for-age, weight-for-length, weight-for- height and body mass index-for-age: methods and development. Geneva: WHO; 2006.
11. Marques RM, Marcondes E, Bequó E, Hegg R, Colli AS, Zacchi MA. Crescimento e desenvolvimento pubertário em crianças e adolescentes brasileiros II: altura e peso. São Paulo: Editora Brasileira de Ciências; 1982.
12. Brasil – Ministério da Saúde – Instituto Nacional de Alimentação e Nutrição. Peril de crescimento da população brasileira de 0 a 25 anos: pesquisa nacional sobre saúde e nutrição. Brasília: Ministério da Saúde; 1990.
13. Malina RM, Bouchard C, Beunen G. Human growth: selected aspects of current research on well-nourished children. Ann Rev Anthropol. 1988;17:187-219.
14. Diniz IM, Lopes AS, Dummel CC, Rieger T. Crescimento físico e adiposidade corporal de escolares. Rev Bras Cineantropom Desempenho Hum. 2006;8:32-8.
15. Petroski EL, Silva RJ, Pelegrini A. Crescimento físico e estado nutricional de crianças e adolescentes da região de Cotinguiba, Sergipe. Rev Paul Pediatr. 2008;26:206-11.
16. Orellana JD, Santos RV, Coimbra Jr CE, Leite MS. Anthropometric evaluation of indigenous Brazilian children under 60 months of age using NCHS/1977 and WHO/2005 growth curves. J Pediatr (Rio J). 2009;85:117-21.
17. Gaya AC, Silva G. Manual de aplicação de medidas e testes, normas e critérios de avaliação. Porto Alegre: PROESP; 2007. http://www. proesp.ufrgs.br/institucional/index.php. Access: 18/04/2008. 18. Riggs BL, Khosla S, Melton LJ 3rd. Sex steroids and the construction
and conservation of the adult skeleton. Endocr Rev. 2002;23:279-302. Review.
19. Wells JC. Sexual dimorphism of body composition. Best Pract Res Clin Endocrinol Metab. 2007;21:415-30. Review.
20. Kac G, Velásquez-Meléndez G. A transição nutricional e a epidemiologia da obesidade na América Latina. Cad Saude Publica. 2003;19:4-5.
21. Wang Y, Monteiro C, Popkin BM. Trends of obesity and underweight in older children and adolescents in the United States, Brazil, China, and Russia. Am J Clin Nutr. 2002;75:971-7.
22. Guimarães LV, Barros MB, Martins MS, Duarte EC. Fatores associados ao sobrepeso em escolares. Rev Nutr. 2006;19:5-17.
23. Oliveira AM, Cerqueira EM, Souza JS, Oliveira AC. Sobrepeso e obesidade infantil: inluência de fatores biológicos e ambientais em Feira de Santana, BA. Arq Bras Endocrinol Metab. 2003;47:144-50.
BMI values of Brazilian children and adolescents were lower than those of the WHO growth charts (P-85) at all ages. Although this inding seems to be positive, some studies conducted in Brazil have demonstrated that the country is going through a process called “nutritional transition”, which is characterized by an inversion in the patterns of distribution of nutritional problems of a given population throughout time, usually consisting of a change from malnutrition to overweight and obesity.20
Comparing the data of the National Study on Family Expense (Estudo Nacional da Despesa Familiar - ENDEF), conducted in 1974 and 1975, with data of the Survey on Life Standards (Pesquisa sobre Padrões de Vida - PPV), conducted in 1996 and 1996, only in the Southeast and Northeast regions of Brazil, we found an increase in the prevalence of overweight from 4.1 to 13.9% in children and adolescents from 6 to 18 years old.21 More recent studies conducted in different municipalities revealed that the prevalence of overweight ranged from 8.4 to 19.0% and obesity ranged from 3.1 to 18%.22-25 Such evidence may serve as a warning for the Brazilian governmental agencies that need to plan eficient policies to ight overweight and obesity because within a few years Brazilian children and adolescents might reach the WHO reference values, which are associated with disorders and health risks.10,22
The present study has some limitations, such as the cross-sectional design, which does not allow to follow up the variables throughout time in the same group, and the selection of the sample, which was established using a non-probabilistic method, including only the schools that decided to participate in the project. However, our study provides important and up-to-date information on comparison of Brazilian children and adolescents with the physical growth chart internationally used, which may be used as a comparative parameter for investigations in different Brazilian regions.
Based on our indings, we concluded that these values for height and body weight of Brazilian children and adolescents reach the reference pattern of the WHO and CDC, respectively. With regard to BMI, the WHO reference values were higher at all ages analyzed.
24. Soar C, Vasconcelos FA, Assis MA, Grosseman S, Luna ME. Prevalência de sobrepeso e obesidade em escolares de uma escola pública de Florianópolis, Santa Catarina. Rev Bras Saúde Mater Infant. 2004;4:391-7.
25. Costa RF, Cintra IP, Fisberg M. Prevalência de sobrepeso e obesidade em escolares da cidade de Santos, SP. Arq Bras Endocrinol Metab. 2006;50:60-7.
Correspondence: Edio Luiz Petroski
Núcleo de Pesquisa em Cineantropometria e Desempeno Humano (NuCIDH) – Centros de Desportos (CDS) – Universidade Federal de Santa Catarina (UFSC)