2017;25:e2856
DOI: 10.1590/1518-8345.1378.2856 www.eerp.usp.br/rlae
How to cite this article
Stacciarini TSG, Pace AE. Conirmatory factor analysis of the Appraisal of Self-Care Agency Scale – Revised. Rev. Latino-Am. Enfermagem. 2017;25:e2856. [Access ___ __ ____]; Available in: ____________________.
DOI: http://dx.doi.org/10.1590/1518-8345.1378.2856. month day year URL
Conirmatory factor analysis of the
Appraisal of Self-Care Agency Scale – Revised
1Thaís Santos Guerra Stacciarini
2Ana Emilia Pace
31Paper extracted from Doctoral Dissertation “Adaptation and validation of the scale to evaluate the self-care capacity Appraisal of Self-care Agency Scale – Revised for Brazil”, presented to Escola de Enfermagem de Ribeirão Preto, Universidade de São Paulo, WHO Collaborating Centre for Nursing Research Development, Ribeirão Preto, SP, Brazil.
2PhD, RN, Hospital de Clínicas, Universidade Federal do Triângulo Mineiro, Uberaba, MG, Brazil.
3PhD, Associate Professor, Escola de Enfermagem de Ribeirão Preto, Universidade de São Paulo, WHO Collaborating Centre for Nursing Research Development, Ribeirão Preto, SP, Brazil.
Objective: to analyze the factor structure of the Appraisal of Self-Care Agency Scale-Revised (ASAS-R), adapted for Brazil. Method: methodological study conducted with 150 individuals with diabetes mellitus cared for by the Family Health Strategy, most of whom are elderly with low educational levels. The test of the hypothesis concerning the conirmatory factor composition of the ASAS-R was performed using latent variables structural equations. Results:
the model’s goodness-of-it indexes were satisfactory (χ2 = 259.19; χ2/g.l = 2.97, p < 0.001;
GFI = 0.85; RMR = 0.07; RMSEA = 0.09); the factor loads were greater than 0.40; and most item-to-factor-correlations presented moderate to strong magnitude (0.34 to 0.58); total alpha value was 0.74, while the alpha of the three factors were 0.69, 0.38 and 0.69, respectively. Conclusion: the scale’s factor structure presented satisfactory validity and reliability results, with the exception of one factor. Application of this scale to samples of the general population is desirable in order to strengthen analyses of internal consistency and the dimensionality of the factor structure. This study is expected to contribute to further studies addressing the self-care agency construct and the development of the ASAS-R.
Introduction
care agency, a central concept in Orem’s Self-Care Deicit Theory (SCDT), is deined as one’s ability to exercise self-care in order to maintain life, health and wellbeing. It is a complex ability acquired over the course of life, based on repeated behavior on a daily basis and is inluenced by cultural aspects and background, personal skills and limitations, life experiences, health status, and resources available(1).
The development of self-care agency enables an individual to discern between factors that need to be controlled and taken care of, decide what one can do and what one needs to do, recognize one’s own needs, assess personal and environmental resources, and
undertake actions that meet one’s self-care needs(1).
According to the SCDT, the relationship between one’s self-care ability and needs is essential to establishing the actions one should perform and those actions one has the ability to develop in order to maintain
health and prevent and manage diseases(1).
This understanding is important to assessing the self-care ability of people with chronic diseases,
especially diabetes mellitus, which is a condition
that requires great responsibility and commitment, especially from those taking insulin(2-4), to carry on
with the therapeutic regimen that includes behavioral modiication of daily activities(5). From this perspective,
assessing an individual’s personal ability to perform self-care has been widely studied to highlight the individual’s
performance in preventing and managing diabetes
mellitus(4,6-8).
The Appraisal of Self-Care Agency Scale – Revised was adapted and validated in Brazil with a sample of individuals with DM taking insulin, though it is not a speciic scale(9).
The conceptual basis for the development of this scale was the Self-Care Deicit Theory developed by Orem(1). The scale’s items concerning the concept of
self-care agency were based on empowering traits or power components (speciic personal abilities to perform self-care) and operational traits (ability to organize personal and environmental resources that might be signiicant in self-care)(1,10).
The revised version was chosen by Sousa(11) to
be adapted to Portuguese with a sample of Brazilian individuals because it presents a better it index, greater reliability (total Cronbach’s alpha = 0.89) and better validation results in comparison to its original version(9).
The changes performed in the revised version included the exclusion of nine items and the presentation of three factors that were not reported in the original version(11).
The translation and adaptation process of the ASAS-R in Brazil followed the stages recommended in the literature(12). After the translation and adaptation
process, the scale was submitted to analysis of the distribution of frequencies of items’ responses, reliability (internal consistency and product-moment correlation), reproducibility (test-retest and inter-observer), and construct validity (convergent and discriminant)(9).
The results of the psychometric analysis show that the one-dimension structure of the adapted scale is reliable (total Cronbach’s alpha = 0.74), reproducible (test-retest p < 0.001 and inter-observer p < 0.001) and valid (conirmed the correlation hypotheses with the constructs depression and perceived health status and between distinct groups)(9). The hypotheses were based on Orem’s theoretical framework in regard to factors that affect the development and maintenance of self-care agency(1).
Therefore, aiming to continue the psychometric testing of the ASAS-R with a sample of Brazilian
individuals with diabetes mellitus, we performed a
conirmatory factor analysis of the scale to verify whether its dimensions present reliable and valid representations.
Method
This methodological study with quantitative approach was conducted with a sample of 150 Brazilian
individuals with type 2 diabetes mellitus taking insulin
and cared for by three Family Health Strategy units in a city in the interior of Minas Gerais, Brazil, an important economic hub in the region and a reference center in health and education.
Data were collected from September 2011 to February 2012. Inclusion criteria were: both sexes, being 18 years old or older; having been diagnosed with type 2 diabetes mellitus, enrolled in the FHS, and taking insulin for more than one year; and being able to answer the instruments’ questions. Data were collected through an interview held at the participants’ home or during consultations.
The ASAS-R contains 15 items assessed on a ive-point Likert scale, of which only one alternative may be chosen. Scores range from 1 to 5, where: 1 – “totally disagree”; 2 – “disagree”; 3 – “I do not know”; 4 – “agree”; and 5 – “totally agree”. Four out of the 15 questions refer to negative aspects (ASAS-R 4, 11, 14 and 15)(9,11).
for self-care”, composed of items 1, 2, 3, 5, 6 and 10; “Developing power for self-care”, items 7, 8, 9, 12 and 13; and “Lacking power for self-care”, items 4, 11, 14 and 15(1,9).
Data were coded, categorized and typed into an Excel spreadsheet, then exported and processed using the Statistical Package for the Social Sciences version 16.0 to obtain descriptive analyses, variability (standard deviation (SD), minimum and maximum), measures of central tendency (mean, median) and psychometric analyses (reliability and factor validation).
Cronbach’s alpha was used for the reliability analysis; acceptable values for a scale with a small
number of items were between 0.50 and 0.90(13).
Pearson’s product-moment correlation less than 0.30 was considered weak with poor clinical applicability; between 0.30 and 0.50 was considered moderate; and greater than 0.50 was considered strong(14). The
signiicance level was established at 0.05.
In the conirmatory factor analysis, overall it of the hypothesized factorial model and estimation of the construct’s effects on measured variables were considered. Hypothesis testing for the factorial composition of the ASAS-R scale was implemented using latent variable structural equations.
The following indexes were analyzed to verify the model’s goodness of it(15): Chi-square test (χ2),
with signiicance greater than 0.05; Chi-square ratio
(χ2/g.l), with acceptable values below 2.0; Goodness
of Fit Index (GFI), with acceptable values equal to or greater than 0.85; GFI Adjusted for Degrees of Freedom (AGFI), with acceptable values equal to or greater than 0.80; Root Mean Square Residual (RMR), with acceptable values equal to or greater than 0.10; Root Mean Square Error of Approximation (RMSEA), with acceptable values equal to or lower than 0.08; Bentler’s Comparative Fit Index (CFI), with acceptable values equal to or greater than 0.90; and Bentler & Bonett’s Non-normed Fit Index (NNFI), with acceptable values equal to or greater than 0.90.
At least three adequacy indexes with values greater than their references were considered in analyzing the
goodness of it of data to the proposed factors(16). The
estimation method used was maximum likelihood with a minimum of ten observations per item, which presented univariate normality of items(17).
Additional tests for the analysis of the adapted scale (Wald and Lagrange multiplier tests and exploratory analysis) were used to identify a factor structure with more robust results, if there were a weak item-to-factor correlation, low internal consistency of factors or overall it of the hypothesized factor model
with unsatisfactory or modest values compared to the original version.
Wald’s test veriies the extent to which the removal of an item inluences the model’s Chi-square statistics. Items can be removed without affecting future results
when change is not signiicant(15). The Lagrange’s
multiplier test veriies the need to reallocate an item to another factor to improve correlation among the items within the same factor. Similar to the Wald’s test, it shows how much an item reallocated to a new factor will inluence the Chi-square statistics(15).
In the exploratory factor analysis, the Kaiser-Meyer-Olkin (KMO) index and Bartlett’s sphericity test (BTS) are used to assess how adequate the sample size and the factor analysis are to test the null hypothesis of the identity matrix, that is, to verify that there is no cross-correlation among variables and that all off-diagonal correlations are zero. The values expected for the KMO test are between 0.5 and 1 and p < 0.5 for the BTS(17).
In the analysis of the principal components, the factors that obtained eigenvalues (total variance explained for each factor) greater than one were selected and interpreted in a scree plot. The extraction of principal factors is performed after Varimax orthogonal rotation and Kaiser’s criterion(17).
The programs used for the conirmatory and exploratory analyses were the Statistical Analysis System (SAS) for Windows, version 8.02 and the Statistical Package for the Social Sciences (SPSS) version 16.0, respectively.
The study was approved by the city’s Family Health Strategy coordination and the Institutional Review Board at the Federal University of Triângulo Mineiro (Protocol No. 1602/2010). The participants signed free and informed consent forms authorizing the collection and use of data.
Authorization to adapt the ASAS-R for Brazil was provided by the author Dr. Valmi D Sousa, in 2009, who signed an agreement form.
Results
A total of 150 people took part in the analysis of the psychometric properties of ASAS-R. Their sociodemographic and clinical characteristics are presented in Table 1.
Table 1 - Distribution of individuals with diabetes mellitus 2 taking insulin and with care provided by the Family Health Strategy according to sociodemographic and clinical characteristics (n = 150). Uberaba, MG, Brazil, 2012
* Minimum wage at the time was R$ 545.00
Sociodemographic and clinical characteristics n % Interval Median Mean SD
Sex
Female 83 55.3
Male 67 44.7
Age group (years) 18 - 94 64 58.6 16.4
< 60 56 37.3
≥ 60 94 62.7
Marital status
Married/stable union 72 48.0
Single 39 26.0
Widowed 33 22.0
Divorced/separated 6 4.0
Occupation
Retired/pensioner 76 50.7
Employed 48 32.0
Homemaker 20 13.3
Unemployed 1 0.7
Student 5 3.3
Education
Illiterate 17 11.3
No education/can write and read 14 9.3
1-9 years of school 74 49.4
≥ 9 years of school 45 30.0
Income (minimum wage*) Family income 0- 2,200.00 1,000.00 924.63 556.75
Time since DM diagnosis (years) 1 - 41 13 10.5 8.78
Time taking insulin (years) 1 - 40 5 6.41 6.24
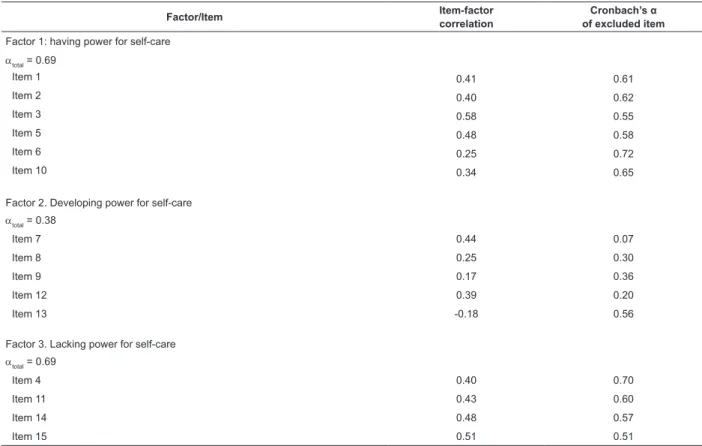
Analysis of item reliability, as described in Table 2, revealed satisfactory internal consistency for factors 1 and 3 (alpha = 0.69). Most correlations among the items of each of the three factors were from moderate to strong magnitude (r = 0.34 to r = 0.58), except for items 6, 8, 9 and 13. Among these four items with weak correlation (r < 0.30), three (8, 9 and 13) are contained in factor 2 “Developing power” (Table 2).
Analysis concerning the correlation among factors revealed correlations of weak magnitude between the factors “Having power” and “Lacking power” (r = 0.21) and moderate magnitude between the factors “Having power” and “Developing power” and between “Developing power” and “Lacking power” (r = 0.44). On the other hand, the correlations of each of the three factors (Having, Developing and Lacking power) with the totality of items presented results of strong magnitude (0.71; 0.80 and 0.76), respectively.
The graphical expression of the path diagram, Figure 1, shows the factor loads of the observed variables (ASAS-R 1 to ASAS-R 15) in the latent variables (Having, Developing and Lacking power for self-care), as well as the co-variances between factors and items variances. In general, the results of the factor loads presented
good values, that is, greater than 0.40, in their factor. The symbol represented by letter e, called error, is not represented by numerical values.
The overall itting results were χ2 = 259.19;
χ2/g.l = 2.97, p < 0.001; GFI = 0.85; AGFI = 0.77;
RMR = 0.07; RMSEA = 0.09; CFI = 0.68 and NNFI = 0.61. These results show the model’s satisfactory itting based on adequacy criteria GFI, RMR and RMSEA. AGFI was close to its reference value 0.80.
The Wald test showed that the exclusion of item 13, “I seek help when I am unable to take care of myself,” reduced the model’s Chi-square (χ2/g.l = 2.714) but
did not affect future results, as it was not signiicant (p = 0.099). The Lagrange multiplier test suggested the reallocation of item ASAS-R 8 in factor 1 and item ASAS-R 10 in factor 2.
A new conirmatory factor analysis with the changes that resulted from the Wald and Lagrange tests showed an increase in the factor loads of the items in the factors, though not signiicant. Small changes were observed in the χ2 statistics (χ2 =200.33; χ2/g.l = 2.707;
Table 2 - Presentation of results concerning the conirmatory factor analysis of the adapted version Appraisal of Self-Care Agency Scale-Revised. Uberaba, MG, Brazil, 2012
Figure 1 - Path diagram of the conirmatory analysis results concerning the adapted version of the Appraisal of Self-Care Agency Scale-Revised.
Factor/Item Item-factor
correlation
Cronbach’s α
of excluded item
Factor 1: having power for self-care
αtotal = 0.69
Item 1 0.41 0.61
Item 2 0.40 0.62
Item 3 0.58 0.55
Item 5 0.48 0.58
Item 6 0.25 0.72
Item 10 0.34 0.65
Factor 2. Developing power for self-care
αtotal = 0.38
Item 7 0.44 0.07
Item 8 0.25 0.30
Item 9 0.17 0.36
Item 12 0.39 0.20
Item 13 -0.18 0.56
Factor 3. Lacking power for self-care
αtotal = 0.69
Item 4 0.40 0.70
Item 11 0.43 0.60
Item 14 0.48 0.57
Item 15 0.51 0.51
e1
e2
e3
e5
e6
e10
e7
e8
e9
e12
e13
e4
e11
e14
e15 ASAS-R1
ASAS-R2
ASAS-R3
ASAS-R5
ASAS-R6
ASAS-R10
ASAS-R7
ASAS-R8
ASAS-R9
ASAS-R12
ASAS-R13
ASAS-R4
ASAS-R11
ASAS-R14
ASAS-R15
variances factor loads
Having Power
Lacking Power
Developing Power Co-variances
0 56
0 40
0 70
0 69
0 30
0 43
0 69
0 31
0 76
0 80
0 42
0 26
0 57
-0 15
0 43
0 61
0 73
0 60
0 83
0 92
0 71
0 73
0 96
0 90
0 60
0 91
0 97
0 82
0 99
0 90
0 79
0 69
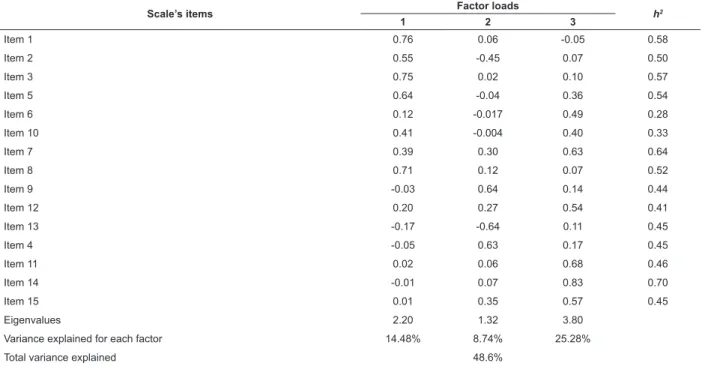
For the exploratory factor analysis, Bartlett’s sphericity test rejected the null hypothesis that the data correlation matrix was an identity matrix (p < 0.001), while Kaiser-Meyer-Olkin (KMO) was 0.643. These results show good it of the data matrix to the factor analysis, indicating that the analysis of principal components could be performed.
The analysis of the principal components using a scree plot resulted in three factors that explained 48.6%
Table 3 - Analyses of the exploratory factor loads, communality (h2), eigenvalues and variances for the total and each
factor of the adapted version of the Appraisal of Self Care Agency Scale-Revised (n = 150). Uberaba, MG, Brazil, 2012
Extraction method: Main components analysis; Rotation method: Varimax with Kaiser normalization; Rotation A converged in ive interactions
of the total variance, while each presented eigenvalues greater than 1 (2.20, 1.32 and 3.80) and explained 14.48%, 8.74% and 25.28% of the scale’s variance, respectively. Table 3 presents the results of the exploratory factor analysis, considering the number of factors identiied in the scree plot test. The presentation of factor loads was made according to the order of the items in the factor.
Scale’s items Factor loads h2
1 2 3
Item 1 0.76 0.06 -0.05 0.58
Item 2 0.55 -0.45 0.07 0.50
Item 3 0.75 0.02 0.10 0.57
Item 5 0.64 -0.04 0.36 0.54
Item 6 0.12 -0.017 0.49 0.28
Item 10 0.41 -0.004 0.40 0.33
Item 7 0.39 0.30 0.63 0.64
Item 8 0.71 0.12 0.07 0.52
Item 9 -0.03 0.64 0.14 0.44
Item 12 0.20 0.27 0.54 0.41
Item 13 -0.17 -0.64 0.11 0.45
Item 4 -0.05 0.63 0.17 0.45
Item 11 0.02 0.06 0.68 0.46
Item 14 -0.01 0.07 0.83 0.70
Item 15 0.01 0.35 0.57 0.45
Eigenvalues 2.20 1.32 3.80
Variance explained for each factor 14.48% 8.74% 25.28%
Total variance explained 48.6%
According to the exploratory factor analysis, the reallocation of items in the factors were as follows: factor 1 “items ASAS-R 1,2,3,5,8,10”; factor 2 “items ASAS-R 4,9,13” and factor 3 “items ASAS-R 6,7,11,12,14,15”. Factor 2 “Developing power for self-care” presented the least variance for each factor (8.74%) and the smallest number of items allocated in the factor theoretically proposed (Table 3).
The factor loads were greater than 0.40 for all the items. Items ASAS-R 2 and 10 should be disregarded because they obtained a high load in more than one factor, though they were allocated to the factor with the highest load. Item ASAS-R 14 presented the greatest communality; that is, 70.0% of its variance was explained by the factors (Table 3).
In regard to the conirmatory factor analysis of the items in the factors obtained in the exploratory factor analysis, the results concerning the alpha of the items in the three factors and item-to-factor correlation
coeficients were slightly better when compared to those obtained during the conirmatory factor analysis of the original structure.
The values concerning the analysis of internal consistency were: factor 1 total alpha = 0.75; factor 2 total alpha = 0.47 and factor 3 total alpha = 0.75. Most correlations among the items of each of the three factors presented moderate to strong magnitude (r = 0.37 to r = 0.64), except for the items in factor 2 “Developing power” (ASAS-R 4, 9 and 13), which presented values below 0.30. Note that the alpha value and the item-to-factor correlation coeficients of factor 2 “Developing power” remained unsatisfactory.
Discussion
Nursing Development Conference Group (NDCG), to measure the central concept of Orem’s Self-Care Deicit Theory in1986(10).
Even though the ASAS is based on the ten power components, it does not mention dimensions. Measurement is taken in a global and nonspeciic way and can be applied and compared to different age groups under various health conditions(10). Since
then, studies have been conducted to verify the factor structure and internal consistency of the scale’s items in different countries, to meet criteria concerning construct validity(4,11,18-21).
One study conducted with a sample of Americans
with diabetes mellitus taking insulin veriied that weak
correlations found for some items suggested that the
scale could have more than one dimension(4). The
authors continued the studies and decided to verify the exploratory and conirmatory factor structure of the ASAS with 24 items for a sample of 389 American individuals from the general population(11).
The aforementioned study reports a new structure that obtained excellent goodness-of-it index after excluding nine items and describing and listing three
factors(11). Comparison of the conirmatory factor
analyses among the versions: ASAS 24 items with a single factor; ASAS 24 items with three factors; and ASAS 15 items with three factors, revealed that the last version presented the best goodness of it, as well as the best construct validity, strongest factor loads, a high variance explained for all the items, and high reliability, in addition to showing strong linear correlation with the original (r = 0.98; p < 0.001)(11).
Therefore, based on psychometric analysis of validation and reliability, a new version with 15 items called Appraisal of Self Care Agency-Revised (ASAS-R) was established. One of the conclusions reached by the aforementioned study was that there was a need to conduct further studies seeking to perform psychometric assessments among people with chronic diseases, especially diabetes mellitus(11).
In this sense, based on the revised version, ASAS-R, applied to a sample of Brazilian individuals with diabetes
mellitus(9), this study sought to continue the validation
process, analyzing correlations, internal consistency, and the results of the hypothesized model’s overall it, so that these results could be compared with those from the original version(11).
The correlations among the items of each of the three factors in this study presented from moderate to strong magnitude, with the exception of the items from factor 2 “Developing power for self-care”. The correlations reported by the study conducted with the original version were also of moderate to strong
magnitude, though in this case, among the items of the three factors (r = 0.41 to r = 0.60, de r = 0.34 to r = 0.61 and from r = 0.40 to r = 0.57, respectively)(11).
The results concerning the analysis of the total internal consistency of the items in the adapted version of ASAS-R (Cronbach’s alpha = 0.74) and factors 1 “Having power for self-care” and 3 “Lacking power for self-care” (Cronbach’s alphas of 0.69), were considered satisfactory, except for factor 2 “Developing power for self-care” (Cronbach’s alpha = 0.38).
The results concerning the internal consistency of the ASAS-R original version were: total alpha = 0.89 and the alphas among factors were 0.86, 0.83 and 0.79, respectively(4), the highest total alpha, compared to
studies that used the ASAS version with 24 items (total from 0.59 to 0.80)(11).
In regard to the conirmatory factor analysis of the adapted scale, despite the weak correlations and unsatisfactory alpha value contained in factor 2, “Developing power for self-care”, the proposed theoretical model was not rejected by the χ2 test or
the other three adequacy tests (χ2/g.l=2.97 GFI=0.85;
RMR = 0.07 RMSEA = 0.09). The factor loads presented values greater than 0.40, except in items ASAS-R 9 and ASAS-R 13.
The study conducted with the original version(11)
yielded greater model goodness-of-it values in all the adequacy tests (χ2/g.l = 1.97; GFI = 0.94;
AGFI = 0.92; CFI = 0.96; TLI = 0.95; RMSEA = 0.05; RMR = 0.05), with factor loads from 0.58 to 0.73 and explained variance from 0.34 to 0.55. Note that all items of the original version presented high factor loads, as well as satisfactory results of item-to-factor correlation, including item ASAS-R 13.
Expecting to identify the items that could be affecting reliability and the quality of the model’s fit, Wald’s and Lagrange’s multiplier’s tests were performed together with exploratory factor analysis. Even after reallocating or removing some items, however, the estimation of the factor loads and
differences in the χ2 statistics and
goodness-of-fit measures obtained in a new confirmatory analysis were not significant enough to suggest any adjustment in the specified factorial model.
In the exploratory factor analysis, the scree plot test suggested three factors, the same number presented in the original version(11), but factor 2
still presented weaker correlations and low internal consistency, as well as a low variance was explained for each factor (8.74%).
more evidence to strengthen analysis of the internal consistency and dimensionality of the factor structure. Additionally, we do not know the extent to which the sample’s homogeneity, in terms of sociodemographic, cultural, clinical characteristics, or in terms of accessibility to public services, contributed to the reliability results or the goodness of it of this scale.
Conclusion
Analyses of product-moment correlation and reliability of the factor structure of the adapted ASAS-R were satisfactory, except for factor 2 “Developing power for self-care”. The construct validity, assessed through conirmatory factor analysis, presented satisfactory results in three goodness-of-it indexes (GFI, RMR and RMSEA), such that it is acceptable in the proposed theoretical model. The factor loads were greater than 0.40, except for two items.
Additional statistical tests were used to improve the performance of the factor structure but the estimated values of the factor loads and goodness-of-it measures suggested that the results of the model proposed by the authors of the original version should be maintained.
Therefore, the conclusion is that the initial factor structure of the adapted scale presented satisfactory results concerning reliability and validity but further studies are necessary. This study is expected to contribute to research addressing the concept of self-care agency and the development of ASAS-R and to favor the monitoring of individuals with DM within the care model of the public Brazilian Health System.
References
1. Orem DE. Nursing: concepts of practice. 6th ed. St Louis, MO: Mosby; 2001.
2. Stacciarini TSG, Pace AE, Haas VJ. Insulin self administration technique with disposable syringe among patients with diabetes mellitus followed by the Family Health Strategy. Rev. Latino-Am. Enfermagem. 2009;17(4):474-80.
3. Stacciarini TSG, Caetano TSG, Pace AE. Dose de insulina prescrita versus dose de insulina aspirada. Acta Paul Enferm. 2011;24(6):789-93.
4. Sousa VD, Zauszniewski JA, Zeller RA, Neese JB. Factor analysis of the Appraisal of Self-Care Agency Scale in american adults with diabetes mellitus. Diabetes Educ. 2008;34(1):98-108.
5. Schmidt MI, Duncan BB, Silva GA, Menezes AM, Monteiro CA, Barreto SM, et al. Doenças crônicas não transmissíveis no Brasil: carga e desaios atuais. In: The Lancet. Saúde no Brasil; 2011. p. 61-73.
6. Sousa VD, Zauszniewski JA. Toward a theory of diabetes self-care management. J Theory Construc Testing. 2005;9(2):61-6.
7. Sousa VD, Zauszniewski JA, Musil CM, Prince Lea PJ, Davis SA. Relationships among care agency, self-eficacy, self-care and glycemic control. Therory Nurs Pract. 2005;19(3):217-30.
8. Sousa VD, Hartman SW, Miller EH, Carroll MA. New measures of diabetes care agency, diabetes self-eficacy and diabetes self-management for insulin-treated individuals with type 2 diabetes. J Clin Nurs. 2009;18(9):1305-12.
9. Stacciarini TSG, Pace AE. Tradução, adaptação e validação de uma escala para o autocuidado de portadores de diabetes mellitus tipo 2 em uso de insulina. Acta Paul Enferm. 2014;27(3):221-9.
10. Evers GCM, Isenberg M, Philipsen H, Brouns G, Halfens R, Smeets H. The appraisal of self-care agency’s ASA-Scale: research program to test reliability and validity. In: Proceedings of the International Nursing Research Conference “New Frontiers in Nursing Research”. Edmond, Canada: University of Alberta; 1986. 130 p.
11. Sousa VD, Zausniewski JA, Bergquist-Beringer S, Musil CM, Neese JB, Jaber, AF. Reliability, validity and factor structure of the Appraisal of Self-Care Agency Scale- Revised (ASAS-R). J. Eval Clin Pract. 2010;16(6):1031-40.
12. Beaton DE, Bombardier C, Guillemin F, Ferraz MB. Guidelines for the process of cross-cultural adaptation of self report measures. Spine. 2000;25(24):3186-91. 13. Bowling A. Measuring health: a review of quality of life measurement scales. 3rd ed. Berkshire: Open University Press; 2005.
14. Ajzen I, Fishbein M. Understanding attitudes and predicting social behaviors. New Jersey: Prentice-Hall; 1980. 278 p.
15. Hatcher L. A step-by-step approach to using the SAS system for factor analysis and structural equation modeling. Cary, NC: SAS Institute Inc; 1994. 588 p. 16. Kline P. An easy guide to factor analysis. Londres: Routledge; 1994.
Received: Dec. 10th 2015
Accepted: Nov. 14th 2016
Corresponding Author: Thaís Santos Guerra Stacciarini
Universidade Federal do Triângulo Mineiro, Hospital de Clínicas Rua José Pimenta Camargo, 332
Parque do Mirante
CEP: 38081-230, Uberaba, MG, Brasil E-mail: [email protected]
Copyright © 2017 Revista Latino-Americana de Enfermagem
This is an Open Access article distributed under the terms of the Creative Commons (CC BY).
This license lets others distribute, remix, tweak, and build upon your work, even commercially, as long as they credit you for the original creation. This is the most accommodating of licenses offered. Recommended for maximum dissemination and use of licensed materials.
18. Abril FM, Fernández A, Velandia A. Análisis factorial de la escala valoración de agencia de autocuidado (ASA) en Colombia. Aquichan. 2009;9(3):222-35.
19. Fok MSM, Alexander MF, Wong TKS, McFadyen AK. Contextualising the Appraisal of Self - Care Agency Scale in Hong Kong. Contemp Nurse. 2002;12(2):124-34. 20. Söderhamn O, Cliffordson C. The internal structure of the Appraisal of Self-Care Agency Scale. J Nurs Theory. 2001;10:5-12.