THE RISK FACTORS AND EMOTIONAL ON THE VOICE
OF TEACHERS WITH AND WITHOUT VOCAL COMPLAINTS
Fatores de risco e emocionais na voz de professores
com e sem queixas vocais
Denise Batista da Costa(1),Leonardo Wanderley Lopes(2), Eveline Gonçalves Silva(3),
Germana Maria Soares da Cunha(4), Larissa Nadjara Alves Almeida(5), Anna Alice Figueirêdo de Almeida(6)
(1) Student of Speech and Language Pathology Course from
Universidade Federal da Paraíba – UFPB – João Pessoa
(PB), Brazil; Scientiic initiation Fellowship of CNPq.
(2) Speech and language therapist; Professor of Speech and
Language Pathology Department from Universidade Fede-ral da Paraíba – UFPB – João Pessoa (PB), Brazil; Linguis-tics PhD, Universidade Federal da Paraíba – UFPB.
(3) Student of Speech and Language Pathology Course from
Universidade Federal da Paraíba – UFPB – João Pessoa
(PB), Brazil; Scientiic initiation Fellowship of CNPq.
(4) Student of Speech and Language Pathology Course from
Universidade Federal da Paraíba – UFPB – João Pessoa
(PB), Brazil; Scientiic initiation program of UFPB.
(5) Student of Speech and Language Pathology Course from
Universidade Federal da Paraíba – UFPB – João Pessoa
(PB), Brazil; Scientiic initiation program of UFPB.
INTRODUCTION
The Speech, Language and Hearing Sciences has been dedicated to the study of occupational dysphonia linked to teachers, much because of
the growing number of requests for absence from work related to problems involving voice. Teachers
make up one of the classes most affected by vocal ABSTRACT
Purpose: to evaluate the effect of emotional risk factors on the voice of teachers with and without vocal complaints. Method: the sample comprised 44 teachers. We used a form for collecting personal
and professional data, three questionnaires concerning vocal aspects, and two questionnaires for data related to emotion. Further, we recorded voices for auditory-perceptual analysis. The teachers were
divided based on the number of symptoms reported: 22 volunteers in a group of Teachers Without Complaints (TWOC) and 22 in a group of Teachers With Complaints (TWC). The latter group included individuals reporting more than three vocal symptoms. Results: the average number of symptoms
described in the Voice Signs and Symptoms Questionnaire was 5.7 (±2.8) and 0.8 (±0.9) for the
PCQ and PSQ groups, respectively. The PSQ reported better vocal self-assessment (p = 0.01) and the PCQ reported greater vocal impairment (p = 0.001). The PSQ group obtained the highest scores
in the Physical Voice-related Quality of Life (P-VQL) (p = 0.0007) and Total VQL (p = 0.0006). The
PCQ had higher values in the Total Voice Handicap Index (VHI) (p = 0.0003) and Organic VHI (p =
0.0006), and greater emotional impairment in the Self-Report Questionnaire [5.7 (±3.9)] and Trait-State Anxiety Inventory [42.5 (±12.7)]. Auditory-perceptual analysis showed that the PCQ had moderate vocal deviation with vocal roughness, breathiness, and tension, while the PSQ group showed slight
deviation in all parameters. Conclusion: teachers with vocal complaints are exposed to more risk factors, and report more symptoms and vocal and emotional impairments.
KEYWORDS: Faculty; Voice; Anxiety; Emotions; Communication; Speech, Language and Hearing Sciences
(6) Speech and language therapist; Professor of Speech and
Language Pathology Department from Universidade Fede-ral da Paraíba – UFPB – João Pessoa (PB), Brazil; Science
PhD, Universidade Federal de São Paulo – UNIFESP. Financial Support: CNPq
problems and various consequences are caused, such as the dificulty of developing the profession
and problems related to communication, social and emotional life1.
We know that the voice is the primary instrument
for performance of teachers in the classroom for the materialization of teaching and learning process. Any deviation that occurs in this instrument can affect the professional performance of teachers and
engage students’ learning. However, many of these
professionals do not value the symptoms related to dysphonia, thus aggravating his problem. This fact
makes it more dificult to recover, which may result
in the removal of their professional practice2.
Dysphonia is characterized by the presence of vocal symptoms and may be of organic origin and/
or functional origin, with the main symptoms: vocal
fatigue, hoarseness, irritated throat, voice failure, shortness of breath to speak, among other3.
In a recent survey4, it was found that most teachers had altered vocal quality, being moderate the most frequent degree. Speciic complaints appeared to be equally distributed among teachers with and without voice changes. Finally, the researchers identiied
the need for vocal health projects for this population.
Several factors interfere with the development
of a vocal disorder in teachers. These are related
to the work environment, excessive activities and pressure imposed by the higher courts, which can
cause stress and anxiety, also components that are
associated with voice problems. Thus, it is seen that
emotional problems may be involved in the cause or
consequence of the vocal problem1.
Some researchers point to the interference of emotions in voice production. They claim that a person expresses personality traits in his voice such as feelings, health, humor, depression, frustration, among others. Anxiety and stress cause some physiological changes in the body, so the structures that make up the vocal tract are also affected by modifying the voice emission5.
It should be noted that the reverse also occurs. Vocal disorders can cause psycho-emotional
stress, depression and frustration which negatively
affect the social functioning, in addition to cause a
signiicant impact on life quality and work eficiency
of individual6,7.
In a recent study8, it was observed that the higher
the level of trait anxiety, the greater the number of signs and vocal symptoms, besides there being
such relationship, one must consider whether it is
coincidence or purpose, maintenance or genesis of
dysphonia, in people with emotional impairment.
Thus, the aim of this paper is to analyze the inter-ference of the risk and emotional factors in the voice
of teachers with and without voice complaints.
METHOD
This is a quantitative, ield, observational, cross-sectional study. This was assessed and approved
by the Ethics Committee in Research of the Lauro Wanderley University Hospital of the Federal
University of Paraíba, protocol CEP / HULW No. 278/09.
Participants were 44 teachers, of both sexes, who were aged between 18-50 years, belonging to ive public and private schools in the State of
Paraíba.
This study selected volunteers according to the
inclusion criteria of (1) having age between 18 and 50 years, because we understand that the lower limit ensures the inal process of voice change and
the startup of a series of structural changes in larynx
due to senescence, with a greater or lesser vocal
impact9, (2) being teachers with and without vocal
complaints and (3) having signed the Statement of Consent Form (ICF).
With regard to the exclusion criteria, it could not
participate in the study individuals with neurological diseases, as well as involvement of the upper airway
at the time of the survey.
Initially, the contact was made with schools in order to select silent sites for data collection, as well
as the authorization of the educational institution
for the research. Subsequently, teachers were contacted and have healed their doubts when faced with the Consent form to initiate a search.
Then the teachers answered the ive question
-naires related to voice and emotion. Finally, we
collected a sample of speech in a silent place previ-ously selected.
The questionnaires used were a form with personal
and professional data (length of employment,
weekly schedule, type of school, subjects taught, the existence of noise in the workplace, self-perception
Vocal aspects:
• Questionnaire of Signs and Vocal Symptoms (QSVS)
It contains a list of vocal symptoms indicating the onset of a symptom in the past, present, the
frequency that occurs and if it is related to work. This
questionnaire was developed in English10 and had
a translated and adapted version to Portuguese11.
• Questionnaire of Life Quality in Voice (QLQV)
The QLQV is a self-assessment questionnaire to measure the relationship of voice and life quality in
issues related to communication, it has 10 items and 2 domains: the social-emotional, measured by items
4, 5, 8 and 10, and physical functioning, assessed by means of other questions. The QLQV had been
translated and validated for Portuguese12.
• Voice Handicap Index (VHI)
It is a self-assessment questionnaire to measure
how a vocal problem interferes with daily communi
-cation situations. It has thirty items distributed into three areas: functional, emotional and organic. It
was used the validated version for Portuguese13.
Emotional Aspects:
• Trait-State Anxiety Inventory (TSAI)
This instrument contains two subscales items with twenty items and four degrees of intensity each.
The TSAI is intended to measure the subjective state of anxiety. It addresses the self-perception of the individual regarding the trait anxiety, personality trait prone to anxiety, and state anxiety, transient
emotional condition at the time of application. It was
used a validated version in Portuguese14.
• Self-Report Questionnaire (SRQ-20)
It evaluates, through 23 questions, psychiatric
disorders, common mental disorders, primarily
related to anxiety, depression and stress. Men who mark six afirmative and women who marked seven
afirmative were considered emotionally compro
-mised. It used a version validated in Brazil15.
In addition to the questionnaires, a vocal sample was collected for the purpose of performing
auditory-perceptual evaluation of voice. To this
end, it was requested that each teacher emitted on self-reported usual frequency and intensity, the
sustained vowel /E/ and count of 1-20. The vocal
sample was collected using a microphone Logitech
headset, coupled to a notebook. The vocal sample
was recorded in free software PRAAT, using the
sampling rate of 44100 Hz
For the auditory-perceptual evaluation, a
visual-analogic scale (VAS) 100mm was used, evaluating
the parameters overall grade (GG), roughness (R), breathiness (S), tension (T) and instability (I). The marking nearest 0 represents less change and the closer the 100, the greater the changes. Thus, the intensity of vocal deviation has ranges from 0 to 100 mm.
It is important to mention that for the data analysis,
the participating teachers were deined as vocal complaints when reported three or more symptoms
in the Questionnaire of Signs and Vocal Symptoms (QSVS) being allocated to the group of teachers
with complaints (PCQ), and those who presented a number of symptoms less than three were allocated to group of teachers without complaints (PSQ).
The collected data were tabulated in a spread
-sheet and then analyzed by the statistical program
STATISTICA, version 6.1, being the signiicance level p ≤ 0.05. The descriptive statistical analysis was used to describe the variables by mean, standard deviation, frequency and percentage, as well as the
inferential statistics from the Mann-Whitney test to compare the groups PCQ and PSQ.
RESULTS
Below are the tables with the research results
and respective discussion.
Table 1 shows the frequency of occurrence of work-related variables.
Teachers with complaints (PCQ) ministered
disciplines, predominantly of the humanities, such
as history, geography and Languages, while the group of teachers without complaints (PSQ) were
responsible for other disciplines such as computer
science and arts, followed by the Exact Sciences
Both groups were mainly public schools and the largest share was in the PSQ group, with teachers who worked in both types of schools, private and
public.
The group PCQ referred to there be more noise
in the workplace, than that shown by PSQ, but both
groups indicated the presence of noise in schools.
Table 2 shows the means and standard devia
-tions of vocal and emotional self-assessment of
teachers with and without complaints.
Table 1 – Absolute and percentage frequency of work-related variables
Variables PCQ PSQ Significance
N % N %
Disciplines 0.03
Biological 2 9.1 0 0
humanities 8 36.4 1 4.5
Exact sciences 2 9.1 4 18.2
Languages 3 13.6 4 18.2
Physical Education 0 0 1 4.5
others 4 18.2 9 49.9
not answered 0 0 1 4.5
More than one area 3 13.6 2 9.1
Type of School 0.004
public 8 36.4 18 81.8
private 6 27.2 1 4.5
both 8 36.4 3 13.6
Reporting of noise at work 0.03
presence 20 90.9 14 63.6
absence 2 9.01 8 36.4
Variables PCQ PSQ Significance
Mean Standard deviation Mean deviation Standard
number of symptoms 6.6 ± 2.03 0.8 ± 0.9 <0.0001
Self-Assessment QSVS 5.3 ± 1.6 8.8 ± 0.7 0.009
Problem with Voice 1.4 ± 0.5 1.8 ± 0.4 0.006
Self-Assessment LQVQ 3.5 ± 0.8 2.8 ± 0.7 0.006
Physical LQVQ 72.9 ± 17.9 91.2 ± 10 0.0003
Total LQVQ 79.5 ± 16.6 94.09 ± 6.7 0.0003
Total SRQ 5.7 ± 3.9 3.4 ± 3 0.02
TSAI State 42.5 ± 12.7 37 ± 11.7 0.05
Total VHI 27.1 ± 22.5 8.9 ± 8.9 0.0003
Organic VHI 16.5 ± 20.4 2.9 ± 3.7 <0.0001
Captions: PCQ- teachers with complaints; PSQ- teachers without complaints. Mann Whitney statistical test
The PCQ reported feeling more vocal and emotional symptoms and had poorer self-rated
voice compared to PSQ, however they did not report
a bad self-perception of voice problem, reporting the existence of the problem less than group PSQ.
For QLQV the PCQ had lower scores than
PSQ, which means that the possible voice altera
-tions interfere with the life quality of individuals. The physical domain was the most compromise to the
PCQ.
Emotional symptoms were more frequently reported by PCQ in both questionnaires for this review, the TSAI and SRQ. Only the TSAI State was statistically signiicant, which exposes a picture of
anxiety at the time of application of research.
The PCQ showed vocal handicap index higher
than the PSQ, especially in the organic domain. Table 3 presents the occurrence of signs and emotional and vocal symptoms in both groups studied.
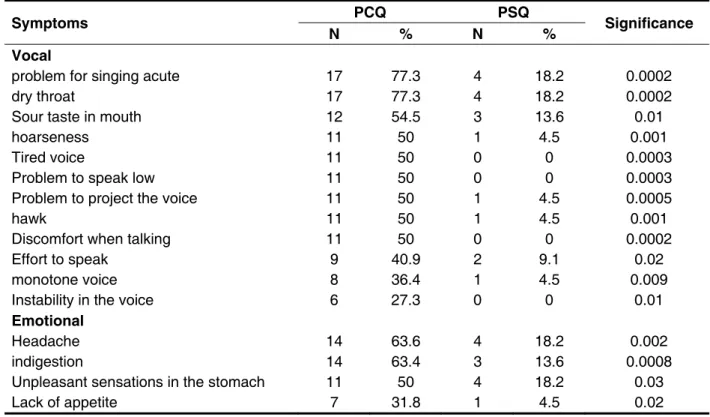
Table 3 – Occurrence of signs and vocal and emotional symptoms in teachers with and without complaints
Symptoms N PCQ % N PSQ % Significance
Vocal
problem for singing acute 17 77.3 4 18.2 0.0002
dry throat 17 77.3 4 18.2 0.0002
Sour taste in mouth 12 54.5 3 13.6 0.01
hoarseness 11 50 1 4.5 0.001
Tired voice 11 50 0 0 0.0003
Problem to speak low 11 50 0 0 0.0003
Problem to project the voice 11 50 1 4.5 0.0005
hawk 11 50 1 4.5 0.001
Discomfort when talking 11 50 0 0 0.0002
Effort to speak 9 40.9 2 9.1 0.02
monotone voice 8 36.4 1 4.5 0.009
Instability in the voice 6 27.3 0 0 0.01
Emotional
Headache 14 63.6 4 18.2 0.002
indigestion 14 63.4 3 13.6 0.0008
Unpleasant sensations in the stomach 11 50 4 18.2 0.03
Lack of appetite 7 31.8 1 4.5 0.02
Mann Whitney statistical test
The vocal and emotional symptoms were
prevalent in the group PCQ. Problems to sing sharp,
dry throat and acid taste in the mouth were the most frequently cited among the vocal symptoms; and
headache, indigestion and unpleasant sensations in
the stomach were among the emotional signs.
Some symptoms addressed in the question
-naires with the focus on emotion might relate
to the symptoms of the protocols aimed at voice,
it is the case of poor digestion with sour taste in
the mouth, suggesting poor eating habits and/or changes in the stomach. Thus, certain emotional symptoms may have direct interference in vocal production.
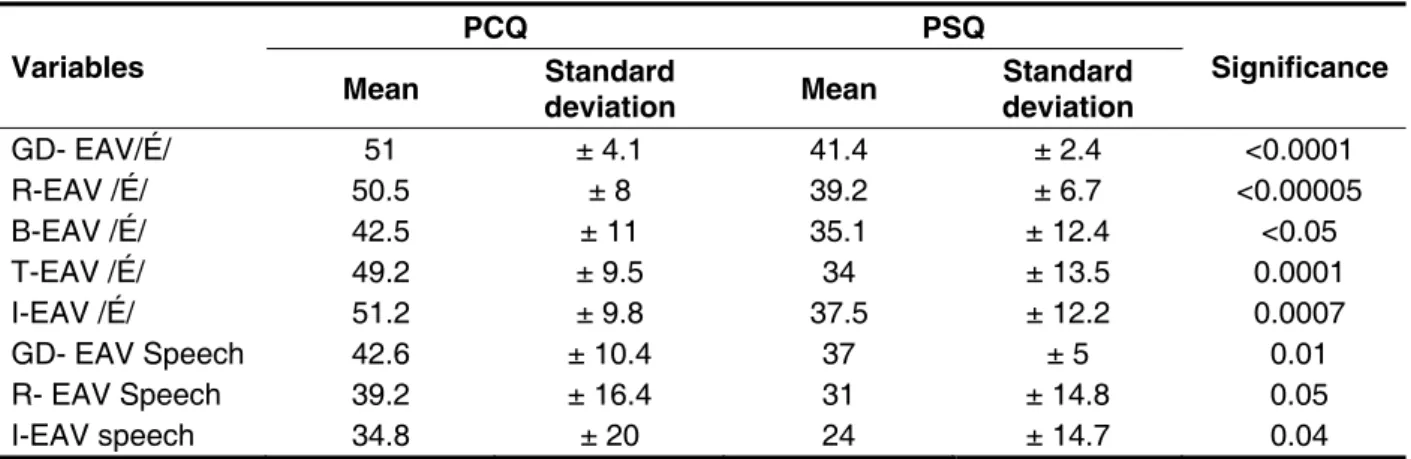
The PCQ exhibited moderate intensity of vocal
deviation, in the overall degree for emission of vowel
/E/ and speech. The PSQ also had vocal deviation of mild intensity.
The PSQ group has higher roughness, breathiness, strain and instability than the expected
for unchanged voices, while the PSQ, only the roughness and instability parameters were found
higher than the expected for adapted voices.
In general, the voices from the group PCQ were
more altered in all parameters, compared to the PSQ.
DISCUSSION
The disciplines that make up the humanities
were predominantly taught by teachers who had
vocal complaints. It is believed that these disciplines
are generally those with more theoretical content, implying almost always in lectures, increasing vocal
demand by teachers, a fact that can maximize the risk of developing some vocal problem.
Schools generally do not offer favorable
condi-tions for the development of teachers’ work. These schools had no concern with the vocal health of
teachers, lacking a prevention program of vocal disorders or a vocal conservation/ promotion program. Including almost all teachers reported that the classrooms had unfavorable acoustic due to the presence of internal and external noise.
The noise shows up as a competitor to the
of stress for teachers at work with several physi
-ological changes, such as cardiovascular, intestinal and emotional16.
In a recent research17, 75% of teachers considered noisy where are located the rooms in which they minister disciplines. They reported that environmental noise caused 79.2% need to speak out loud, which often happens to 73.7% of teachers, and 37.5% had hoarseness after classes and 29.2% hawking.
The number of vocal symptoms was used as the criterion for inclusion in the group of teachers with voice complaints (PCQ) and teachers without vocal
complaints (PSQ). The PCQ expressed feeling at
the present time, a number equal to or greater than
three symptoms, this number may be indicative of
a change already installed, so it was considered a worrying number, analyzing that this professional
depends essentially on their voice to perform
its function; while the PSQ had less of one vocal
symptom.
In research with teachers and non-teachers
conducted in the United States10 was found a
number of 4.3 vocal signs and symptoms and those non-teachers mean of 3.1. In Brazil, a similar study11
revealed a number of 3.5 signs and vocal symptoms and those non-teachers1,7.
In a recent study18 was compared the impact of vocal loss between teachers and non-teachers, the latter being those more concerned with a possible
Variables PCQ PSQ Significance
Mean deviation Standard Mean Standard deviation
GD- EAV/É/ 51 ± 4.1 41.4 ± 2.4 <0.0001
R-EAV /É/ 50.5 ± 8 39.2 ± 6.7 <0.00005
B-EAV /É/ 42.5 ± 11 35.1 ± 12.4 <0.05
T-EAV /É/ 49.2 ± 9.5 34 ± 13.5 0.0001
I-EAV /É/ 51.2 ± 9.8 37.5 ± 12.2 0.0007
GD- EAV Speech 42.6 ± 10.4 37 ± 5 0.01
R- EAV Speech 39.2 ± 16.4 31 ± 14.8 0.05
I-EAV speech 34.8 ± 20 24 ± 14.7 0.04
Table 4 – Mean and standard deviation of the voice’s auditory-perceptual evaluation of teachers with and without complaints
to communicate, express ideas and interact with the environment in which it is inserted.
The domain LQVQ related to physical functioning
was signiicantly more compromised in PCQ, agreeing with the number of vocal symptoms. This
result is similar in some studies3 demonstrating that
physical symptoms such as “vocal fatigue” cause a
greater impact on life quality of individuals, therefore
being more noticeable. The PCQ demonstrated inability to perform its function because of voice.
The scores for the PSQ showed a good relationship between voice and life quality of this group.
The feeling that the air ends fast during emission
may show the bad glottal closure. The presence of a
glottal gap increases the transglottic airlow compro
-mising the vibration of the vocal folds, a fact that
relects in short emissions with greater effort and frequent episodes of reilling air during speech.
Another comparison to be highlighted is the VHI
values, where PCQ scores indicate that the voice
handicap has interference in everyday situations,
which happens less for PSQ. The organic VHI may
suggest a change in the structures responsible for voice production and may be compromised in PCQ. Some symptoms, such as “effort to speak” and
“force to voice out” reinforce a dificulty in glottal
closure, suggesting the presence of a mass lesion
or inadequate muscle adjust, causing a defect in the closure of the vocal folds, and thus requiring a
greater effort to get putting them in vibration9.
Despite the vocal self-assessment question
-naires suggest impairment of the voices of PCQ, this group has no perception of such a limitation, not admitting there being a problem in their voice; making this professional not to look a specialist to adjust the voice to your demand, continuing to make vocals efforts and aggravating the change. This fact suggests that many teachers think they have a shifted/changed voice is an inherent feature of their profession.
The SRQ notes the degree of emotional commitment (stress, anxiety and depression), being
more committed those who claim to feel six or more symptoms exposed in the questionnaire. The PCQ showed greater degree of emotional commitment, pointing a result to that expected for people with
emotional restrictions. The PSQ have no emotional
commitment. This fact is conirmed in the state TSAI scores, which show that the PCQ have emotional
commitment over than that expected for anxious people (above 41)8,14.
The occurrence of signs and vocal and emotional
symptoms in teachers with and without complaints is shown in Table 3. From this we note a large number
of reported vocal symptoms of PCQ compared to PSQ.
The symptom “throat ache” and “dry mouth”
was prevalent among teachers, both in past and
present. Lack of hydration during classes can lead
to dry throat, highlighting the lack of basic care with the voice, as well as increased transglottic airlow can also lead to this feeling. This symptom was also featured in another study with itchy throat and vocal
fatigue19. In another survey, most of them state to
feel dry/scraping throat (26 teachers – 61.90%)20.
Other symptoms highlighted in Table 3 are:
problems to speak low, to project the voice, singing
acute and monotone voice, which indicates difi
-culty of teachers in lexible the voice, change the frequency and the tone. The prevalence of the
symptom sour taste in the mouth, interrogated in the QSVS, may indicate the presence of
laryngo-pharyngeal relux. This is a result of poor dietary
habits and changes in the stomach, a fact that
conirms the SRQ data, the symptom of indigestion. The change in stomach may be the gastritis, which,
among other factors, has the emotional one as
the cause. Nervousness, stress and anxiety can
develop stomach gastritis. Stress causes a
stimu-lation of the production of hydrochloric acid which corrodes the stomach wall and may also affect the
vocal folds21, further conirming on more evidence
of the presence of emotional changes in teachers surveyed. One study concluded that GERD may be
associated with the change of the epithelium of the larynx posterior wall, as well as with inlammatory
histologic changes in this region22, structure
respon-sible for the voice production.
Overall, it was analyzed that the highest levels of emotional commitment were observed in the group of teachers with voice complaints. Professionals who reported more vocal symptoms in QSVC (Table 3), and lower life quality in voice and a greater vocal handicap (Table 2) are those who obtained higher scores on the questionnaires related to emotion,
both the SRQ and TSAI-State.
In vowel emission, the voices appeared most altered comparing them with the speech (counting) in the rating scale. The vowel evaluation provides predominantly data from glottal source, while speech has a higher share of supraglottic adjustments, ilter.
From the auditory-perceptual analysis could be perceived a moderated vocal deviation for PCQ
in the evaluation of vowel /E/, which can interfere
with the eficiency of their work and, if not careful,
According to the data in Table 4, it is noticed that
the PCQ had voices with presence of roughness, breathiness and tension. It is known that the
roughness is the most common vocal manifestation, occurring in irregular vibration of the vocal fods9. In addition, the voices of teachers also showed breathiness, with moderate intensity of vocal
deviation.
In the tension, there is activity of the
supra-hyoid muscles, which can simultaneously elevate
the larynx and cause the sound to be produced at
a more acute frequency with vocal projection and
reduced effort in the laryngopharyngeal region. The repeated use of this pattern may result in the devel-opment of a mass lesion by inappropriate behavior and voice pattern. Thus, the tension generated by the anxiety can lead to changes in the vocal tract, overloading the resonance and potentially triggering a process of vocal change8.
Through the auditory-perceptual analysis, it was
inferred that the PCQ group presented a considerable
vocal deviation, which relects on their life quality, as
highlighted in the vocal self-assessment question
-naires. These data demonstrate a relationship
between vocal and emotional problems, especially
anxiety. The most changed voices emanated from subjects considered more anxious. Thus, there is a need for further investigation of the relationship
between these factors, once it was not possible
to infer if the factor anxiety is the cause of vocal disorder or the reverse relationship is also true.
It is important to mention that the Paraíba does
not have a law to regulate and/or enable the creation
of a Vocal health program that can protect the communication of teachers of the state, as it is the case in some states and municipalities in Brazil that already have it23. It is known that such initiatives may, in addition to improving the health of their workers, foster the relationship between teacher and student,
as well as facilitating the learning process, consid
-ering that the voice is the main teacher instrument
for the knowledge transmission transmission.
CONCLUSION
Teachers considered with vocal complaints have
greater emotional and vocal commitment compared
to teachers who have no vocal complaints, a fact which indicates the existence of interference of
emotions in the development and/or maintenance of
voice disorders. This fact is relected in the number of reported complaints and compromised life quality
of these professionals. Thus, we highlight the impor
-tance of vocal health program for teachers, so that
they have knowledge about the voice and start to
maintain vocal health care, avoiding future problems
that may culminate in the compromised life quality and absence from work.
RESUMO
Objetivo: analisar a interferência dos fatores de riscos e emocionais na voz de professores com e
sem queixa. Método: a amostra foi composta de 44 professores. Utilizou-se uma icha com dados
pessoais e proissionais, três questionários referentes aos aspectos vocais e dois questionários para
dados relacionados à emoção, sobretudo ansiedade, além da coleta de voz para análise perceptivo
--auditiva. Os grupos foram divididos a partir do número de sintomas relatados, estabelecendo um
número de 22 voluntários no grupo de Professores Sem Queixa (PSQ) e 22 no grupo Professores Com Queixas (PCQ), sendo deste grupo, os indivíduos que relataram mais de três sintomas vocais.
Os dados foram analisados estatisticamente. Resultados: a média do número de sintomas
descri-tos no QSSV foi de 5,7 (±2,8) para os PCQ e de 0,8 (±0,9) para os PSQ. Os PSQ referiram uma melhor autoavaliação vocal (p= 0,01) e os PCQ airmaram possuir um maior comprometimento em sua voz (p= 0,001). O grupo PSQ obteve os maiores valores nos escores do QVV-Físico (p=0,0007) e QVV-Total (p= 0,0006). Os PCQ obtiveram maiores valores no IDV-Total (p=0,0003) e IDV-Orgânico
(p=0,0006), e um maior comprometimento emocional, com SRQ de 5,7 (±3,9) e IDATE42,5 (±12,7).
pre- REFERENCES
1. Servilha EAM, Pereira PM. Condições de trabalho,
saúde e voz em professores universitários. Rev. Ciên. Med. 2008;17(1):21-31.
2. Grillo MHMM, Penteado RZ. Impacto da
voz na qualidade de vida de professore(a)s do
ensino fundamental. Pró-Fono R. Atual. Cient.
2005;17(3):321-30.
3. Jardim R, Barreto SM, Assunção AA. Condições de
trabalho, qualidade de vida e disfonia entre docentes. Cad. Saúde Pública. 2007;23(10):2439-61.
4. Azevedo LL, Vianello L, Oliveira HGP, Oliveira IA, Oliveira BFV, Silva CM. Queixas vocais e grau de disfonia em professoras do ensino fundamental.
Rev Soc Bras Fonoaudiol. 2009;14(2):192-6. 5. Jung, CR. O estresse e a voz, [Monograia].
Porto Alegre: Centro de Especialização em Fonoaudiologia Clínica – CEFAC; 1999.
6. Ramig L, Verdolini K. Treatment eficacy:
voice disorders. J. Speech Lang. Hear. Res.
1998;41(1):101-6.
7. Orlova OS, Vasilenko IS, Zakharova AF, Samokhvalova LO, Kozlova PA. The prevalence, causes and speciic features of voice disturbances in teachers. Vestn. Otorrinolaringol. 2000;5:18-21. 8. Almeida AAF, Behlau M, Leite JR. Correlação
entre ansiedade e performance comunicativa. Rev
Soc Bras de Fonoaudiol. 2011;16(4):384-9.
9. Behlau M. Voz – O livro do especialista. Volume
I. Rio de Janeiro: Editora Revinter, 2008.
10. Roy N, Merrill RM, Thibeault S, Gray SD,
Smith EM. Voice disorders in teachers and the
general population: effects on work performance,
attendance, and future career choices. J Speech
Lang Hear Res. 2004;47(3):542-51.
11. Zambon F, Behlau M, Roy N. Considerações
Preliminares sobre um Levantamento Epidemiológico Brasileiro de Distúrbios Vocais em
Professores. In: 36th Annual Symposium: Care of
the Professional Voice. Philadelphia : The Voice
Foundation, 2007.
12. Gasparini G, Behlau M. Quality of life: validation
of the brazilian version of the voice-related quality of life (V-RQOL). J Voice. 2009;23:76-81.
13. Behlau M, Santos LMA, Oliveira G. Cross-cultural adaptation and validation of the voice handicap index into brazilian Portuguese. J Voice. 2009;25(3):354-9.
14. Biaggio AMB, Natalício L. Manual para o Inventário de Ansiedade Traço-Estado (IDATE). Rio
de Janeiro: Centro Editor de Psicologia Aplicada
(CEPA); 1979.
15. Mari JJ, Williams P. A validity study of a Psychiatric Screening Questionnaire (SRQ-20) in primary care in the city of São Paulo. Br J Psychiatr
1986;148:23-6.
16. Oiticica MLGR; Gomes, MLB O estresse
do professor acentuado pela precariedade das condições acústicas das salas de aula. XXIV
Encontro Nac. de Eng. de Produção – Florianópolis,
SC, Brasil, 03 a 05 de nov de 2004.
17. Costa, DB. Lima, ILB; Almeida, LNA; Bandeira, RN; Andrade, WTLA. O ruído como agente diicultador da atuação dos professores em salas
de aula de uma universidade pública do estado da
Paraíba. 26º Encontro Internacional de Audiologia, Maceió-Al, Brasil, 17 a 20 de abril de 2010.
18. Park K, Behlau M. Perda da voz em
professores e não professores. Rev Soc Bras
Fonoaudiol. 2009;14(4):463-9.
19. Luchesi KF, Mourão LF, Kitamura S. Ações
de promoção e prevenção à saúde vocal de
professores: uma questão de saúde coletiva. Rev. Cefac. 2010;12(6): 945-53.
20. Silverio KCA, Gonçalves CGO, Penteado
RZ, Vieira TPG, Libardi A, Rossi D. Ações em
saúde vocal: proposta de melhoria do peril
vocal de professores. Pró-Fono R. Atual. Cient.
2008;20(3):177-82.
21. Silva EF. A voz dentro da relação psíquico-orgânica: estudo sobre a inluência das emoções
na voz do ator. R.cient./FAP. 2009;4(1):1-19. 22. Gomes GF, Filho EDM, Coelho JCU, Salvalaggio PRO, Sebastião APM, Suzana DG. Achados histológicos na parede posterior da laringe em
pacientes com reluxo gastroesofageano (GERD). Rev. Bras. Otorrinolaringol. 2001;67(6):770-4.
23. Oliveira, IB Almeida AAF, Raize T. Voz
Proissional: produção cientíica da Fonoaudiologia
brasileira. São Paulo: Sociedade Brasileira de
Fonoaudiologia, 2008. Disponível em <http://www.
sbfa.org.br/portal/voz_profissional/index.htm> Acessado em Janeiro de 2012.
Received on: July 12, 2012 Accepted on: April 01, 2013
Mailing address:
Anna Alice Figueirêdo de Almeida
Universidade Federal da Paraíba, Centro de Ciências da Saúde
Departamento de Fonoaudiologia
Cidade Universitária – Campus I – Castelo Branco
João Pessoa – PB – Brasil
CEP: 58051-900