1. Departamento de Ciência do Desporto da Universidade de Trás-os-Mon-tes e Alto Douro, Vila Real, Portugal.
2. Funorte – Faculdades Unidas do Norte de Minas Gerais, Montes Cla-ros, Brasil.
3. Corpo de Bombeiros Militar de Minas Gerais. Approved in 22/ 11/ 06.
Correspondence to: António José Silva, Universidade de Trás-os-Montes e Alto Douro, Departamento de Desporto, CIFOP, Rua Dr. Manuel Cardona – 5000 – Vila Real, Portugal. E-mail: [email protected]
Mathematical modeling analysis of the performance
evolution along the career-span of female swimmers
António José Silva3, Daniel Marinho1, Isabel Mourão-Carvalhal1, Mário Durão1, Victor Reis1, André Carneiro1,2 and Felipe Aidar1,3
O
RIGINALA
RTICLEKeywords: Growth and maturation. Results. Training. Puberty. ENGLISH VERSION
Concerning motor learning, the movements tend to be performed through tasks selection(8). It would be defined as the planning for action and be represented through the movement(9). Another im-portant point to be highlighted is that the presentation of a model, especially if the presentation is controlled by the learner him/her-self, enables superior learning than that controlled by the techni-cian(18-19).
Finally, one can highlight another factor which has received at-tention from researchers in the motor learning field: the establish-ment of goals(20).
Within this context, we tried in this study, based on the analysis of the growth rate of the sports results in Portuguese female swim-mers, from the initial sports education until the stage of high level performance, to reflect on the influence that the growth and mat-uration processes have in the female swimmers results, with the purpose to better structure, organize and control the training pro-cess for female swimmers.
METHODOLOGY
Sample characterization
The sample consisted of the ten best times from all events from the Olympic calendar, in 25 and 50 meter-swimming pools, from the national rankings from 1997/1998 until 2000/2001, reached by all swimmers of all formation and training groupings in the female gender. The adopted procedures are according to the Helsinki Dec-laration, 1975, and were approved by the scientific committee of the UTAD (Universidade de Trás-os-Montes e Alto Douro) for its performance (resolution 1273/03).
ABSTRACT
Children and youth sports performance should always conside-rer the growth and maturation processes(1), and their influence in the growth rate of results along the sports career. In this extent, the purpose of this work was to study, on one hand, the growth rate of results in all swimming events of female Olympic calendar from the initial sports education till the stage of high level perfor-mance and, on the other hand, try to establish a relationship with the growth, maturation and training process of female swimmers. For this purpose a sample constituted by female swimmers in Por-tuguese swimming Rankings over the last four years (1998 to 2002) in an approximately amount of 6,000 data was used. The growth rate of results (GRR) was calculated based in the following algo-rithm: (initial time-final time) / initial time. The results pointed out, let us conclude that: (i) a general tendency of GRR. Increasing was verified from 11 to 12 years and from 14 to 16 years in 25 m swim-ming pool; (ii) a similar tendency was verified in 50 m swimswim-ming pool, but with superior GRR tendencies. Those results can be ex-plained, more than by the training process, by the growth, devel-opment and maturation process.
INTRODUCTION
Correct orientation on the training process in its different stag-es, the loads dimension, the set of the training means and meth-ods and respective contents, should be programmed considering the processes and growth age of several organs and systems of young female athletes who have differentiated rhythms, namely those which are main support to swimming demands as a modal-ity. According to Hahn(2), at 10/11 years of age children present a very significant evolution in their motor learning skills, differentia-tion/control and balance, as well as velocity, acquisition and stabi-lization of motor tasks mainly based on action an reaction(3-5), asso-ciated with the development of the central nervous system and maturation of several physiological links of the conditional system (6-9), being it a privileged stage for the technical training, and
appro-priate stimulation tends to produce better results(10). Muscular de-velopment follows a similar pattern to bone dede-velopment. The muscle fibers increase in size but not in number, throughout child-hood and adolescence(11-14). Annual improvement in strength and power with peaks which are reached when they are around 16 is observed(15). Up to 12 years of age the aerobic metabolism is more developed than the other ones(16-17).
TABLE 1
Age groupings used in the study’s sample
Year 1 Year 2 Year 3 Year 4
Grouping 3 G6-G5 G6-G5 G6-G5 G6-G5
1988-1987 1989-1988 1990-1989 1991-1990
Grouping 2 G4-G3 G4-G3 G4-G3 G4-G3
1986-1985 1987-1986 1988-1987 1989-1988
Grouping 1 G2-G1 G2-G1 G2-G1 G2-G1
1984 1985 1986 1987
Jun. /Sen 1983 and 1984 and 1985 and 1986 and
older older older older
Procedure
Mathematical modeling for optimum age for best results
The mathematical model proposed by Van Tilborgh et al.(21-22) was applied with six defined stages for the calculation of the evolution rate of the sports results by techniques and distance grouping:
Stage 1: Calculation of a constant (Cevent) specific for each event for later calculation, considering each individual time of a punctua-tion. The punctuation system is based on a function which respects a mathematical modeling, in which the Absolute National Record (ANR) for each event, gender and swimming pool receives 1000 points;
Stage 2: Relativization of the event punctuation according to
the chosen age group, so that punctuation corresponds to a given time in an age group, either by a side coherent with the embar-rassment which is provided by the absolute national record in the mentioned event, and or coherent with the age in which this time is obtained. Therefore, the use of the mean of the 10 best female swimmers picked from the updated rankings charts of the Portu-guese Swimming Federation (FPN) is crucial. Having this value, the punctuation formula was applied and an absolute punctuation was obtained;
Stage 3: Ending of the upper part of the curve, above 18 years
of age, once, especially in men, the generalization of the absolute national records is obtained above this age. The age which will have the 1000 points (maximal corresponding to the absolute na-tional record obtained) is calculated through a linear regression model, in the 5 known data pairs (age and punctuation);
Stage 4: Use of the mean of the 10 best swimmers of the
abso-lute ranking for the event considered, and later conversion for the same punctuation, indexing this value to the pairs of values of the age groups;
Stage 5: Based on the previous considerations, a new
regres-sion line (second polynomial degree) is calculated, being this line considered as the 100%;
Stage 6: Finally, the model calculates the individual performance (punctuation) based on the respective age groups. Individual time is converted for a punctuation. The exact punctuation correspond-ing to age is then calculated in percentage uscorrespond-ing the age in the regression equation.
Modeling for the calculation of the growth rate (%) of the sports results and their modeling
After the outliers derived from the exploratory analysis have been expurgated the following algorithm: (Initial time-Final time)/Initial time*100 was applied for the calculation of the evolution rate per individual event.
The curve modeling considering the application of several poly-nomial units was performed in order to estimate the growth rate behavior of the sports results concerning the different age seg-ments. An embarrassment to the modeling was introduced, corre-sponding to value in abscise of the optimum age of the sports result obtained, based on the mathematical algorithm application presented in the previous stage.
The adjustment quality evaluation was performed through two criteria: i) the value of the determination coefficient (R2), being the highest value chosen and considered as one of the indicators of the sample’s quality; ii) the estimate error, which measures the dispersion of the adjustment performed.
When the mathematical modeling of the growth curves of the sports results is applied, and the embarrassment which has been calculated in the previous point is included, we can obtain different types of adjustment according to the degree of the polynomial unit chosen.
Thus, the choice of the most suitable polynomial unit lied on the one which in the different segments of the curve presented lower residue value, allowing hence being more certain in the prediction of results.
RESULTS
Optimum age for sports results
Table 2 shows the results of the analysis of the rankings for female swimmers, with calculation of the respective age for the best times per event.
TABLE 2
Results of the analysis of the rankings and application of the mathematical model for the female swimmers
Event Linear adjustment Best time Equation of the equation (age/points) predictable relationship % between
age age and performance
100 L Y = 69.93 * age – 334.47 19.45 y = –6.135 * (age)² + 228.92 * (age) – 1343.7
200 L Y = 72.425 * age – 333.66 18.42 y = –6.372 * (age)² + 239.95 * age – 1407.2
400 L Y = 75.19 * age – 348.15 17.93 y = –8.0713 * (age)² + 287.73 * age – 1712
100 m Br Y = 69.93 * age – 334.47 19.09 y = –6.1135 * (age)² + 228.92 * age – 1343.7
200 m Br Y = 90.75 * age – 613.18 17.78 y = –10.785 * (age)² + 373.33 * age – 2418.5
100 m C Y = 65.888 * age – 281.46 19.45 y = –5.56438 * (age)² + 212.4 * age – 1221.9
200 m C Y = 84.03 * age – 550.09 18.45 y = –9.6151 * (age)² + 338.4 * age – 2189.1
100 m Mar. Y = 83.467 * age – 502.55 18.00 y = –9.2171 * (age)² + 325.95 * age – 2057.3
200 m Mar. Y = 104.17 * age – 865.09 17.9 Y = –9.7817 * (age)² + 362.48 x – 2526.7
200 m Est. Y = 77.7 * age – 396.58 17.98 y = –7.0165 * (age)² + 261.58 * age – 1571.7
400m Est. Y = 102.19 * age – 733.15 16.96 y = –13.763 * (age)² + 464.99 * age – 3062.4
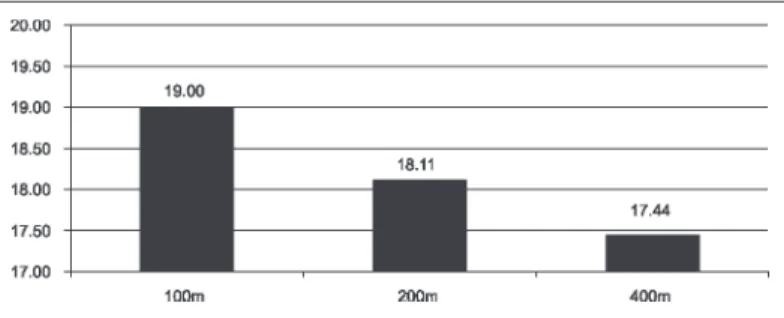
Table 3 analyses events groupings by distance criterion, with calculation of the respective age, mean of the best times per event.
TABLE 3
Mean results of the analysis of the rankings and application of the mathematical model by style and distance
Butterfly Backstroke Breaststroke Crawl Styles Mean ± SD
100 m 18,0 19.45 19.09 19.45 18.99 ± 0.68 200 m 17.9 18.45 17.78 18.42 17.98 18.10 ± 0.30
400 m 17.93 16.96 17.44 ± 0.68
Based on the analysis of the obtained results, we are able to verify that in Portugal, and whenever female swimmers are con-sidered, they tend to obtain their best times earlier the longer the distance of the event.
Growth curves by distance and curve modeling with embarrassment obtained in model 1
In the following figure we can observe the results which de-rived from the analysis of the rankings for the female swimmers,
with the calculation of the growth rate of the sports results marks per event.
After the analysis of this figure concerning the growth rate of the sports results by grouping of swimming distances, a curve with two growth peaks was verified: i) one between 11-12 years of age; ii) from this age on a decrease of the values of the growth rate is verified with a new growth peak at 14-15 years of age.
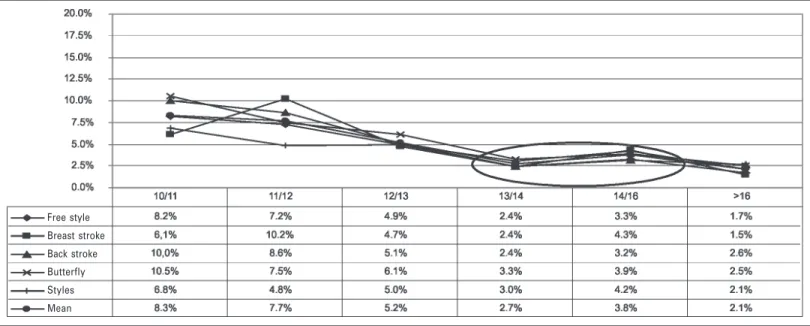
When the evolution of the sports results in the different tech-niques in 25 m and 50 m swimming pools is analyzed (figures 3 and 4), a similar trend is observed both in short (25 m) and long swimming pools (50 m). However, a trend of higher growth is ver-ified in a 50 m swimming pool, both at 11-12 years and at 14-15 years.
When the mathematical model of the growth curves of the sports results was applied, and the embarrassment which was calculated in the previous point is included, we can obtain different types of adjustment according to the degree of the chosen polynomial unit. Thus, the choice of the most suitable polynomial unit laid on the one in which the different segments of the curve presented lower residue value, allowing us to be more certain in the prediction of results. The total chart of the modeling equations obtained for the different groupings of distance and one explanatory example of the chart obtained by the mathematical modeling were presented.
Figure 3 – Representative chart of the increment rate of the outcomes in the different techniques in short swimming pool (25 meters) Free style
Breast stroke
Back stroke
Butterfly
Styles
Mean
Figure 4 – Representative chart of the increment rate of the outcomes in the different techniques in 50-meter swimming pool Free style
Breast stroke Back stroke Butterfly Styles Mean
Figure 2 – Chart of the mean values of growth rate (years) of the sportive outcomes throughout the ages and by grouping of swimming distances, for the female sex
Percentage evolution
Years
DISCUSSION
In females, the age in which the best scores were obtained is earlier than the one verified for males; such fact has also been described in the literature(23-26). It is also more probable in females the occurrence of motor talents, with extreme skill at the main functional systems associated with particularities of the biological development which enable the reaching of high sports practices 1 to 3 years earlier than the optimum ages established. Such fact may not only be observed in long distance modalities (400 and 800 m) but also in the velocity ones (100 and 200 m).
Therefore, as well as it can be observed by the analysis of figure 2, there are two well-defined periods of remarkable increase of the growth rate in the sports results by event distance, fact also described in the literature(23-26).
The first stage, which occurs between 11 and 12 years of age, can be explained as a phase in which both training and motor
apti-tude are very significant in the motor learning capacities, differen-tiation/control, balance(2) as well as velocity, acquisition and stabili-zation of motor tasks(3), associated with the development of the central nervous system and the maturation of several physiologi-cal links of the conditional system(6).
The second stage, which occurs between 14 and 15 years of age, can be explained by clear manifestation in this age of the be-ginning of the maximal exponent of muscular development(11-12), promoting a strength and power improvement peak(15), as well as the end of ossification(27-28).
Motor control acquisition would be characterized as the result of the dynamic interaction of several subsystems in a particular context(13). Such viewpoint proposes a non-linear rhythm of devel-opment, with differences between individuals(14).
This justification of the different stages of formation and differ-entiation of the body’s systems may partly justify the mean values of the growth rates (years) of the sports results along the ages and by swimming distances grouping, for females, as presented in fig-ure 2.
Concerning the differences found in the evolution of the sports results between long and short swimming pools, the most remark-able growth rate increase of the sports results between 11 and 12 years of age, in 50 m pool, may derive from the laps. It is known that the determinant factor of laps’ success, besides the issues associated with technique accuracy, has to do with power during the contact phase. The smaller the number of laps in an event in these ages in which the muscle-skeletal system in structural and functional terms is still developing, the higher the probability for the event time to be determined by the free style, a fact which is verified in a 50 m pool. However, there are not relevant data in the reference and consulted literature which allows us compare our evolution results with other obtained in other studies.
When the optimum ages of the sports results for the female swimmers are verified, they tend to obtain their best times earlier the longer the distance of the event, which is according to the most of the biography of world level swimmers who obtained the best results (times) at early ages(23,32).
Higher growth rates of the results in longer events are seen in earlier ages (between 11 and 12 years), while in shorter events the results increase closer to 14-16 years of age(23,32).
On the other hand, the relationship between the kids’ anthropo-metrical characteristics and motor development shows that child’s weight and height changes are associated with changes in the prop-erties of the musculo-skeletal system, including tonus and strength(12,17).
During the maturation process the individual experiments body manifestations such as increase of stiffness which is influenced by alterations in muscular co-contraction(29).
According to Maglisho(30), the longer the events, the lower the contribution of the lactic and anaerobic energy sources, and con-sequently the higher the aerobic contribution. The reason for fa-tigue in short events is the inability to keep velocity high due to muscular phosphate creatine reserves depletion as well as the in-ability to make the anaerobic metabolism operational fast enough. Fatigue in middle and long distance events is caused by the acido-sis caused by the lactate accumulation. Thus, higher increase in longer events in these ages may be due to aerobic metabolism be more developed than the others(27-28,31), which will increase during childhood and adolescence through the increase of the amount of glycogen stored in the muscles and lower concentration of phos-phocreatine(16). Lower increase in shorter events is due to the low capacity of performing anaerobic work before puberty, as well as the too low lactate tolerance level(30,32).
Higher rates of increase from the 14 to 16 years in shorter events may be explained since these events require greater energy mobi-lization through the anaerobic way than longer events. Anaerobic capacity is more developed in this age group(27,33) because in this
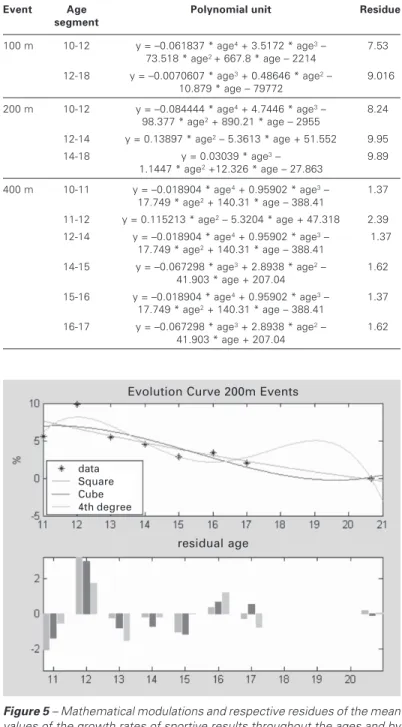
TABLE 4
Results of the mathematical modeling by event distance and age segment, for the female gender
Event Age Polynomial unit Residue
segment
100 m 10-12 y = –0.061837 * age4 + 3.5172 * age3 – 7.530
73.518 * age2 + 667.8 * age – 2214
12-18 y = –0.0070607 * age3 + 0.48646 * age2 – 9.016
10.879 * age – 79772
200 m 10-12 y = –0.084444 * age4 + 4.7446 * age3 – 8.240
98.377 * age2 + 890.21 * age – 2955
12-14 y = 0.13897 * age2 – 5.3613 * age + 51.552 9.950
14-18 y = 0.03039 * age3 – 9.890
1.1447 * age2 +12.326 * age – 27.863
400 m 10-11 y = –0.018904 * age4 + 0.95902 * age3 – 1.370
17.749 * age2 + 140.31 * age – 388.41
11-12 y = 0.115213 * age2 – 5.3204 * age + 47.318 2.390
12-14 y = –0.018904 * age4 + 0.95902 * age3 – 1.37
17.749 * age2 + 140.31 * age – 388.41
14-15 y = –0.067298 * age3 + 2.8938 * age2 – 1.620
41.903 * age + 207.04
15-16 y = –0.018904 * age4 + 0.95902 * age3 – 1.370
17.749 * age2 + 140.31 * age – 388.41
16-17 y = –0.067298 * age3 + 2.8938 * age2 – 1.620
41.903 * age + 207.04
Figure 5 – Mathematical modulations and respective residues of the mean values of the growth rates of sportive results throughout the ages and by grouping of the swimming distances (an example for the 200 m events)
data Square Cube 4th degree
Evolution Curve 200m Events
period the beginning of the maximal exponent of muscular devel-opment is verified in girls(11-12), which promotes the strength and power improvement peak around 16 years(15). This fact also justi-fies the increase of the maximal blood lactate level up to 14/15 years(30).
CONCLUSIONS
The conclusions concerning the proposed aims are respective-ly: (i) the results demonstrated the need to reside the training pro-cess in specific capacities of each maturational phase referred in the bibliographical review, once improvement of the sports results in each event have been confirmed in their specific requirements; (ii) the literature review joined with the results indicators of the training process for different scales (increasing rates), show us that the results are closely connected with the growth, maturation and development processes and their maximal development peri-ods; (iii) the results show the need to limit the training process to the optimum periods of the development of the several condition-al and coordinative capacities, so that a whole limited to the indi-vidual according to her personal characteristics evidenced during growth can be built.
Concerning optimum ages for sports results, we concluded that a rational structure of the sports career is needed, with the pur-pose to reach better sports results, to mediate between 8-10 years, justifying hence, the structure change of the sports program in the long and medium run, so that: i) the training process structure close-ly corresponds to individual particularities of the swimmers (long distance, middle distance and sprint); ii) a redirecting of the train-ing contents and its magnitude in the existtrain-ing conditiontrain-ing is veri-fied; iii) measures for special promotion and institutional placement become available in the specificities of the sports preparation.
Concerning the growth rate of the sports results and its model-ing, we may conclude that there are factors associated with the growth, development and maturation processes beyond the natu-ral changes which derive from the training process, which help to explain the results changes. Moreover, we observed that the sports training process tends to start at ages even earlier in swimming, and the child’s maturation occurs earlier due to the training pro-cess. Besides that, life quality has improved, eating habits and health public services are better.
More emphatic conclusions on the predominance of each of these components (training and biological factors) should consider other variables, such as the training time, the beginning of the train-ing process and the structurtrain-ing of the traintrain-ing process, among oth-ers.
As far as we are concerned, this study is one the first in this field, thus, it presents some limitations. One of the most impor-tant is the concurrent non-validation of the results which derive from the mathematical modeling with real growth curves in the training process during more than one sports stage. Nevertheless, some suggestions are crucial for future investigations: i) correc-tion of the curve values in the swimmers’ maturacorrec-tion levels evalu-ated (early, normal and late), inferring corrections in the growth curve of the sports results; ii) comparison of the values obtained for event and stage of sports outlining with real values which de-rive from the follow-up of one or more training stages.
All the authors declared there is not any potential conflict of inter-ests regarding this article.
REFERENCES
1. Malina R. Biological maturity status of young athletes. Young athletes. Biologi-cal, psychological and educational perspectives. Champaign, Illinois: Human Ki-netics Books, 1988.
2. Hahn E. Teoría del entrenamiento. Posibilidades y riesgos del entrenamiento con niños, cap. 2. Entrenamiento con ninõs. Teoria, práctica, problemas especí-ficos. Barcelona: Deportes Técnicos, Ediciones Martinez Roca, 1988;62-95.
3. Hommel B, Musseler J, Aschersleben G, Prinz W. The theory of event coding (TEC): a framework for perception and action planning. Behav Brain Sci. 2001; 24(5):849-78.
4. Knoblich G, Flach R. Predicting the effects of actions: interactions of perception and action. Psychol Sci. 2001;12(6):467-72.
5. Mechsner F, Kerzel D, Knoblich G, Prinz W. Perceptual basis of bimanual coordi-nation. Nature. 2001;414(6859):69-73.
6. Shephard R. Physical activity and growth. Chicago /London: Year Book Medical Publishers, Inc., 1982.
7. Deshpande N, Patla AE. Dynamic visual-vestibular integration during goal direct-ed human locomotion. Exp Brain Res. 2005;166(2):237-47.
8. Kunde W. Response-effect compatibility in manual choice reaction tasks. J Exp Psychol Hum Percept Perform. 2001;27(2):387-94.
9. Johnson SH. Thinking ahead: the case for motor imagery in prospective judge-ments of prehension. Cognition. 2000;10;74(1):33-70.
10. Fogassi L, Ferrari PF, Gesierich B, Rozzi S, Chersi F, Rizzolatti G. Parietal lobe: from action organization to intention understanding. Science. 2005;308(5722): 662-7.
11. Saltin B, Gollnick P. Skeletal muscle adaptability: significance for metabolism and performance. Handbook of Physiology. Baltimore: Waverly Press, 1983;555-632.
12. Adolph KE, Avolio AM. Walking infants adapt locomotion to changing body di-mensions. J Exp Psychol. 2000;26(3):1148-66.
13. Clark JE, Phillips SJ. A longitudinal study of intralimb coordination in the first year of independent walking: a dynamic systems analysis. Child Dev. 1993;64(4): 1143-57.
14. Smith LB, Thelen E. Development as a dynamic system. Trends Cogn Sci. 2003; 7(8):343-8.
15. Beunen G, Malina M. Growth and physical performance relative to the timing of the adolescent sport. In: Pandolf KB, editor. Exerc Sport Sci Rev. 1988;16:503-40. New York: Mcmillan.
16. Bar-Or O. Some notes on physiological and medical considerations of exercise and training of children. In: Binkhorst RA, Kemper HCG, Saris WHM, editors. International series on sports sciences: Vol. 15. Children and Exercise XI (pp. 356-353). Champagn, IL: Human Kinetics; 1985.
17. Bartlett DJ. Relationship between selected anthropometric characteristics and gross motor development among infants developing typically. Pediatr Phys Ther. 1998;10:114-9.
18. Wrisberg CA, Pein RL. Note on learners’ control of the frequency of model pre-sentation during skill acquisition. Percept Mot Skills. 2002;94(3 Pt 1):792-4. 19. Wulf G, Gartner M, McConnel N, Schwartz A. Enhancing the learning of sport
skills through externalfocus feedback. J Mot Behav. 2002;34(2):171-82. 20. Ugrinowitsch H, Dantas LEPBT. Efeito do estabelecimento de metas na
aprendi-zagem do arremesso do basquetebol. Revista Portuguesa de Ciências do Des-porto. 2002;2:58-63.
21. Van Tilborgh L. Stuw- en remkrachten bij schoolslagzwemmers: berekening uit filmanalyse (Propulsion and drag forces in breaststroke swimmers: calculation from film analysis). (Doctoral Thesis Physical Education and Appendices). Leu-ven: K.U.Leuven; 1987.
22. Van Tilborgh L, Willems EJW, Persyn U. Estimation of breaststroke propulsion and resistance resultant impulses from film analysis. In: Ungerechts B, Wilke K, Reischle K, editors. Swimming science V (International series on sport sciences 18), Champaign (Ilinois): Human Kinetics, 1988;67-72.
23. Platonov VN, Fessenko SL. Los sistemas de entrenamiento de los mejores na-dadores del mundo. Iyll. Barcelona: Paidotribo, 1994.
24. Sambanis M, Kofotolis N, Kalogeropoulou E, Noussios G, Sambanis P, Kalog-eropoulos J. A study of the effects on the ovarian cycle of athletic training in different sports. J Sports Med Phys Fitness. 2003;43(3):398-403.
25. Stafford DE. Altered hypothalamic-pituitary-ovarian axis function in young fe-male athletes: implications and recommendations for management. Treat Endo-crinol. 2005;4(3):147-54.
26. Ivkovic A, Bojanic I, Ivkovic M. The female athlete triad. Lijec Vjesn. 2001;123 (7-8):200-6.
27. Wilmore J, Costill D. Part G, Special populations in sport exercise. Growth, de-velopment and the young athlete, cap. 17. Physiology of sport and exercise. Champaign, Illinois: Human Kinetics Books, 1994;402-20.
28. Karahan M, Erol B. Muscle and tendon injuries in children and adolescents. Acta Orthop Traumatol Turc. 2004;38(Suppl 1):37-46.
29. Stricker PR. Sports training issues for the pediatric athlete. Pediatr Clin North Am. 2002;49(4):793-802.
30. Holt KG, Butcher R, Fonseca ST. Limb stiffness in active leg swinging of chil-dren with spastic hemiplegic cerebral palsy. Pediatr Phys Ther. 2000;12:50-61. 31. Maglischo E. Swimming even faster. Mountain View California: Mayfield
Pub-lishing Co., 1982.
32. Farrow D, Young W, Bruce L. The development of a test of reactive agility for netball: a new methodology. J Sci Med Sport. 2005;8(1):52-60.