Quality of life in voice, perceptual-auditory assessment and
voice acoustic analysis of teachers with vocal complaints
Qualidade de vida em voz, avaliação perceptivoauditiva e análise
acústica da voz de professoras com queixas vocais
Carla Aparecida Cielo1, Vanessa Veis Ribeiro1, Gabriele Rodrigues Bastilha1, Nilvana de Oliveira Schilling2
ABSTRACT
Purpose: Correlating the Voice-Related Quality of Life (VRQOL), perceptual-auditory and acoustic assessment of teachers with vocal complaints. Methods: The study included 74 teachers aged between 20 and 62 years (mean 38.75 years). Self-assessment of VRQOL, voice perceptual-auditory assessment, acoustic voice analysis of glottal and spectrographic source, in narrowband (NB) and wideband (WB) and re-levant statistical analysis were carried out. Results: There was a negative correlation between VRQOL and fundamental frequency (f0), maximum f0 and standard deviation of f0; roughness and amplitude variation. There was a positive correlation between VRQOL and darkening of the tracing around the vocal spectrogram, definition and number of harmo-nics in NB; overall degree of vocal and soft phonation index, presence of noise at high frequencies in the WB; overall degree of vocal disorders, darkening the 1st formant and higher definition of the 2nd formant in WB; breathiness and percentage jitter, absolute jitter, relative average of perturbation, smoothed pitch perturbation quotient, pitch perturbation quotient, soft phonation index, presence of noise at high frequencies in WB, replacement of harmonics by noise at high frequencies and all spec-trogram in NB. Conclusion: The lower the f0, the greater the darkening tracing spectrographic, definition and number of harmonics, the higher the VRQOL related to voice. The perceptual-auditory and acoustic analysis showed significant correlations for the presence of aperiodic energy and instability of vocal signal. The perceptual-auditory, acoustic and VRQOL assessments were complementary in vocal characterization of teachers.
Keywords: Voice disorders; Faculty; Voice quality; Quality of life; Voice
RESUMO
Objetivo: Correlacionar a qualidade de vida em voz (QVV), avaliação vocal perceptivoauditiva e acústica de professoras com queixas vocais.
Métodos: Participaram do estudo74 professoras com idades entre 20 e 62 anos (média 38,75 anos). Foram realizadas autoavaliação da QVV, avaliação vocal perceptivoauditiva, análise vocal acústica de fonte gló-tica e espectrográfica, em banda estreita (EBE) e banda larga (EBL) e análise estatística pertinente. Resultados: Houve correlação negativa entre QVV e frequência fundamental (f0), f0 máxima e desvio padrão da f0; rugosidade e variação da amplitude. Ocorreu correlação positiva entre QVV e escurecimento do traçado em todo o espectrograma vocal, definição e número de harmônicos em EBE; grau geral de alteração vocal e índice de fonação suave, presença de ruído nas altas frequências na EBL; grau geral de alteração vocal, escurecimento do 1º formante e maior definição do 2º formante na EBL; soprosidade e jitter percentual,
jitter absoluto, média relativa da perturbação, quociente de perturbação do pitch suavizado, quociente de perturbação do pitch, índice de fonação suave, presença de ruído nas altas frequências em EBL, substituição de harmônicos por ruído nas altas frequências e em todo espectrograma em EBE. Conclusão: Quanto menor a f0, maior o escurecimento do traçado espectrográfico, definição e número de harmônicos, maior a QVV relacionada à voz. As análises perceptivoauditiva e acústicas mos-traram correlações importantes quanto à presença de energia aperiódica e instabilidade do sinal vocal. As avaliações acústica, perceptivoauditiva e de QVV relacionada à voz foram complementares na caracterização vocal das docentes.
Descritores: Distúrbios da voz; Docentes; Qualidade da voz; Qualidade de vida; Voz
This study was performed at the Graduate Program in Human Communication Disorders, Universidade Federal de Santa Maria – UFSM – Santa Maria (RS), Brazil. (1) Graduate Program in Human Communication Disorders, Universidade Federal de Santa Maria – UFSM – Santa Maria (RS), Brazil.
(2) Clinical Speech Pathologist, Palmeira das Missões (RS), Brazil.
Funding: Coordenação de Aperfeiçoamento de Pessoal de Nível superior (CAPES).
Conflict of interest: No
Authors’ contribution: CAC conception and design of the study, interpretation of data; drafting the article, revising the article, final approval of the version to be published; VVR conception and design of the study, collection, analysis and interpretation of data; drafting the article; GRB analysis and interpretation of data; drafting the article; revising the article; NOS collection and interpretation of data; drafting the article; revising the article.
Correspondence address: Gabriele Rodrigues Bastilha. Universidade Federal de Santa Maria, Departamento de Fonoaudiologia. Av. Roraima, 1000, Prédio 26, 4º andar, Cidade Universitária, Camobi, Santa Maria (RS), Brazil, CEP: 97105-900. E-mail: [email protected]
INTRODUCTION
The voice is an aspect that reveals the socio-emotional in-formation of the individual, and is considered very important in human and professional relationships(1). When it is related
to the profession, the voice becomes even more important, since it is as a main element of work for part of the workforce of voice professionals. The best known representative of this class is the teacher(2).
The most common vocal complaints in teachers are aphonia, loss of voice, vocal tiredness and fatigue, dry throat, hoarseness, pain in the neck region, throat clearing and variation in vocal production. The most commonly found features in dysphonic individuals are muffled voice and no projection, speak for too long without rest, altered breathing pattern, cervical muscles hypertension, pitch change, becoming higher, suddenly, at the cry, and may be associated with anxiety and stress and other general health problems(2-4).
The activity carried out by teachers is considered risky when associated with unfavorable external and internal factors. Among the internal, they have been incorrect uses vocal and emotional factors and as external factors, the environmental can be cited, including working conditions. All these factors can cause vocal disorders to the teacher and also interfere with its quality of life(2,5).
Whereas the complaints and vocal disorders are often ob-served and pointed out by teachers, perceptual-auditory and acoustic assessments are required in order to detect changes, and application protocols structured to measure the impact of a vocal disorder in daily activities based on the vocal self--perception(6). Among these, the Voice-Related Quality of Life
Protocol (VRQOL) is one of the most widely used(7).
The perceptual-auditory assessment is considered the gold standard of vocal evaluation because characterizes the voice quality and quantifies its deviations and may be associated with the vocal tract physiology of the individual, however, it is also considered subjective, depending on the evaluator’s experien-ce(8,9). Complementary to perceptual-auditory assessment and
considered objective and non-invasive, it has been evaluating the acoustic voice parameters, useful for accurate diagnosis of voice disorders(10,11).
Given the above, this study aimed to correlate the voice--related quality of life, perceptual-auditory assessment and acoustic analysis of teachers voice with vocal complaints.
METHODS
Observational cross-sectional, analytical and quantitative study, carried out according to standard 466/12 of the National Research Ethics Commission, and approved by the Ethics Committee of Universidade Federal de Santa Maria (UFSM) under the Protocol 23081.016945/2010-76. The heads of edu-cational institutions and participants were informed and signed
the Institutional Authorization Form (IAF) and the Informed Consent (IC), respectively.
To select the sample, schools in the urban area of the municipality of Rio Grande do Sul were listed and numbered alphabetically. The list was randomized, setting up a new list by lot, from which a school was excluded every other. Schools that made up the final list, 15 have joined the IAF. Female teachers from primary schools were included, only the urban area, with the presence of vocal complaints, aged over 19 and less than 65 years and joined the IC.
Subjects were excluded that in the interview reported neu-rological, metabolic, endocrine, syndromes and/or psychiatric diseases; structural pathologies or laryngeal disorders; smoking habit or alcohol abuse; history of laryngeal surgery; phonologi-cal and/or otorhinolaryngologiphonologi-cal treatment for voice; allergic, respiratory or gastric crises, or hormonal dysfunction resulting from pregnancy or menstruation on the assessment day; hearing disorders detected in hearing screening.
To apply the sample selection criteria, subjects answered an interview protocol and underwent hearing screening only by airway, by scanning the pure tones in speech frequencies to 25 dB, with audiometer Amplivox® model A260/2011. The screening was held in a room with noise levels below 50 dB, measured by the sound pressure meter Instrutherm® model Dec-480. The subjects who failed the screening were retested and cases that failed again were excluded from the study and referred for full hearing evaluation.
Sixteen teachers were excluded in the interview by reports of endocrine disorders; 14 ones did not pass the hearing scree-ning; seven have done speech therapy and/or otorhinolaryngo-logical treatment for voice; four by smoking and three reports of neurological pathologies. Forty-seven subjects were lost by incomplete data; 40 for not having vocal complaints and three for being male. At the end, the sample consisted of 74 female teachers aged between 20 and 62 years (mean age: 38 years and 9 months), who passed for data collection made by the self-assessment of voice-related quality of life, auditory--perceptual voice assessment, acoustic analysis of glottal and spectrographic source of the voice.
All emissions were captured in quiet place inside the school, with ambient noise below 50 dB, measured by a level meter digital sound pressure, with teachers in the standing position.
For the acoustic analysis, the emission of the sustained vo-wel /a/ in habitual pitch and loudness was collected following a deep breath in maximum phonation time without using the expiratory reserve and, as standard, we used the less time of the vowel /a/ edited among all subjects, excluding the vocal attack and the end of the emission, resulting in a four-second analysis window.
For the perceptual-auditory voice analysis, as well as vowel /a:/ spontaneous speech were collected through the question,
of voice (CAPE-V)(12), which should be carried out in speech
rate, habitual pitch and loudness. The timestamp of sponta-neous speech situation was not controlled. We used the visual--analogue CAPE-V protocol, allowing quantitative analysis(12).
All emissions were captured by professional digital recorder Zoom H4n, with quantization rate of 96 kHz and 96 kHz and 16-bits recording in 50% of the input level. The recorder was placed at an angle of 90° from the mouth of the subject, coupled with a professional microphone BEHRINGER® ECM 8000, with flat frequency capture range of 15-20 kHz, at a distance of four centimeters of the mouth, to emission vowels, and ten centimeters to the emission of phrases and spontaneous speech.
For the acoustic analysis of glottal source, Multi Dimension Voice Program Advanced software (MDVPA) Kay Pentax® with 44 kHz and 16-bits sampling rate was used. We opted for the analysis of measurements in group, seeking greater relia-bility of the data being analyzed: (1) frequency measurements: fundamental frequency (f0); maximum f0 (fhi); minimum f0 (flo); standard deviation of f0 (STD); (2) perturbation mea-surements of f0 at a short-term: relative average perturbation (RAP); percentage jitter (Jitt); absolute jitter (Jita); smoothed pitch perturbation quotient (sPPQ); pitch perturbation quotient (PPQ); coefficient of variation of f0 (vf0); amplitude pertur-bation measurement at a short-term: shimmer in dB (SHDB); shimmer percentage (Shim); coefficient of variation of ampli-tude (vAm); ampliampli-tude perturbation quotient (APQ); smoothed coefficient of variation of amplitude (sAPQ); (4) measures of noise: noise-harmonic ratio (NHR); smooth phonation index (SPI); voice turbulence index (VTI); (5) voice breaking steps: number of voice breaks (NVB); degree of voice breaks (DVB); (6) measures unvoiced segment: degree of unvoiced segment (DUV); number of unvoiced segment (NUV); (7) measures of sub-harmonic segments: numbers of sub-harmonic segments (NSH); degree of sub-harmonic components (DSH).
The spectrographic acoustic voice analysis was held in wideband filter (100 points - 646 Hz) and narrowband (1024 points - 63.09 Hz) with a sampling rate of 11 kHz and 16 bits in 5 kHz resolution, through the Real Time Spectrogram program (RTS) of Kay Pentax®. In espectrogram of wideband (WB), were evaluated: degree of darkening of the formants tracing (F) (1 formant = F1, F2 = Formant 2nd, 3rd Formant = F3, F4 = 4 Formant), high frequency and all the vocal spectrogram; presence of noise (around vocal spectrogram and at high fre-quencies); definition of F (F1, F2, F3 and F4), and regularity of the tracing. In espectrogram of narrowband (NB), the pa-rameters were considered: degree of tracing darkening (high frequency and all vocal spectrogram); presence of noise (from the harmonics in all vocal spectrogram and at high frequencies); replacement noise harmonic (in all vocal spectrogram and at high frequencies); definition of harmonics; regularity of tracing; number of harmonics and the presence of sub-harmonics.
Voice samples and espectrogram without identification of the subject, in random order and with repetition of about 20%
(for assessors reliability analysis), were sent separately for ten judges (five for each analysis) they were not study authors, with at least five years of experience. They also received espectro-gram anchor in wideband and narrowband, considered normal, to guide their judgments(13,14).
The judges were blinded to the study objectives, the gender of the subjects, the replication of emissions and assessments carried out by other speech therapists, only on the average age of the subjects was informed them.
The voice samples were recorded on Digital Versatile Disc (DVD) 52x, 7 GB, with PCM audio format; 96 kHz; 16 bits; mono and converted to waveform extension. In the DVD, each folder correspond to samples of a subject. The judges were asked to listen to the voices many times as necessary, in a quiet ambient and with the computer in the settings: 16-bits, 96 kHz, making the evaluation in accordance with the CAPE-V protocol(12). The loudness parameter has not been evaluated.
Then, statistical analysis was performed to verify the inter--and intra-evaluator reliability in spectrographic perceptual--auditory and acoustic analysis, using the Kappa coefficient. The ratings of the three speech therapists with greater intra--evaluator reliability were considered together, determining the predominant results in each CAPE-V parameter to the voice of each subject and each aspect of the analysis of espectrograms.
To check the voice-related quality of life, the teachers responded to the protocol “Voice-Related Quality of Life (VRQOL)”(7,15,16), composed of ten items covering two areas: the
physical functionality and socio-emotional. They should answer it on a scale from 1 to 5, the frequency at which particular event occurred, where 1 was equivalent to “it never happens and it is not a problem” and 5 “it always really happens and it is a bad problem.” The protocol provides a total score ranging from 0 to 100 (from the worst to the best quality of life) and a score for each area(5,15,16).
Data were statistically analyzed using the Pearson’s correla-tion non-parametric test, adopting the significance level of 5%.
RESULTS
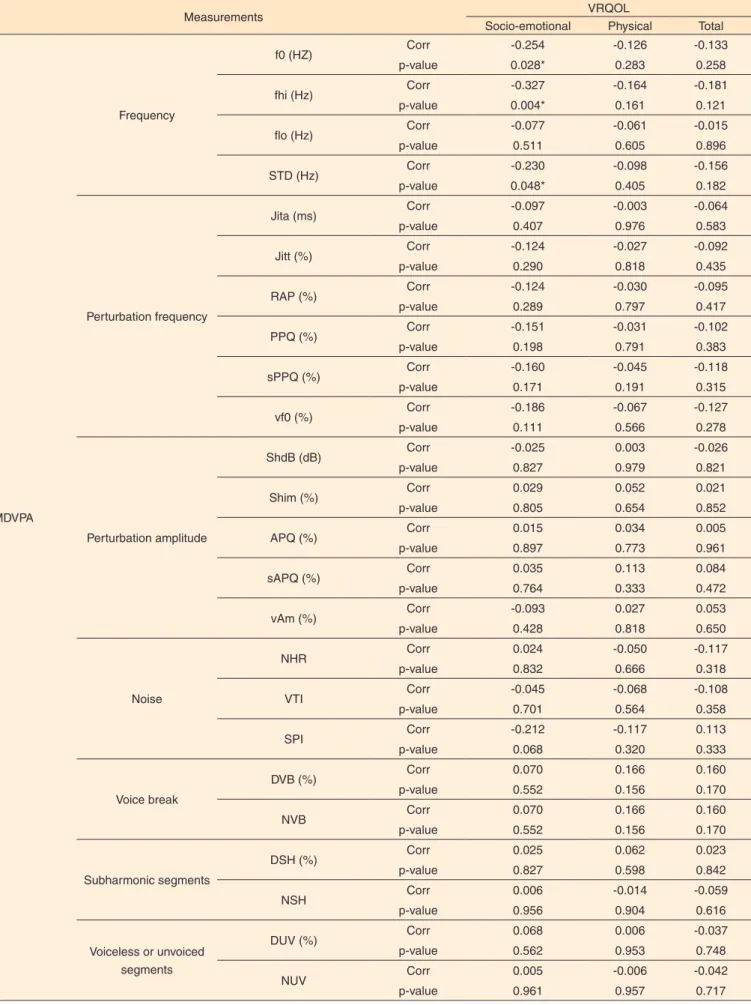
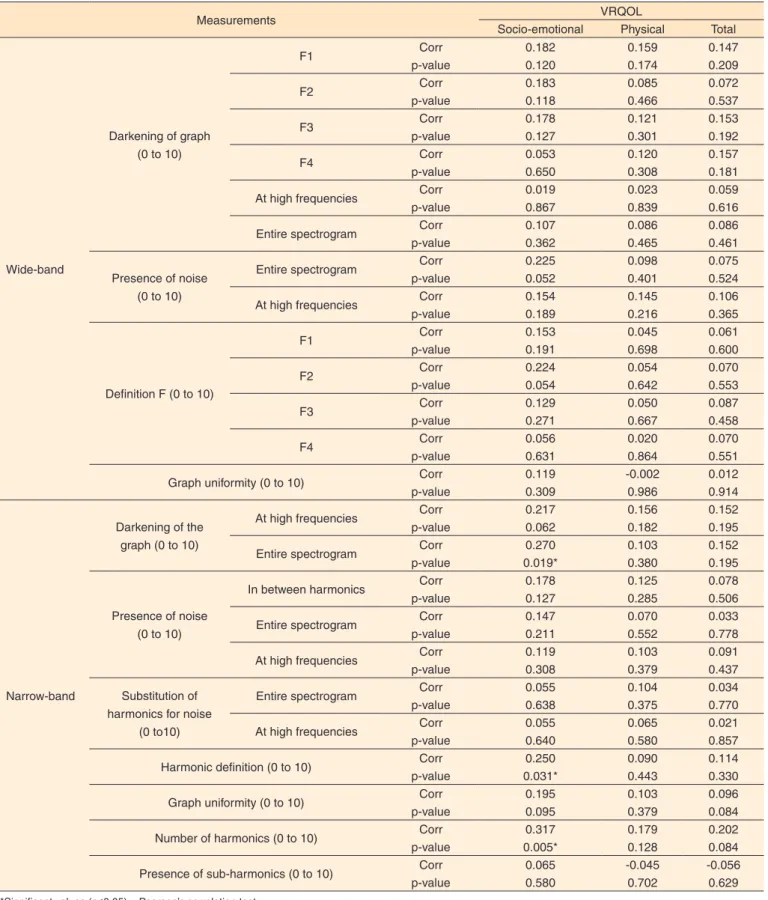
The higher the quality of life score in the social-emotional area, the lower the values of acoustic analysis of glottal source for f0, fhi and STD were and the greater the spectrographic values in narrowband filter to intensity of the tracing darke-ning in all vocal spectrogram, definition and harmonic number (Table 1).
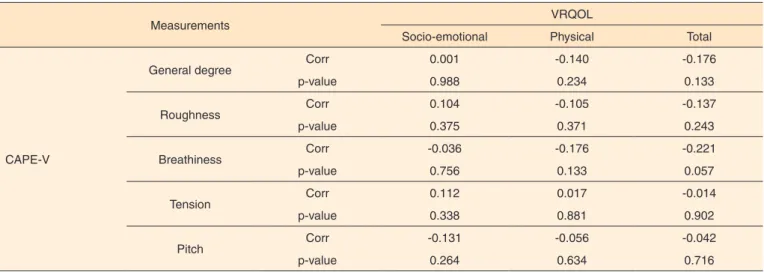
There was no correlation between perceptual-auditory analysis and voice-related quality of life (Table 2).
Table 1. Correlation between acoustic analysis and voice-related quality of life of teachers with vocal complaints
Measurements VRQOL
Socio-emotional Physical Total
MDVPA
Frequency
f0 (HZ) Corr -0.254 -0.126 -0.133
p-value 0.028* 0.283 0.258
fhi (Hz) Corr -0.327 -0.164 -0.181
p-value 0.004* 0.161 0.121
flo (Hz) Corr -0.077 -0.061 -0.015
p-value 0.511 0.605 0.896
STD (Hz) Corr -0.230 -0.098 -0.156
p-value 0.048* 0.405 0.182
Perturbation frequency
Jita (ms) Corr -0.097 -0.003 -0.064
p-value 0.407 0.976 0.583
Jitt (%) Corr -0.124 -0.027 -0.092
p-value 0.290 0.818 0.435
RAP (%) Corr -0.124 -0.030 -0.095
p-value 0.289 0.797 0.417
PPQ (%) Corr -0.151 -0.031 -0.102
p-value 0.198 0.791 0.383
sPPQ (%) Corr -0.160 -0.045 -0.118
p-value 0.171 0.191 0.315
vf0 (%) Corr -0.186 -0.067 -0.127
p-value 0.111 0.566 0.278
Perturbation amplitude
ShdB (dB) Corr -0.025 0.003 -0.026
p-value 0.827 0.979 0.821
Shim (%) Corr 0.029 0.052 0.021
p-value 0.805 0.654 0.852
APQ (%) Corr 0.015 0.034 0.005
p-value 0.897 0.773 0.961
sAPQ (%) Corr 0.035 0.113 0.084
p-value 0.764 0.333 0.472
vAm (%) Corr -0.093 0.027 0.053
p-value 0.428 0.818 0.650
Noise
NHR Corr 0.024 -0.050 -0.117
p-value 0.832 0.666 0.318
VTI Corr -0.045 -0.068 -0.108
p-value 0.701 0.564 0.358
SPI Corr -0.212 -0.117 0.113
p-value 0.068 0.320 0.333
Voice break
DVB (%) Corr 0.070 0.166 0.160
p-value 0.552 0.156 0.170
NVB Corr 0.070 0.166 0.160
p-value 0.552 0.156 0.170
Subharmonic segments
DSH (%) Corr 0.025 0.062 0.023
p-value 0.827 0.598 0.842
NSH Corr 0.006 -0.014 -0.059
p-value 0.956 0.904 0.616
Voiceless or unvoiced segments
DUV (%) Corr 0.068 0.006 -0.037
p-value 0.562 0.953 0.748
NUV Corr 0.005 -0.006 -0.042
Measurements VRQOL
Socio-emotional Physical Total
Wide-band
Darkening of graph (0 to 10)
F1 Corr 0.182 0.159 0.147
p-value 0.120 0.174 0.209
F2 Corr 0.183 0.085 0.072
p-value 0.118 0.466 0.537
F3 Corr 0.178 0.121 0.153
p-value 0.127 0.301 0.192
F4 Corr 0.053 0.120 0.157
p-value 0.650 0.308 0.181
At high frequencies Corr 0.019 0.023 0.059
p-value 0.867 0.839 0.616
Entire spectrogram Corr 0.107 0.086 0.086
p-value 0.362 0.465 0.461
Presence of noise (0 to 10)
Entire spectrogram Corr 0.225 0.098 0.075
p-value 0.052 0.401 0.524
At high frequencies Corr 0.154 0.145 0.106
p-value 0.189 0.216 0.365
Definition F (0 to 10)
F1 Corr 0.153 0.045 0.061
p-value 0.191 0.698 0.600
F2 Corr 0.224 0.054 0.070
p-value 0.054 0.642 0.553
F3 Corr 0.129 0.050 0.087
p-value 0.271 0.667 0.458
F4 Corr 0.056 0.020 0.070
p-value 0.631 0.864 0.551
Graph uniformity (0 to 10) Corr 0.119 -0.002 0.012
p-value 0.309 0.986 0.914
Narrow-band
Darkening of the graph (0 to 10)
At high frequencies Corr 0.217 0.156 0.152
p-value 0.062 0.182 0.195
Entire spectrogram Corr 0.270 0.103 0.152
p-value 0.019* 0.380 0.195
Presence of noise (0 to 10)
In between harmonics Corr 0.178 0.125 0.078
p-value 0.127 0.285 0.506
Entire spectrogram Corr 0.147 0.070 0.033
p-value 0.211 0.552 0.778
At high frequencies Corr 0.119 0.103 0.091
p-value 0.308 0.379 0.437
Substitution of harmonics for noise
(0 to10)
Entire spectrogram Corr 0.055 0.104 0.034
p-value 0.638 0.375 0.770
At high frequencies Corr 0.055 0.065 0.021
p-value 0.640 0.580 0.857
Harmonic definition (0 to 10) Corr 0.250 0.090 0.114
p-value 0.031* 0.443 0.330
Graph uniformity (0 to 10) Corr 0.195 0.103 0.096
p-value 0.095 0.379 0.084
Number of harmonics (0 to 10) Corr 0.317 0.179 0.202
p-value 0.005* 0.128 0.084
Presence of sub-harmonics (0 to 10) Corr 0.065 -0.045 -0.056
p-value 0.580 0.702 0.629
*Significant values (p≤0.05) – Pearson’s correlation test
Note: Corr = correlation; MDVPA = Multi Dimension Voice Program Advanced; RTS = Real Time Spectrogram; VRQOL = Voice-Related Quality of Life; F = formant; f0 = fundamental frequency; fhi = maximum f0; flo = lowest f0; STD = Standard Deviation of Fundamental Frequency; RAP = Relative Average Perturbation; Jitt = Jit-ter Percentages; Jita = Absolute JitJit-ter; sPPQ = Smoothed Pitch Perturbation Quotient; PPQ = Pitch Perturbation Quotient; vf0 = Fundamental Frequency Coefficient Variation; ShdB = Shimmer in dB; Shim = Shimmer Percentage; vAm = Peak Amplitude Variation; APQ = Amplitude Perturbation Quotient; sAPQ = Smoothed Ampli-tude Perturbation Quotient; NHR = Noise-Harmonic Ratio; SPI = Soft Phonation Index; VTI = Voice Turbulation Index; NVB = Number of Voice Breaks; DVB = Degree of Voice Break; DUV = Degree of Unvoiced Segments; NUV = Number of Unvoiced Segments; NSH = Number of Sub-harmonics; DSH = Degree of Sub-harmonic Components
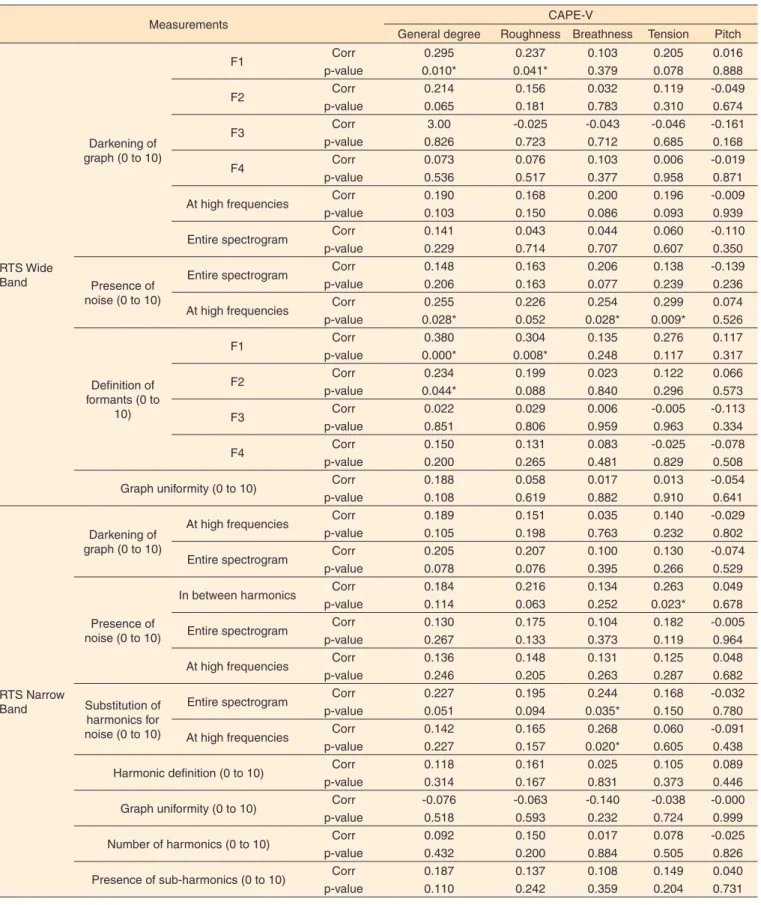
and the darkening and defining of the first formant tracing, and negatively correlated with the amplitude perturbation measurement vAm. Breathiness was positively correlated with perturbation measurements of jita, jitt, RAP, PPQ and sPPQ frequency, with the measure of SPI noise, with the presence of noise in the high frequency in wideband filter, and with the replacement of harmonics by noise at high frequencies and throughout spectrogram in narrowband filter. There was a po-sitive correlation between stress and perturbation measurement of jita, jitt and RAP (p=0.046) frequency, presence of noise in the high frequency in wideband filter, and the presence of noise among the harmonics in narrowband filter (Table 3).
DISCUSSION
In the present study, it was observed that the higher the quality of life score in the social-emotional area is, the lower the values of glottal source of acoustic analysis for most fre-quency measures (f0, fhi and STD) (Table 1). The greater the STD and fhi measures are, greater variability of f0 and pho-nation instability is, which may result from changes mucosal vibration and/or lack of neuromuscular and/ or respiratory control, suggesting that the higher phonation stability is, the higher also the teachers’ quality of life in social-emotional aspect(1,17,18). Further, emotional stress situations may increase
the variability of f0(17).
The higher quality of life scores in the social-emotional area also show correlation with lower values of f0 in teachers with vocal complaints analyzed. This may indicate that those which maintain lower f0, show greater quality of life in voice. The higher habitual f0 is, the greater the muscle tension and overload on the larynx is, it can generate the negative symptoms to speech and prejudice the communication(17).
The scores of the social-emotional area still had higher, the higher the darkening of the tracing in all vocal spectrogram, the
definition of harmonics and the number of harmonics in NB (Table 1). The degree of darkening of the spectrographic tracing is related to sound pressure(17,18). Considering that teachers need
to exert control over the class and transfer the contents of the classes, it is believed that those who have some knowledge of vocal production and respiratory support and speak in strong loudness with the appropriate adjustments, present a higher quality of life in voice(3,19).
The definition of harmonics is related to its demarcation and symmetry and increased harmonic structure may result both of its production by the glottal source, favored by the intense mobilization of the mucosa, as its amplification by the vocal tract(18,20). The richer and more defined the number set
of harmonics is, better voice quality and the glottal closure is, conditions that enhance the resonance and facilitate vocal projection, generating a better quality of voice, which may have been reflected in higher scores of social-emotional area (Table 1)(18).
In this study, there was no significant correlation between the results of perceptual-auditory voice analysis and quality of life related to voice (Table 2). These data support the findings of other studies, which showed a complex and indirect rela-tionship between actual vocal problems and the perception of the subjects, since the impact of dysphonia on quality of life depends on the individual characteristics and styles, by making them not to correlate with the severity or prognosis of voice disorder(3,21).
There was a positive correlation between the overall degree of voice alteration with SPI measure and the presence of noise at high frequencies in the WB, and expected that the greater the presence of aperiodic energy in the voice signal is, the higher the level of change is perceived(22) (Table 3). SPI analyzes the
lack of high-frequency harmonic components, which may suggest, also, glottal closure changes with presence of brea-thiness. The lack, decreased, or replacement of high frequency
Table 2. Correlation between perceptual-auditory assessment and voice-related quality of life of teachers with vocal complaints
Measurements
VRQOL
Socio-emotional Physical Total
CAPE-V
General degree Corr 0.001 -0.140 -0.176
p-value 0.988 0.234 0.133
Roughness Corr 0.104 -0.105 -0.137
p-value 0.375 0.371 0.243
Breathiness Corr -0.036 -0.176 -0.221
p-value 0.756 0.133 0.057
Tension Corr 0.112 0.017 -0.014
p-value 0.338 0.881 0.902
Pitch
Corr -0.131 -0.056 -0.042
p-value 0.264 0.634 0.716
*Significant values (p≤0.05) – Pearson’s correlation test
Table 3. Correlation between perceptual-auditory assessment and voice acoustic analysis of teachers with vocal complaints
Measurements CAPE-V
General degree Roughness Breathness Tension Pitch
MDVPA
Frequency
f0 (HZ) Corr -0.063 -0.221 -0.089 -0.204 0.073
p-value 0.590 0.058 0.446 0.080 0.531
fhi (Hz) Corr 0.001 -0.154 0.007 -0.116 0.193
p-value 0.992 0.187 0.947 0.323 0.099
flo (Hz) Corr 0.022 -0.116 -0.088 -0.133 0.048
p-value 0.852 0.321 0.453 0.256 0.683
STD (Hz) Corr 0.072 0.044 0.191 0.199 0.170
p-value 0.539 0.704 0.102 0.087 0.146
Perturbation frequency
Jita (ms) Corr 0.155 0.181 0.248 0.241 0.069
p-value 0.186 0.122 0.033* 0.038* 0.555
Jitt (%) Corr 0.183 0.185 0.272 0.230 0.096
p-value 0.118 0.112 0.018* 0.048* 0.412
RAP (%) Corr 0.172 0.179 0.263 0.232 0.098
p-value 0.141 0.126 0.023* 0.046* 0.402
PPQ (%) Corr 0.156 0.161 0.258 0.190 0.105
p-value 0.181 0.170 0.025* 0.103 0.419
sPPQ (%) Corr 0.157 0.153 0.284 0.279 0.162
p-value 0.179 0.191 0.013* 0.105 0.167
vf0 (%) Corr 0.080 0.048 0.182 0.219 0.194
p-value 0.495 0.678 0.118 0.060 0.097
Perturbation amplitude
ShdB (dB) Corr 0.029 0.072 0.172 0.066 0.032
p-value 0.802 0.541 0.142 0.572 0.781
Shim (%) Corr 0.032 0.055 0.187 0.078 0.011
p-value 0.785 0.639 0.109 0.505 0.925
APQ (%) Corr 0.022 0.025 0.199 0.078 0.024
p-value 0.847 0.828 0.087 0.506 0.836
sAPQ (%) Corr 0.008 -0.0445 0.168 0.131 0.067
p-value 0.941 0.703 0.150 0.262 0.566
vAm (%) Corr -0.191 -0.246 -0.095 -0.052 0.030
p-value 0.101 0.034* 0.417 0.655 0.794
Noise
NHR Corr 0.095 0.130 0.139 0.124 0.125
p-value 0.418 0.267 0.236 0.291 0.286
VTI Corr 0.171 0.147 0.166 0.091 0.131
p-value 0.144 0.210 0.157 0.439 0.263
SPI Corr 0.278 0.243 0.278 0.121 0.106
p-value 0.016* 0.036* 0.016* 0.303 0.367
Voice break
DVB (%) Corr -0.104 -0.178 -0.164 -0.155 -0.127
p-value 0.376 0.127 0.160 0.186 0.279
NVB Corr -0.104 -0.178 -0.165 -0.155 -0.127
p-value 0.376 0.127 0.160 0.186 0.279
Subharmonic segments
DSH (%) Corr 0.156 0.206 0.058 0.069 0.221
p-value 0.181 0.076 0.623 0.554 0.058
NSH Corr 0.209 0.263 0.148 0.200 0.209
p-value 0.073 0.023* 0.206 0.086 0.073
Voiceless or unvoiced
segments
DUV (%) Corr 0.032 0.051 0.101 0.157 0.094
p-value 0.784 0.663 0.388 0.180 0.422
NUV Corr -0.019 -0.031 0.098 0.063 0.125
Measurements CAPE-V
General degree Roughness Breathness Tension Pitch
RTS Wide Band
Darkening of graph (0 to 10)
F1 Corr 0.295 0.237 0.103 0.205 0.016
p-value 0.010* 0.041* 0.379 0.078 0.888
F2 Corr 0.214 0.156 0.032 0.119 -0.049
p-value 0.065 0.181 0.783 0.310 0.674
F3 Corr 3.00 -0.025 -0.043 -0.046 -0.161
p-value 0.826 0.723 0.712 0.685 0.168
F4 Corr 0.073 0.076 0.103 0.006 -0.019
p-value 0.536 0.517 0.377 0.958 0.871
At high frequencies Corr 0.190 0.168 0.200 0.196 -0.009
p-value 0.103 0.150 0.086 0.093 0.939
Entire spectrogram Corr 0.141 0.043 0.044 0.060 -0.110
p-value 0.229 0.714 0.707 0.607 0.350
Presence of noise (0 to 10)
Entire spectrogram Corr 0.148 0.163 0.206 0.138 -0.139
p-value 0.206 0.163 0.077 0.239 0.236
At high frequencies Corr 0.255 0.226 0.254 0.299 0.074
p-value 0.028* 0.052 0.028* 0.009* 0.526
Definition of formants (0 to
10)
F1 Corr 0.380 0.304 0.135 0.276 0.117
p-value 0.000* 0.008* 0.248 0.117 0.317
F2 Corr 0.234 0.199 0.023 0.122 0.066
p-value 0.044* 0.088 0.840 0.296 0.573
F3 Corr 0.022 0.029 0.006 -0.005 -0.113
p-value 0.851 0.806 0.959 0.963 0.334
F4 Corr 0.150 0.131 0.083 -0.025 -0.078
p-value 0.200 0.265 0.481 0.829 0.508
Graph uniformity (0 to 10) Corr 0.188 0.058 0.017 0.013 -0.054
p-value 0.108 0.619 0.882 0.910 0.641
RTS Narrow Band
Darkening of graph (0 to 10)
At high frequencies Corr 0.189 0.151 0.035 0.140 -0.029
p-value 0.105 0.198 0.763 0.232 0.802
Entire spectrogram Corr 0.205 0.207 0.100 0.130 -0.074
p-value 0.078 0.076 0.395 0.266 0.529
Presence of noise (0 to 10)
In between harmonics Corr 0.184 0.216 0.134 0.263 0.049
p-value 0.114 0.063 0.252 0.023* 0.678
Entire spectrogram Corr 0.130 0.175 0.104 0.182 -0.005
p-value 0.267 0.133 0.373 0.119 0.964
At high frequencies Corr 0.136 0.148 0.131 0.125 0.048
p-value 0.246 0.205 0.263 0.287 0.682
Substitution of harmonics for noise (0 to 10)
Entire spectrogram Corr 0.227 0.195 0.244 0.168 -0.032
p-value 0.051 0.094 0.035* 0.150 0.780
At high frequencies Corr 0.142 0.165 0.268 0.060 -0.091
p-value 0.227 0.157 0.020* 0.605 0.438
Harmonic definition (0 to 10) Corr 0.118 0.161 0.025 0.105 0.089
p-value 0.314 0.167 0.831 0.373 0.446
Graph uniformity (0 to 10) Corr -0.076 -0.063 -0.140 -0.038 -0.000
p-value 0.518 0.593 0.232 0.724 0.999
Number of harmonics (0 to 10) Corr 0.092 0.150 0.017 0.078 -0.025
p-value 0.432 0.200 0.884 0.505 0.826
Presence of sub-harmonics (0 to 10) Corr 0.187 0.137 0.108 0.149 0.040
p-value 0.110 0.242 0.359 0.204 0.731
*Significant values (p≤0.05) – Pearson’s correlation test
Note: corr = correlation; MDVPA = Multi Dimension Voice Program Advanced; RTS = Real Time Spectrogram; CAPE-V = CAPE-V = Consensus Auditory-Perceptual Evaluation of Voice; F = formant; f0 = fundamental frequency; fhi = maximum f0; flo = lowest f0; STD = Standard Deviation of Fundamental Frequency; RAP = Rela-tive Average Perturbation; Jitt = Jitter Percentages; Jita = Absolute Jitter; sPPQ = Smoothed Pitch Perturbation Quotient; PPQ = Pitch Perturbation Quotient; vf0 = Fundamental Frequency Coefficient Variation; ShdB = Shimmer in dB; Shim = Shimmer Percentage; vAm = Peak Amplitude Variation; APQ = Amplitude Perturbation Quotient; sAPQ = Smoothed Amplitude Perturbation Quotient; NHR = Noise-Harmonic Ratio; SPI = Soft Phonation Index; VTI = Voice Turbulation Index; NVB = Num-ber of Voice Breaks; DVB = Degree of Voice Break; DUV = Degree of Unvoiced Segments; NUV = NumNum-ber of Unvoiced Segments; NSH = NumNum-ber of Sub-harmonics; DSH = Degree of Sub-harmonic Components
harmonics and noise by all spectrogram shows the existence of an aperiodic energy component, related to the noisy voice breathy and/or hoarse(17,18). The overall degree change also
correlated positively with the largest darkening of F1 and F2 greater definition of the WB and, according to the literature(17),
serious formants with vertical striae are usually associated with rough/noisy emissions (Table 3).
The roughness is related to the presence of aperiodic energy generated by the mucosa vibration irregularity of the vocal folds, which can be associated with hoarseness and/ or roughness(17,23). In this research, the roughness correlated
positively with suggestive measures of the presence of SPI NSH noise and positively too, with the largest and most darkening and definition of F1 (Table 3). The presence of sub-harmonic components (NSH) of low-intensity among harmonics indicates the presence of generalized noise, it could correspond also to the diplophonia or crepitation(18,22).
SPI suggests lack of harmonic energy at high frequencies, with change in glottal closure(18).
The biggest darkening and definition of F1 in roughness may be related to the fact that hoarseness is characterized by noise with energy at lower frequencies(17) - and can present with
noise in the main formants of vowels(18) - and that the roughness
is characterized by more serious formants(17).
Contrary to expectations, the roughness was negatively correlated with the variation of the amplitude (vAm), a shimmer suggestive measure of decrease, limitation or inconsistency of contact coefficient of the vocal folds, relating to the presence of breathiness or hoarseness by irregular vibration of the mucosa(17,18,24).
In this investigation, the auditory-perceptual parameter of breathiness correlated positively with pratically all measures of jitter or perturbation of f0 at a short-term (jita, jitt, RAP, PPQ and sPPQ); SPI; presence of noise at high frequencies in WB; substitution for harmonics by noise in the high frequency in all spectrogram in NB (Table 3). The breathiness characterized by the presence of noise bass frequencies to the emission due to the presence of soundless transglottic air(17) or noise between
harmonics, replacement of harmonics by noise, noise in regions above 6 kHz(17,18) , agreeing with the findings.
The set of results shows, as it was explained earlier, the presence of aperiodic energy/noise and instability in the glottal signal, since the jitter measures related to the variation of f0 in consecutive cycles and may signalize erratic vibration patterns due to difficulties of control in phonation or respiratory level, indicating oscillatory instability of the vocal folds also for its biomechanical characteristics, and correlates of perception of dysphonia(17,18).
Also, the higher the SPI is, softer and fluid is phonation(18).
The breathy voice, although indicates the presence of back-ground noise, can transmit the perceptual- auditory point of view, an idea of sensuality and softness due to the presence of soundless air(17,18,24). Survey of dysarthric subjects found
unstable spectrographic tracing in all cases and in most of them, no harmonics at high frequencies, presence of noise among harmonics, and these findings were related to the hoarse-breathy voices of the subjects(25), agreeing with the
results of this study.
The compensatory vocal effort by teachers, by increasing the glottal adduction and hypertension of the extrinsic laryn-geal muscles, can generate increased vocal strain, perceived aurally(17,24). The strained or compressed voice leads to a
restric-ted mucosa vibration and sudden vocal attacks, with increased muscle tension and subglottic pressure(17). The tension can be
considered a noise measure that brings aperiodic energy cha-racteristics resulting from hypertension adductor muscles of the vocal folds(24), which may explain, in this study, the positive
correlation tension findings with perturbation measures of f0 at a short-term or jitter (jita, jitt, PAR), the presence of noise at high frequencies in WB, presence of noise among harmonics in NB (Table 3).
Researchers found correspondence between perceptual--auditory assessment and acoustic analysis, showing cor-relation between the overall degree to VTI, NHR and SPI; roughness with NHR and breathiness and asthenia with SPI(26).
However, another study found no significant correlation be-tween measures of f0, length frequency and of the first two formants and pitch, modulation and articulation(27). In this
work, there was a positive correlation between various data of the acoustic voice analysis and perceptual-auditory voice assessment (Table 3).
The findings of this research about teachers with vocal complaints are also consistent with those of a study of dys-phonic voices, which found the following relations between perceptual-auditory and spectrographic vocal parameters: overall degree of dysphonia, roughness, breathiness and ins-tability with irregular tracing of harmonics in the spectrogram, in 66% of evaluated cases; weak loudness with low degree of darkening of harmonics, in 87.5% of cases; sound breaks with failure in the continuity of the tracing, in 62.5%; overall degree of dysphonia and vocal instability with noise among the harmonics, 97.4%; overall degree of dysphonia and roughness with decreased in energy concentration in high frequency in 48.7%; overall degree of dysphonia and roughness with the presence of sub-harmonics in 79.5%(28).
These results reinforce the idea of complementarity be-tween the perceptual-auditory and acoustic assessment, com-bined with the results of quality of life protocols for voice, like VRQOL in order to measure how much a vocal disorder interferes with daily activities, personal context, social and professional of the subject, especially in the case of teachers who depend on voice for their profession(29).
Studies show that the relation between voice and quality of life is complex and is not direct(3,30). Thus, a multidimensional
the clinician can outline peculiarities and deepen their unders-tanding of the relation between what the teacher with vocal complaints feels and what manifests in its voice and how this is reflected in its quality of life, so that the clinician can better diagnose it and treat it.
However, as a limitation of this study, there was not a group of teachers without vocal complaints, to compare the results. More explorations of this complementarity of information be-tween voice perceptual-auditory and acoustic assessment, and quality of life related to voice must be carried out with different populations and control group, to obtain more scientific evi-dence to allow in the future the use of all or only one of them as reliable screening in cases of large groups to be evaluated.
CONCLUSION
In this group of teachers with vocal complaints, the smaller the frequency measures, the greater the darkening spectro-graphic tracing, definition and number of harmonics, the higher the quality of life related to voice. The results of perceptual-auditory voice analysis and acoustic analysis showed significant correlations for the presence of aperiodic energy and insta-bility of vocal signal. The findings showed that the acoustic and perceptual-auditory vocal assessments and quality of life related to voice were complementary to characterize the vocal profile of teachers.
REFERENCES
1. Ferreira FV, Cielo CA, Trevisan ME. Medidas vocais acústicas na doença de Parkinson: estudo de casos. Rev CEFAC. 2010;12(5):889-98. http://dx.doi.org/10.1590/S1516-18462010005000020
2. Santana MCCP, Goulart BNG, Chiari BM. Distúrbios da voz em docentes: revisão crítica da literatura sobre a prática da vigilância em saúde do trabalhador. J Soc Bras Fonoaud. 2012;24(3):288-95. http://dx.doi.org/10.1590/S2179-64912012000300016
3. Servilha EAM, Roccon PF. Relação entre voz e qualidade de vida em professores universitários. Rev CEFAC. 2009;11(3):440-8. http:// dx.doi.org/10.1590/S1516-18462009005000029
4. Giannini SPP, Latorre MRDO, Ferreira LP. Distúrbio de voz e estresse no trabalho docente: um estudo caso-controle. Cad Saúde Pública. 2012;28(11):2115-24. http://dx.doi.org/10.1590/S0102-311X2012001100011
5. Tutya AS, Zambon F, Oliveira G, Behlau M. Comparação dos escores dos protocolos QVV, IDV e PPAV em professores. Rev Soc Bras Fonoaudiol. 2011;16(3):273-81. http://dx.doi.org/10.1590/ S1516-80342011000300007
6. Arbach M, Servilha E. Avaliação do efeito de assessoria vocal com professores universitários. Disturb Comun. 2013;25(2):211-8. 7. Behlau M, Oliveira G, Santos lMA, Ricarte A. Validação no Brasil
de protocolos de auto-avaliação do impacto de uma disfonia. Pro Fono. 2009;21(4):326-32. http://dx.doi.org/10.1590/S0104-56872009000400011
8. Oliveira I. Pessoas com queixa vocal à espera de atendimento: auto-avaliação vocal, índice de disfonia e qualidade de vida. Disturb Comun. 2008;20(1):61-75.
9. Yamasaki R, Leão SHS, Madazio G, Padovani M, Azevedo R, Behlau MS. Correspondência entre escala analógico-visual e escala numérica na avaliação perceptivoauditiva de vozes. Anais do 16º Congresso Brasileiro de Fonoaudiologia; 24-27 set 2008; Campos do Jordão, SP. Sociedade Brasileira de Fonoaudiologia; 2008. Revista da Sociedade Brasileira de Fonoaudiologia; supl. 2008 [acesso em: 20 jun 2013]. Disponível em: http://www.sbfa.org.br/portal/anais2008/ resumos/R1080-2.pdf
10. Cielo CA, Christmann MK. Finger Kazoo: modificações vocais acústicas espectrográficas e autoavaliação vocal. Rev CEFAC. 2014;16(4):1239-54. http://dx.doi.org/10.1590/1982-021620145513 11. Ribeiro VV, Cielo CA. Medidas vocais perceptivo-auditivas
e acústicas, queixas vocais e características profissionais de professoras de Santa Maria (RS). Audiol Commun Res. 2 0 1 4 ; 1 9 ( 4 ) : 3 8 7 9 8 . h t t p : / / d x . d o i . o r g / 1 0 . 1 5 9 0 / S 2 3 1 7 -64312014000400001395
12. American Speech-Language-Hearing Association. Consensus Auditory-Perceptual Evaluation of Voice (CAPE-V): ASHA Special Interest Division 3, Voice and the voice disorders. Rockville: American Speech-Language-Hearing Association; 2003. [acesso em: 3 mar 2013]. Disponível em: http://www.asha.org/uploadedFiles/ ASHA/SIG/03/affiliate/CAPE-V-Purpose-Applications.pdf 13. Siracusa MGP, Oliveira G, Madazio G, Behlau M. Efeito imediato
do exercício de sopro sonorizado na voz do idoso. J Soc Bras Fonoaudiol. 2011;23(1):27-31. http://dx.doi.org/10.1590/S2179-64912011000100008
14. Guzmán M, Callejas C, Castro C, García-Campo P, Lavanderos D, Valladares MJ et al. Efecto terapéutico de los ejercicios con tracto vocal semiocluido en pacientes con disfonía músculo tensional tipo I. Rev Logoped Foniatr Audiol. 2012;32(3):139-46. http://dx.doi. org/10.1016/j.rlfa.2012.05.004
15. Hogikyan ND, Sethuraman G. Validation of an instrument to measure voice-related quality of life (V-RQOL). J Voice. 1999;13(4):557-69. http://dx.doi.org/10.1016/S0892-1997(99)80010-1
16. Gasparini G, Behlau M. Quality of life: validation of the Brazilian version of the Voice-Related Quality of Life (V-RQOL) measure. J Voice. 2009;23(1):76-81. http://dx.doi.org/10.1016/j. jvoice.2007.04.005
17. Behlau M, Madazio G, Feijó D, Pontes P. Avaliação de voz. In: Behlau M. (Org.). Voz: o livro do especialista. Rio de Janeiro: Revinter; 2001. p. 85-245.
18. Barros APB, Carrara-De Angelis E. Análise acústica da voz. In: Dedivitis RA, Barros APB. (Org.). Métodos de avaliação e diagnóstico da laringe e voz. São Paulo: Lovise; 2002. p.185-200. 19. Servilha EAM, Delatti MA. Percepção de ruído no ambiente de
trabalho e sintomas auditivos e extra-auditivos autorreferidos por professores universitários. J Soc Bras Fonoaudiol. 2012;24(3):233-8. http://dx.doi.org/10.1590/S2179-64912012000300008
Fonoaudiol. 2010;15(2)243-9. http://dx.doi.org/10.1590/S1516-80342010000200016
21. Park K, Behlau M. Sinais e sintomas da disfunção autônoma em indivíduos disfônicos. J Soc Bras Fonoaudiol. 2011;23(2):164-9. http://dx.doi.org/10.1590/S2179-64912011000200014
22. Beber BC, Cielo CA. Medidas acústicas de fonte glótica de vozes masculinas normais. Pro Fono. 2010;22(3):299-304. http://dx.doi. org/10.1590/S0104-56872010000300024
23. Carrasco ER, Oliveira G, Behlau M. Análise perceptivo-auditiva e acústica da voz de indivíduos gagos. Rev CEFAC. 2010;12(6):925-35. http://dx.doi.org/10.1590/S1516-18462010005000058
24. Pinho SMR, Pontes P. Escala de avaliação perceptiva da fonte glótica. Vox Brasilis. 2002;8(3):11-3.
25. Ortiz KZ, Carrillo L. Comparação entre as análises auditiva e acústica nas disartrias. Rev Soc Bras Fonoaudiol. 2008;13(4):325-31. http://dx.doi.org/10.1590/S1516-80342008000400005
26. Bhuta T, Patrick L, Garnett JD. Perceptual evaluation of voice quality and its correlation with acoustic measurements. J Voice. 2004;18(3):299-304. http://dx.doi.org/10.1016/j.jvoice.2003.12.004 27. Luchesi KF, Mourao LF, Kitamura S. Efetividade de um programa de aprimoramento vocal para professores. Rev CEFAC. 2012;14(3):459-70. http://dx.doi.org/10.1590/S1516-18462011005000135 28. Drumond LB, Gama ACC. Correlação entre dados espectrográficos e
perceptivo-auditivos de vozes disfônicas. Fono Atual. 2006;8(35):49-58.
29. Berg EE, Hapner E, Klein A, Johns MM. Voice therapy improves quality of life in age-related dysphonia: a case-control study. J Voice. 2008;22(1):70-4. http://dx.doi.org/10.1016/j.jvoice.2006.09.002 30. Ribeiro VV, Cielo CA. Autoavaliação vocal de professoras de Santa