ABSTRACT:Introduction: The race/skin color is an important predictor of health status of the population, as well as a marker of social inequalities. Objective: The aim of this paper was to describe the prevalence of the main risks and the protective factors for chronic diseases in schoolchildren, according to race/skin color diferences. Methods: Data from the National Adolescent School-Based Health Survey (2012) were used. This is a cross-sectional study carried out in public and private schools. Prevalences were calculated according to the distribution by race/skin color. Prevalence ratios adjusted for age and maternal schooling were analyzed.
Results: White adolescents were younger, studied more frequently in private schools and had mothers with higher levels of education in comparison to the other students. Consumption of beans and fruits was higher among black, brown, and indigenous participants. Physical activity was more frequent among indigenous people. Experimentation with alcohol was higher among white adolescents. Indigenous students reported greater physical violence. Asian and black adolescents reported experiencing greater bullying. Conclusion: Minimizing racial and ethnic disparities in health is necessary to disease prevention and health promotion among adolescents.
Keywords: Adolescents. Chronic disease. Risk factors. Race or ethnic group distribution. Health surveys. Epidemiological surveillance.
Risk and protective factors for noncommunicable
chronic diseases in adolescents by race/skin color:
National Adolescent School-Based Health Survey
Fatores de risco e proteção de doenças e agravos não transmissíveis em
adolescentes segundo raça/cor: Pesquisa Nacional de Saúde do Escolar
Deborah Carvalho MaltaI, Sheila Rizzato StopaII, Maria Aline Siqueira SantosIII,
Silvânia Suely Caribé de Araújo AndradeIII, Max Moura de OliveiraII,
Rogério Ruscitto do PradoII, Marta Maria Alves da SilvaIV
ORIGINAL ARTICLE / ARTIGO ORIGINAL
ISchool of Nursing. Universidade Federal de Minas Gerais – Belo Horizonte (MG), Brazil. IIUniversidade de São Paulo – São Paulo (SP), Brazil.
IIIDepartment of Surveillance of Noncommunicable Diseases and Health Promotion, Secretariat of Health Surveillance, Ministry
of Health – Brasília (DF), Brazil.
IVUniversidade Federal de Goiás – Goiânia (GO), Brazil.
Corresponding author: Deborah Carvalho Malta. Avenida Alfredo Balena, 190. Santa Eigênia, CEP: 30130-100, Belo Horizonte,
MG, Brasil. E-mail: [email protected]
Conlict of interests: nothing to declare – Financial support: none.
INTRODUCTION
Race/skin color is an important predictor of health status of the population, as well as a marker of social inequalities1. In recent decades, a considerable increase in its use in
seve-ral epidemiological studies has been observed2-5. A systematic review that addressed the
use of the variables such as race, color, and ethnicity in Brazilian epidemiological studies, also found an increasing use of these variables as predictors of health outcomes, such as in research on the epidemiology of noncommunicable diseases (NCDs), infectious and para-sitic diseases, nutritional epidemiology, among others3-5.
Among adults, studies using race/skin color as an explanatory variable have been car-ried out more frequently. Those studies show higher illiteracy rates, poorer working con-ditions, and health inequities in black populations, with greater morbidity and mortality. This mortality is especially higher owing to violence and murders. However, although this is less frequent among adolescents, some studies also indicate diferences by race/ skin color1,6-9. Worse health conditions in black population have been described as a public
health problem and lead to increased social disparities2,9. It is worth noting that, in Brazil,
black people account for nearly half of the population10.However, some authors claim that
racial diferences in health indicators, in most cases, are due to socioeconomic and cultural factors, among others11,12.
Adding to this social determinant of health, early exposure to risk factors for health in adolescence, such as the use of tobacco, alcohol, poor diet, and physical inactivity, is asso-ciated with NCDs, accidents, and violence13-15.
In Brazil, the National Adolescent School-Based Health Survey (acronym in Portuguese – PeNSE)13,14 was the irst nationwide survey that investigated the risk and protective factors
RESUMO:Introdução:A raça/cor da pele é um importante preditor do estado de saúde da população, assim como um marcador de desigualdades sociais. Objetivo: O objetivo deste estudo foi descrever as prevalências dos principais fatores de risco e proteção para as doenças crônicas e agravos não transmissíveis em escolares, segundo as diferenças de raça/cor da pele. Métodos: Foram utilizados dados da Pesquisa Nacional de Saúde do Escolar (PeNSE) de 2012 e calculadas as prevalências ajustadas por idade e escolaridade materna, segundo distribuição por raça/cor da pele.
Resultados: Adolescentes brancos são mais novos, estudam em escolas privadas, têm mães mais escolarizadas. O consumo de feijão e frutas foi maior em pretos, pardos e indígenas. A prática de atividade física foi maior em indígenas. A experimentação de bebidas alcoólicas foi maior em brancos. Indígenas relataram sofrer maior violência física. Amarelos e pretos relataram sofrer mais bullying. Conclusão: Os dados sugerem iniquidades na distribuição por raça/cor, sendo necessário minimizar as disparidades raciais e étnicas na saúde a im de contribuir mais efetivamente para a prevenção de doenças e a promoção da saúde dos adolescentes.
RISK AND PROTECTIVE FACTORS FOR NONCOMMUNICABLE CHRONIC DISEASES
IN ADOLESCENTS BY RACE/SKIN COLOR: NATIONAL ADOLESCENT SCHOOL-BASED HEALTH SURVEY
for the health of adolescents. Studies based on PeNSE on risk factors for health in adoles-cence indicate higher prevalence of outcomes such as alcohol consumption among white population16 and bullying among the black population1.
Knowing the distribution of risk factors among adolescents by race/skin color is still a knowledge gap in the country. Therefore, this study aimed at describing the prevalence of key risk and protective factors for NCDs in schoolchildren, according to the diferences of race/skin color.
METHODS
The PeNSE 201214 is a cross-sectional study, carried out in a partnership among the
Ministry of Health (MS), the Brazilian Institute of Geography and Statistics (IBGE), and the Ministry of Education (MEC). This survey is triennial and two editions of the survey were carried out in 2009 and 2012. PeNSE is carried out with students from the 9th year of elementary school in public and private Brazilian schools. The sample of PeNSE 2012 was representative of Brazil, the 5 regions, and 26 state capitals, and the Federal District.
For sampling plan, 27 geographic areas corresponding to all state capitals and Federal District were defined. Other municipalities were selected in addition to the state capitals, to represent the five major regions of Brazil, forming five geographic strata. The sample of each geographic stratum was allocated proportionally to the number of schools, according to the type of administration of the school (private and public)14.
The sampling procedure was performed in three stages: primary sampling units – homo-geneous groups considering neighboring municipalities; secondary sampling units – schools; and tertiary sampling units – classes. Students from selected classes, who were present on the day of data collection, composed the sample and were invited to participate in the sur-vey14.The survey was carried out in 3,004 schools and 4,288 classes, and 109,104 students
answered the survey questionnaire (83% of those attending classes). The interview was car-ried out using a self-administered structured questionnaire, which was uploaded in smar-tphonesin 2012.
Prevalence and respective 95% conidence intervals of the following blocks of varia-bles, according to diferences in race/skin color, were compared for this study, conside-ring the ive race/skin color categories used by the IBGE (white, black, brown, yellow, and indigenous):
1. Demographic and socioeconomic variables:
• age ≤ 13, 13, 14, 15, and 16 years and over; • sex;
• type of administration – public or private schools; • working – no or yes.
2. Lifestyle and behavior:
• frequent food intake of beans, fruits, candies (sweets, candies, chocolate, chewing gum, bonbon, or lollipops), and soft drinks. These indicators were calculated based on the percentage of students who reported the consumption of the food in at least ive of the seven days prior to the data collection.
3. Body image: self-perception of body image as fat and very fat.
4. Physical activity: physical activity (percentage of students who reported one hour of daily physical activity on ive or more days in the week prior to the survey).
5. Smoking:
• cigarette use in the past 30 days (percentage of students who reported smoking at least once in the 30 days preceding the survey, regardless of the frequency and intensity);
• use of cigarettes in their lifetime (experimentation) (percentage of student who reported smoking experimentation sometime in their lives).
6. Drinking:
• alcohol intake in the last 30 days (percentage of students who reported having consumed alcohol at least once in the 30 days prior to the survey);
• experimentation with alcohol (percentage of student who reported having experimented with alcohol at least once in life).
7. Experimentation with illicit drugs: percentage of students who mentioned experiment with illicit drugs such as marijuana, cocaine, crack, glue, inhalant substances, ecstasy,
oxi, among others, ever in life. 8. Violence:
• physical violence (percentage of students who reported having been involved in ights in the 12 months preceding the survey);
• family violence (percentage of students who reported having experienced domestic violence in the last 30 days prior to data collection)17;
• being bullied (percentage of students who reported having experienced bullying – was reproached, mocked, threatened, teased – in the last 30 days prior to the survey).
RISK AND PROTECTIVE FACTORS FOR NONCOMMUNICABLE CHRONIC DISEASES
IN ADOLESCENTS BY RACE/SKIN COLOR: NATIONAL ADOLESCENT SCHOOL-BASED HEALTH SURVEY
RESULTS
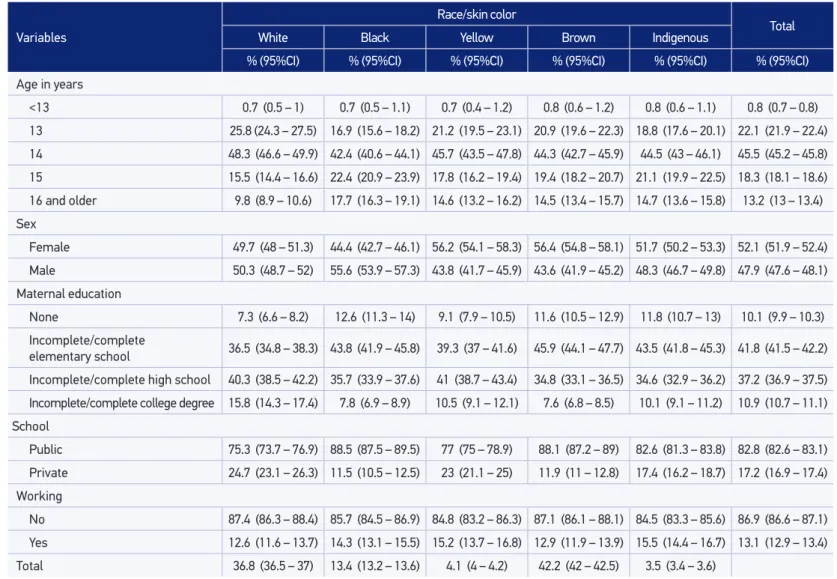
In 2012, 109,104 students were interviewed. Among the interviewed students, 42.2% of them self-reported as brown, 36.8% of them self-reported as white, 13.4% as black, 4.1% as yellow, and 3.5% as indigenous. Of the students interviewed, 85.9% were aged between 13 and 15 years. Among the black students who were enrolled in 9th grade of elementary school, 17.7% were aged 16 years or older, whereas among white students this percentage was 9.8%. In addition, 52.1% of students reported being female and 47.9% being male (Table 1). With regard to maternal education of the participants, 7.3% of white and 12.6% of black students mentioned no degree of maternal education, whereas the incomplete/ complete higher education was reported by 15.8% of white, 7.8 % of black, and 7.6% of brown adolescents.
Regarding the type of administration of the schools, 88.5% of black and 88.1% of brown adolescents studied in public schools, and among white and yellow individuals, this percen-tage was 75.3% and 77%, respectively. It was observed that 13.1% of adolescents reported working, and indigenous (15.5%) and yellow students (15.2%) were those who reported this practice more frequently (Table 1).
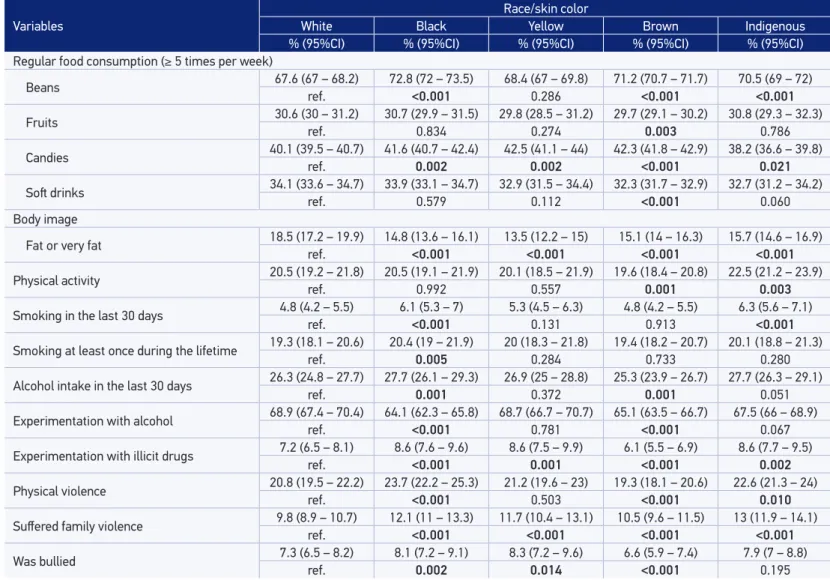
The consumption of beans was more frequent among black (72.8%), brown (71.2%), and indigenous adolescents (70.5%). Prevalence of fruits intake was 29.7% among brown students, which was less frequent than among white students. Consumption of candies was lower among indigenous (38.2%) and white students (40.1%), and consumption of soft drinks showed similar prevalence between the groups, but was lower among brown individuals – 32.3%. The prevalence of students who reported feeling fat or very fat was 18.5% among white students. The prevalence of physical activity was lower among brown adolescents (19.6%) and higher among indigenous adolescents (22.5%) (Table 2).
With regard to smoking, the prevalence of cigarette smoking in the last 30 days was 6.3% among indigenous and 6.1% among black students. The prevalence of cigarette use at least once during their lifetime was 20.4% for black, 20.1% for indigenous, and 20.0% for yellow students. As for alcohol intake in the last 30 days, the prevalence was 27.7% among black and indigenous individuals. Experimentation with alcohol had higher prevalence rates among white and yellow individuals, with 68.9% and 68.7%, respectively. The prevalence of experimentation with illicit drugs was 8.6% among black, yellow, and indigenous adoles-cents. With regard to sufering family violence, the prevalence among indigenous students was 13.0%, and among black students was 12.1%. Bullying victims had prevalence of 8.3% among yellow and 8.1% among black individuals (Table 2).
Variables
Race/skin color
Total
White Black Yellow Brown Indigenous
% (95%CI) % (95%CI) % (95%CI) % (95%CI) % (95%CI) % (95%CI)
Age in years
<13 0.7 (0.5 – 1) 0.7 (0.5 – 1.1) 0.7 (0.4 – 1.2) 0.8 (0.6 – 1.2) 0.8 (0.6 – 1.1) 0.8 (0.7 – 0.8)
13 25.8 (24.3 – 27.5) 16.9 (15.6 – 18.2) 21.2 (19.5 – 23.1) 20.9 (19.6 – 22.3) 18.8 (17.6 – 20.1) 22.1 (21.9 – 22.4)
14 48.3 (46.6 – 49.9) 42.4 (40.6 – 44.1) 45.7 (43.5 – 47.8) 44.3 (42.7 – 45.9) 44.5 (43 – 46.1) 45.5 (45.2 – 45.8)
15 15.5 (14.4 – 16.6) 22.4 (20.9 – 23.9) 17.8 (16.2 – 19.4) 19.4 (18.2 – 20.7) 21.1 (19.9 – 22.5) 18.3 (18.1 – 18.6)
16 and older 9.8 (8.9 – 10.6) 17.7 (16.3 – 19.1) 14.6 (13.2 – 16.2) 14.5 (13.4 – 15.7) 14.7 (13.6 – 15.8) 13.2 (13 – 13.4)
Sex
Female 49.7 (48 – 51.3) 44.4 (42.7 – 46.1) 56.2 (54.1 – 58.3) 56.4 (54.8 – 58.1) 51.7 (50.2 – 53.3) 52.1 (51.9 – 52.4)
Male 50.3 (48.7 – 52) 55.6 (53.9 – 57.3) 43.8 (41.7 – 45.9) 43.6 (41.9 – 45.2) 48.3 (46.7 – 49.8) 47.9 (47.6 – 48.1)
Maternal education
None 7.3 (6.6 – 8.2) 12.6 (11.3 – 14) 9.1 (7.9 – 10.5) 11.6 (10.5 – 12.9) 11.8 (10.7 – 13) 10.1 (9.9 – 10.3)
Incomplete/complete
elementary school 36.5 (34.8 – 38.3) 43.8 (41.9 – 45.8) 39.3 (37 – 41.6) 45.9 (44.1 – 47.7) 43.5 (41.8 – 45.3) 41.8 (41.5 – 42.2)
Incomplete/complete high school 40.3 (38.5 – 42.2) 35.7 (33.9 – 37.6) 41 (38.7 – 43.4) 34.8 (33.1 – 36.5) 34.6 (32.9 – 36.2) 37.2 (36.9 – 37.5)
Incomplete/complete college degree 15.8 (14.3 – 17.4) 7.8 (6.9 – 8.9) 10.5 (9.1 – 12.1) 7.6 (6.8 – 8.5) 10.1 (9.1 – 11.2) 10.9 (10.7 – 11.1)
School
Public 75.3 (73.7 – 76.9) 88.5 (87.5 – 89.5) 77 (75 – 78.9) 88.1 (87.2 – 89) 82.6 (81.3 – 83.8) 82.8 (82.6 – 83.1)
Private 24.7 (23.1 – 26.3) 11.5 (10.5 – 12.5) 23 (21.1 – 25) 11.9 (11 – 12.8) 17.4 (16.2 – 18.7) 17.2 (16.9 – 17.4)
Working
No 87.4 (86.3 – 88.4) 85.7 (84.5 – 86.9) 84.8 (83.2 – 86.3) 87.1 (86.1 – 88.1) 84.5 (83.3 – 85.6) 86.9 (86.6 – 87.1)
Yes 12.6 (11.6 – 13.7) 14.3 (13.1 – 15.5) 15.2 (13.7 – 16.8) 12.9 (11.9 – 13.9) 15.5 (14.4 – 16.7) 13.1 (12.9 – 13.4)
Total 36.8 (36.5 – 37) 13.4 (13.2 – 13.6) 4.1 (4 – 4.2) 42.2 (42 – 42.5) 3.5 (3.4 – 3.6)
RISK AND PROTECTIVE fACTORS fOR NONCOMMUNICABLE CHRONIC DISEASES IN ADOLESCENTS BY RACE/SKIN COLOR: NATIONAL ADOLESCENT SCHOOL-BASED HEALTH SURVEY
Table 2. Frequency (%) of risk and protective factor for schoolchildren’s health, according to race/skin color among schoolchildren from the 9th grade of elementary school in Brazil. PeNSE 2012.
Variables
Race/skin color
White Black Yellow Brown Indigenous
% (95%CI) % (95%CI) % (95%CI) % (95%CI) % (95%CI)
Regular food consumption (≥ 5 times per week)
Beans 67.6 (67 – 68.2) 72.8 (72 – 73.5) 68.4 (67 – 69.8) 71.2 (70.7 – 71.7) 70.5 (69 – 72)
ref. <0.001 0.286 <0.001 <0.001
Fruits 30.6 (30 – 31.2) 30.7 (29.9 – 31.5) 29.8 (28.5 – 31.2) 29.7 (29.1 – 30.2) 30.8 (29.3 – 32.3)
ref. 0.834 0.274 0.003 0.786
Candies 40.1 (39.5 – 40.7) 41.6 (40.7 – 42.4) 42.5 (41.1 – 44) 42.3 (41.8 – 42.9) 38.2 (36.6 – 39.8)
ref. 0.002 0.002 <0.001 0.021
Sot drinks 34.1 (33.6 – 34.7) 33.9 (33.1 – 34.7) 32.9 (31.5 – 34.4) 32.3 (31.7 – 32.9) 32.7 (31.2 – 34.2)
ref. 0.579 0.112 <0.001 0.060
Body image
Fat or very fat 18.5 (17.2 – 19.9) 14.8 (13.6 – 16.1) 13.5 (12.2 – 15) 15.1 (14 – 16.3) 15.7 (14.6 – 16.9)
ref. <0.001 <0.001 <0.001 <0.001
Physical activity 20.5 (19.2 – 21.8) 20.5 (19.1 – 21.9) 20.1 (18.5 – 21.9) 19.6 (18.4 – 20.8) 22.5 (21.2 – 23.9)
ref. 0.992 0.557 0.001 0.003
Smoking in the last 30 days 4.8 (4.2 – 5.5) 6.1 (5.3 – 7) 5.3 (4.5 – 6.3) 4.8 (4.2 – 5.5) 6.3 (5.6 – 7.1)
ref. <0.001 0.131 0.913 <0.001
Smoking at least once during the lifetime 19.3 (18.1 – 20.6) 20.4 (19 – 21.9) 20 (18.3 – 21.8) 19.4 (18.2 – 20.7) 20.1 (18.8 – 21.3)
ref. 0.005 0.284 0.733 0.280
Alcohol intake in the last 30 days 26.3 (24.8 – 27.7) 27.7 (26.1 – 29.3) 26.9 (25 – 28.8) 25.3 (23.9 – 26.7) 27.7 (26.3 – 29.1)
ref. 0.001 0.372 0.001 0.051
Experimentation with alcohol 68.9 (67.4 – 70.4)ref. 64.1 (62.3 – 65.8) 68.7 (66.7 – 70.7) 65.1 (63.5 – 66.7) 67.5 (66 – 68.9)
<0.001 0.781 <0.001 0.067
Experimentation with illicit drugs 7.2 (6.5 – 8.1) 8.6 (7.6 – 9.6) 8.6 (7.5 – 9.9) 6.1 (5.5 – 6.9) 8.6 (7.7 – 9.5)
ref. <0.001 0.001 <0.001 0.002
Physical violence 20.8 (19.5 – 22.2) 23.7 (22.2 – 25.3) 21.2 (19.6 – 23) 19.3 (18.1 – 20.6) 22.6 (21.3 – 24)
ref. <0.001 0.503 <0.001 0.010
Sufered family violence 9.8 (8.9 – 10.7) 12.1 (11 – 13.3) 11.7 (10.4 – 13.1) 10.5 (9.6 – 11.5) 13 (11.9 – 14.1)
ref. <0.001 <0.001 <0.001 <0.001
Was bullied 7.3 (6.5 – 8.2) 8.1 (7.2 – 9.1) 8.3 (7.2 – 9.6) 6.6 (5.9 – 7.4) 7.9 (7 – 8.8)
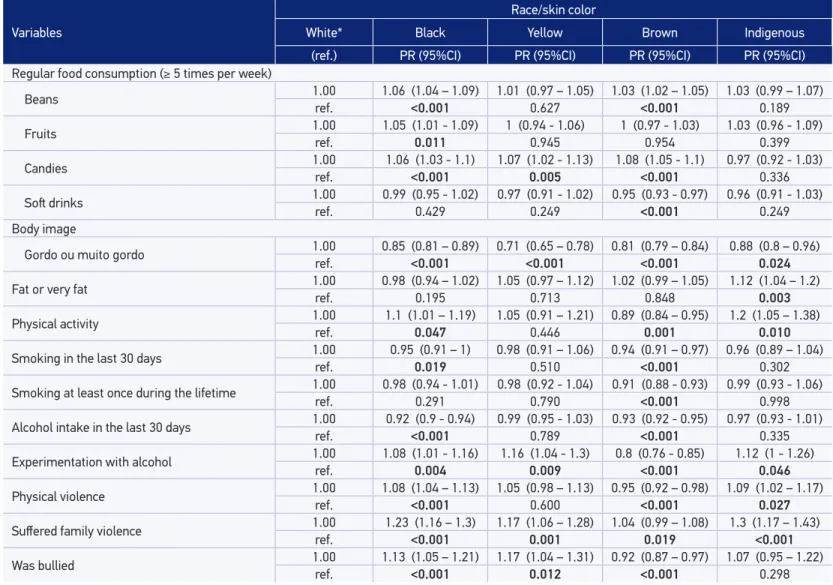
drinks (PR = 0.95; 95%CI 0.93 – 0.97) compared with white adolescents. As for body image, all the students perceived themselves as less fat than white adolescents. It is worth noting that yellow students had lower PR compared with the others (PR = 0.71; 95%CI 0.65 – 0.78). Indigenous people were those who practiced more physical activity (PR = 1.12; 95%CI 1.04 – 1.2). Brown students reported less cigarette use in the past 30 days (PR = 0.89; 95%CI 0.84 – 0.95), whereas black (PR = 0.95; 95%CI 0.91 – 1.00) and brown adolescents (PR = 0.94; 95%CI 0.91 – 0.97) reported the lowest smoking experimentation during their lifetime. The≈lowest alcohol intake in the last 30 days was observed among brown adolescents, when compared with white students (PR = 0.91; 95%CI 0.88 – 0.93), as well as the lowest experimentation with illicit drugs (PR = 0.8; 95%CI 0.76 – 0.85). However, experimentation with illicit drugs was higher among black (PR = 1.08; 95%CI 1.01 – 1.16), yellow (PR = 1.16; 95%CI 1.04 – 1.3), and indigenous stu-dents (PR = 1.12; 95%CI 1.00 – 1.26), when compared with white stustu-dents. Experimentation with alcohol during lifetime was lower among black (PR = 0.92%; 95%CI 0.9 – 0.94) and brown students (PR = 0.93; 95%CI 0.92 – 0.95). Indigenous and black students were more frequently involved in physical violence (PR = 1.09; 95%CI 1.02 – 1.17 and PR = 1.08; 95%CI 1.04 – 1.13, respectively) and family violence (PR = 1.3; 95%CI 1.17 – 1.43). Yellow students were the ones who sufered bullying more frequently (PR = 1.17; 95%CI 1.04 – 1.31) (Table 3).
DISCUSSION
In this study, the following socioeconomic diferences were observed: white adoles-cents were younger, had mothers with higher levels of education, and studied in private schools. Yellow and indigenous students reported working more often than white students. These results suggest possible inequalities in the distribution by race/skin color. Such dif-ferences have been observed previously in studies among students18.
For the four food indicators, consumption of beans was higher among black, brown, and indi-genous adolescents in comparison with white students; the higher fruit consumption was found among brown students. Candies were consumed more frequently by black, yellow, and brown students. White adolescents felt fat or very fat more frequently, and physical activity was more prevalent among indigenous individuals. Black students showed higher regular use of cigarettes and smoking experimentation. The experimentation with alcohol, ever in life, was lower among black and brown adolescents. Experimentation with illicit drugs at some time in life was higher among black, yellow, and indigenous students. Black and indigenous students reported more involvement in physical ights. Family violence was lower among white students. Self-declared black or yellow adolescents were those who reported being bulliedmore frequently.
White students had the lowest prevalence of beans consumption (compared with black and brown students) and candies consumption (compared with black, brown, and indigenous adolescents). The consumption of beans was higher among the black population. Telephone surveys with adults also indicated these diferences19. Lower consumption of beans among
RISK AND PROTECTIVE fACTORS fOR NONCOMMUNICABLE CHRONIC DISEASES IN ADOLESCENTS BY RACE/SKIN COLOR: NATIONAL ADOLESCENT SCHOOL-BASED HEALTH SURVEY
Table 3. Adjusted prevalence ratio for age and maternal education of risk and protective factors, according to race/skin color, Brazil. PeNSE 2012.
Variables
Race/skin color
White* Black Yellow Brown Indigenous
(ref.) PR (95%CI) PR (95%CI) PR (95%CI) PR (95%CI)
Regular food consumption (≥ 5 times per week)
Beans 1.00 1.06 (1.04 – 1.09) 1.01 (0.97 – 1.05) 1.03 (1.02 – 1.05) 1.03 (0.99 – 1.07)
ref. <0.001 0.627 <0.001 0.189
Fruits 1.00 1.05 (1.01 - 1.09) 1 (0.94 - 1.06) 1 (0.97 - 1.03) 1.03 (0.96 - 1.09)
ref. 0.011 0.945 0.954 0.399
Candies 1.00 1.06 (1.03 - 1.1) 1.07 (1.02 - 1.13) 1.08 (1.05 - 1.1) 0.97 (0.92 - 1.03)
ref. <0.001 0.005 <0.001 0.336
Sot drinks 1.00ref. 0.99 (0.95 - 1.02) 0.97 (0.91 - 1.02) 0.95 (0.93 - 0.97) 0.96 (0.91 - 1.03)
0.429 0.249 <0.001 0.249
Body image
Gordo ou muito gordo 1.00 0.85 (0.81 – 0.89) 0.71 (0.65 – 0.78) 0.81 (0.79 – 0.84) 0.88 (0.8 – 0.96)
ref. <0.001 <0.001 <0.001 0.024
Fat or very fat 1.00 0.98 (0.94 – 1.02) 1.05 (0.97 – 1.12) 1.02 (0.99 – 1.05) 1.12 (1.04 – 1.2)
ref. 0.195 0.713 0.848 0.003
Physical activity 1.00 1.1 (1.01 – 1.19) 1.05 (0.91 – 1.21) 0.89 (0.84 – 0.95) 1.2 (1.05 – 1.38)
ref. 0.047 0.446 0.001 0.010
Smoking in the last 30 days 1.00 0.95 (0.91 – 1) 0.98 (0.91 – 1.06) 0.94 (0.91 – 0.97) 0.96 (0.89 – 1.04)
ref. 0.019 0.510 <0.001 0.302
Smoking at least once during the lifetime 1.00ref. 0.98 (0.94 - 1.01) 0.98 (0.92 - 1.04) 0.91 (0.88 - 0.93) 0.99 (0.93 - 1.06)
0.291 0.790 <0.001 0.998
Alcohol intake in the last 30 days 1.00 0.92 (0.9 - 0.94) 0.99 (0.95 - 1.03) 0.93 (0.92 - 0.95) 0.97 (0.93 - 1.01)
ref. <0.001 0.789 <0.001 0.335
Experimentation with alcohol 1.00ref. 1.08 (1.01 - 1.16)0.004 1.16 (1.04 - 1.3)0.009 0.8 (0.76 - 0.85)<0.001 1.12 (1 - 1.26)0.046
Physical violence 1.00 1.08 (1.04 – 1.13) 1.05 (0.98 – 1.13) 0.95 (0.92 – 0.98) 1.09 (1.02 – 1.17)
ref. <0.001 0.600 <0.001 0.027
Sufered family violence 1.00ref. 1.23 (1.16 – 1.3)<0.001 1.17 (1.06 – 1.28)0.001 1.04 (0.99 – 1.08)0.019 1.3 (1.17 – 1.43)<0.001
Was bullied 1.00 1.13 (1.05 – 1.21) 1.17 (1.04 – 1.31) 0.92 (0.87 – 0.97) 1.07 (0.95 – 1.22)
ref. <0.001 0.012 <0.001 0.298
families with higher educational levels and higher family income. This may also be explai-ned by the greater consumption of processed foods, such as candies in such families19-21. A
study that used data from the Household Budget Survey (acronym in Portuguese – POF), carried out in 2002 and 2003, showed a positive relationship between sugar consumption and having black or brown skin colors21. The consumption of fruits and vegetables, which is
an important protective factor for chronic diseases 22,was lower among brown students.
White adolescents whose mothers had a higher educational level (a proxy for the socioe-conomic class) reported more often feeling fat or very fat, in comparison to the other stu-dents. The excessive concern with weight, the distorted body image, and fear of gaining weight are symptoms of eating disorders, such as anorexia and bulimia. The prevalence of these disorders is higher among white and female adolescents, who belong to higher socioe-conomic classes23. A survey with representative sample of schoolchildren from the city of
Belo Horizonte showed that the desire to be thin was associated with white race/skin color, with those responsible who had a college degree, and with higher socioeconomic classes24.
On the other hand, Pereira and colleagues25, in a study with children and adolescents
from public and private schools in Florianópolis, demonstrated that students with higher socioeconomic status felt dissatisied with thinness, whereas those with lower socioecono-mic status indicated overweight.
This study showed that the frequency of physical activity among adolescents was appro-ximately 20%, and the indigenous adolescents were those who were more engaged in phy-sical activities. This may be due to cultural habits that require intense phyphy-sical activity26,27.
Low frequencies of physical activity observed in this study may be related to the impact attri-buted to the use of technology in modern life, such as television, Internet, mobile phone, and video games, as well as the school physical environment unsuitable for the practice of physical activities and the poor engagement in physical education classes in schools28,29.
The use of cigarettes in the last 30 days preceding the survey was higher among black and indigenous students, and was lower among brown adolescents. The same situation occurred with the use of cigarettes at least once in their lifetime. A study carried out with schoolchil-dren in Londrina, in 2011, found no association of self-reported race/skin color by adolescents with regular tobacco use; however, only two skin color categories were analyzed (white and others)30. According to the National Health Survey (2013), the prevalence of cigarette
smo-kers among adults was higher among black (17.4%; 95%CI 15.4 – 19.3) and brown individuals (15.8%; 95%CI 15.0 – 16.6) than among white people (14.5%; 95%CI 14.0 – 15.0)31. It is worth
noting that, among adolescents, the main factors associated with smoking are age, inluence of friends, smoking parents with lower educational level, and lack of family supervision30,32.
With regard to the use of alcohol in the last 30 days and experimentation with alcohol at least once during their lifetime, white adolescents showed higher risk in comparison to brown individuals in the irst behavior, and black and brown individuals in the second behavior. Another Brazilian study found no diference between alcohol consumption and race/skin color33.
RISK AND PROTECTIVE FACTORS FOR NONCOMMUNICABLE CHRONIC DISEASES
IN ADOLESCENTS BY RACE/SKIN COLOR: NATIONAL ADOLESCENT SCHOOL-BASED HEALTH SURVEY
students (72.4%) compared with white (65.9%) and black students (63.4%). However, the con-sumption of alcoholic beverages in the last 30 days conirms the Brazilian data, being higher among Hispanic (37.5%) and white students (36.3%) than among black students (29.6%)34.
One possible explanation for greater alcohol experimentation/consumption among white adolescents is belonging to more privileged social classes, which is demonstrated in this study by the higher level of maternal education. Having inancial resources available and being independent inluence the consumption of alcohol, tobacco, and marijuana35.
However, it is worth noting that there is evidence of the association of alcohol consump-tion with violent outcomes (homicide) among black adolescents36,37.
Experimentation with illicit drugs was higher among black, yellow, and indigenous ado-lescents, and lower among brown students, compared with white people, after adjusting for age and maternal education. Among African–American adolescents, experimentation with marijuana before 13 years of age was higher than among white adolescents. However, for other drugs such as heroin, cocaine, methamphetamines, and steroids, the highest rates are among white and Hispanic adolescents34. The family and sociocultural contexts in which
the adolescent is inserted are determinants of drug use among adolescents38.
The indicators on violence were less frequent among white adolescents. It is worth noting that black adolescents showed higher risk in the three indicators analyzed (physical violence, family violence, and bullying). A study with community-dwelling female adolescents in Rio de Janeiro found that the prevalence of being a victim or a perpetrator of violence was higher among those who considered themselves black9. The determinants of violence include macro
determinants such as worst living conditions, exclusion in the process of urbanization, expan-sion of drug traicking, and proximal determinants such as alcohol intake, other drugs use, and parental supervision37,39.Authors also indicate that worst health indicators among black
population may be explained by socioeconomic factors, racial prejudice, among others1,2,11.
The role of social inequalities related to race/skin color among individuals is known. This leads to vulnerabilities, especially in the health ield40. Although studies do not indicate
this perspective, the hypothesis of this study indings is that black and indigenous populations live in vulnerable social realities that leads to greater exposure to risk factors for health such as drug use41,42. Racial discrimination experienced by women and men, black and white, occupies
diferent places in social networks, providing diferent experiences9. For yellow adolescents,
factors associated with a behavior of challenging parental limits in a more rigid family struc-ture in terms of education are attributed as possible explanation for health vulnerabilities.
CONCLUSION
The reduction of racial disparities is important to prevent diseases and disorders among adolescents. Studies that address inequalities on race/skin color should be considered in the planning of health policies. Public policies need to provide access to constitutio-nally guaranteed social rights, especially in health, ensuring universal and equal access to health actions and to health services, considering the peculiarities of the population.
1. Krieger N, Rowley DL, Herman AA, Avery B, Phillips MT. Racism, sexism and social class: implications for studies of health, disease and well-being. Am J Prev Med 1993; 9(2): 82–122.
2. Organização Mundial de Saúde. Social determinants of health and well-being among young people. Health Behaviour in School-aged Children (HBSC) study: international report from the 2009/2010 survey. Copenhagen: WHO Regional Oice for Europe; 2012. Disponível em: http://www.euro.who.int/__data/ assets/pdf_ile/0003/163857/Social-determinants-of-health-and-well-being-among-young-people.pdf. (Acessado em: 25 março de 2013).
3. Lee C. “Race” and “ethnicity” in biomedical research: how do scientists construct and explain diferences in health? Social Science & Medicine 2009; 68(6): 1183-90.
4. Ford CL, Airhihenbuwa AC. Critical Race Theory, race equity, and public health: toward antiracism praxis. American Journal of Public Health 2010; 100 (1): S30-5.
5. Kabad JF, Bastos JL, Santos RV. Raça, cor e etnia em estudos epidemiológicos sobre populações brasileiras: revisão sistemática na base PubMed. Physis 2012; 22(3): 895-918.
6. Araújo MM, Malloy-Diniz LF, Rocha FL. Impulsividade e acidentes de trânsito. Rev Psiq Clín 2009; 36(2): 60-8.
7. Costa IER, Ludermir AB, Silva IA. Diferenciais da mortalidade por violência contra adolescentes segundo estrato de condição de vida e raça/cor na cidade do Recife. Ciênc saúde coletiva 2009; 14(5): 1781-88.
8. Barros FC, Victora CG, Horta BL. Ethnicity and infant health in Southern Brazil. A birth cohort study. Int J Epidemiol 2001; 30: 1001-8.
9. Taquette, Stella R. Interseccionalidade de gênero, classe e raça e vulnerabilidade de adolescentes negras às DST/AIDS. Saúde e Sociedade 2010; 19: 51-62.
10. Instituto Brasileiro de Geograia e Estatística (IBGE). Censo Demográico (2010). Rio de Janeiro: IBGE; 2011.
11. Krieger N, Chen JT, Waterman PD, Rehkopf DH,Subramanian SV. Race/ethnicity, gender, and monitoring socioeconomic g radients in health: a comparison of area-based socioeconomic measures-the public health disparities geocoding project. American Journal of Public Health 2003; 93(10): 1655-71.
12. Pearce NP, Foliaki S, Sporle A, Cunningham C. Genetics, race, ethnicity, and health. BMJ 2004; 328: 1070-2.
13. Instituto Brasileiro de Geograia e Estatística (IBGE). Pesquisa Nacional de Saúde do Escolar - PENSE (2009). Rio de Janeiro: IBGE; 2009.
14. Instituto Brasileiro de Geograia e Estatística (IBGE). Pesquisa Nacional de Saúde do Escolar - PENSE (2012). Rio de Janeiro: IBGE; 2013.
15. Malta DC, SardinhaLMV, MendesI, BarretoSM, Giatti L, CastroIRR et al. Prevalência de fatores de risco e proteção de doenças crônicas não transmissíveis em adolescentes: resultados da Pesquisa Nacional de Saúde do Escolar (PeNSE), Brasil, 2009. Ciênc saúde coletiva 2010; 15(2): 3009-19.
16. Malta DC, Porto II, DL, Melo FCM. Família e proteção ao uso de tabaco, álcool e drogas em adolescentes, Pesquisa Nacional. Rev Bras Epidemiol 2011; 14(1): 166-77.
17. Andrade SSCA, Yokota RTC, Sá NNB, Silva MMA, Araújo WN, Mascarenhas MDM, et al. Relação entre violência física, consumo de álcool e outras drogas e bullying entre adolescentes escolares brasileiros. Cad Saúde Pública 2012; 28(9): 1725-36.
18. Kennedy E. Correlates of perceived popularity among peers: a study of race and gender diferences among middle school students. The Journal of Negro Education 1995, 64(2): 186–95.
RISK AND PROTECTIVE FACTORS FOR NONCOMMUNICABLE CHRONIC DISEASES
IN ADOLESCENTS BY RACE/SKIN COLOR: NATIONAL ADOLESCENT SCHOOL-BASED HEALTH SURVEY
20. Vasconcelos FAG. Tendências históricas dos estudos dietéticos no Brasil. Hist cienc sade-Manguinhos 2007; 14(1): 197-219.
21. Coelho AB, Aguiar DRD, Fernandes EA. Padrão de consumo de alimentos no Brasil. Revista de Economia e Sociologia Rural 2009; 47(2): 335-62.
22. World Health Organization. Global status report on noncommunicable diseases 2010. Geneva: World Health Organization; 2011. Disponível em: http:// www.who.int/nmh/publications/ncd_report_full_ en.pdf. (Acessado em: 25 março de 2013).
23. Borges NJ, Sicchieri JM, Ribeiro RP, Marchini JS, dos Santos JE. Transtornos alimentares - quadro clínico. Medicina 2006; 39(3): 340-8.
24. Fernandes AER. Avaliação da imagem corporal, hábitos de vida e alimentares em crianças e adolescentes de escolas públicas e particulares de Belo Horizonte [dissertação]. Belo Horizonte (MG): UFMG; 2007.
25. Pereira EF, Graup S, Lopes AS, Borgatto AF, Daronco LSE. Percepção da imagem corporal de crianças e adolescentes com diferentes níveis socio-econômicos na cidade de Florianópolis, Santa Catarina, Brasil. Rev. Bras. Saude Mater Infant 2009; 9(3): 253-62.
26. Seabra AF, Mendonça DM, Thomis MA, Anjos LA, Maia JA. Determinantes biológicos e sócio-culturais associados à prática de atividade física de adolescentes Biological and socio-cultural determinants of physical activity in adolescents. Cad saúde pública 2008; 24(4): 721-36.
27. Gonçalves H, Hallal PC, Amorim TC, Araújo CL, Menezes AM. Fatores socioculturais e nível de atividade física no início da adolescência. Rev Panam Salud Publica 2007; 22(4), 246-53.
28. Hallal PC, Andersen LB, Bull FC, Guthold R, Haskell W, Ekelund U, Lancet Physical Activity Series Working Group. Global physical activity levels: surveillance progress, pitfalls, and prospects. The lancet 2012; 380(9838): 247-57.
29. Hallal PC, Knuth AG, Cruz DKA, Mendes MI, Malta DC. Prática de atividade física em adolescentes brasileiros. Ciênc Saúde Coletiva 2010; 15(2): 3035-42.
30. Menezes AHR, Dalmas JC, Scarinci IC, Maciel SM, Cardelli AAM. Factores asociados con el consumo regular de tabaco en adolescentes de escuelas públicas en Londrina, Paraná, Brasil. Cad. Saúde Pública 2014; 30(4): 774-84.
31. Instituto Brasileiro de Geograia e Estatística. Pesquisa Nacional de Saúde: Plano Amostral. Rio de Janeiro: IBGE; 2014.
32. Goldade K, Choi K, Bernat DH, Klein EG, Okuyemi KS, Forster J. Multilevel predictors of smoking initiation among adolescents: findings from the Minnesota Adolescent Community Cohort (MACC) study. Preventive medicine 2012; 54(3): 242-46.
33. Souza DPO, Arecob KN, Silveira Filho DX. Álcool e alcoolismo entre adolescentes da rede estadual de ensino de Cuiabá, Mato Grosso. Rev Saúde Pública 2005; 39(4): 585-92.
34. Laura K, Steve K, Shari LS, Katherine HF, Joseph H, William AH, et al. Youth Risk Behavior Surveillance — United States, 2013. MMWR Surveill Summ 2014; 63(4): 1-168.
35. Miller AK, Chandler K. Violence in U.S. Public Schools: 2000 School Survey on Crime and Safety. Statistical Analysis Report. Supported by U.S. Department of Education, Institute of Education Sciences and National Center for Education and Statistics. Washington: Government Printing Oice; 2005.
36. Drumond EDF, Hang-Costa TA, Souza HNFD. Presença de álcool em adolescentes vítimas de homicídios em Belo Horizonte 2005-2009. Revista Mineira de Enfermagem 2014; 18(2): 272-383.
37. Costa IE, Ludermir AB, Silva IA. Diferenciais da mortalidade por violência contra adolescentes segundo estrato de condição de vida e raça/cor na cidade do Recife. Cien Saude Colet 2009; 14(5): 1781-8.
38. Schenker M, Minayo MDS. Fatores de risco e de proteção para o uso de drogas na adolescência. Ciênc Saúde Coletiva 2005; 10(3): 707-17.
39. Soldera M, Dalgalarrondo P, Corrêa Filho HR, Silva CA. Uso de drogas psicotrópicas por estudantes: prevalência e fatores sociais associados. Rev Saúde Pública 2004; 38(2): 277-83.
40. Araújo EMD, Costa MDCN, Hogan VK, Araújo TMD, Dias AB, Oliveira LOA. A utilização da variável raça/ cor em Saúde Pública: possibilidades e limites. Interface (Botucatu) 2009; 13(31): 383-94.
41. Baus J, Kupek E, Pires M. Prevalência e fatores de risco relacionados ao uso de drogas entre escolares. Rev Saúde Pública 2002; 36(1): 40-6.
42. Minayo MCS. A violência na adolescência: um problema de saúde pública. Cad. Saúde Pública 1990; 6(3): 278-92 .
Received on: 12/07/2015