ABSTRACT:Objective: To present trends found in the last three editions of the National Adolescent Student Health Survey (Pesquisa Nacional de Saúde do Escolar - PeNSE) on violent situations experienced by Brazilian students. Methods: Time-series study with a focus on the Brazilian state capitals, using PeNSE databases of 2009, 2012, and 2015. The indicators evaluated were: missing classes due to insecurity in the home-school route or at school; involvement in a fight with firearm or melee weapon; and physical assault by an adult of the family. We estimated the prevalence of indicators according to the total number of adolescents, gender, school type, and capital. Trends in prevalence were estimated by linear regression, adjusted for age. Results: We identified a trend in increasing prevalence, with statistical significance, for all selected violence indicators in the period from 2009 to 2015, in Brazilian state capitals. Discussion: The most vulnerable groups were public schools students; male adolescents for involvement in fights with melee weapons or firearms; and female adolescents for physical assault by family members. Conclusion: PeNSE contributed to identifying the increase in the prevalence of violence experienced by adolescents, which alerts to the need of planning and implementing policies that help to prevent violence, and promote health and a culture of peace.
Keywords: Violence. Adolescent. Adolescent behavior. Aggression.
Trends in violent situations experienced by
Brazilian adolescents: National Adolescent
Student Health Survey 2009, 2012, and 2015
Tendências de situações de violência vivenciadas por adolescentes
brasileiros: Pesquisa Nacional de Saúde do Escolar 2009, 2012 e 2015
Isabella Vitral PintoI, Laura Augusta BarufaldiI, Maryane Oliveira CamposI, Deborah Carvalho MaltaII, Rayone Moreira Costa Veloso SoutoI, Mariana Gonçalves de FreitasI, Cheila Marina de LimaI, Marco Antonio Ratzsch de AndreazziIII
ORIGINAL ARTICLE / ARTIGO ORIGINAL
IDepartment of Noncommunicable Diseases and Health Promotion, Health Surveillance Secretariat, Ministério da Saúde – Brasília (DF), Brazil.
IIUniversidade Federal de Minas Gerais – Belo Horizonte (MG), Brazil.
IIIInstituto Brasileiro de Geografia e Estatística – Rio de Janeiro (RJ), Brazil.
Corresponding author: Isabella Vitral Pinto. SRTV 701, Via W5 Norte, Edifício PO700, 6º andar, CEP: 70723-040, Brasília, DF, Brasil. E-mail: [email protected]
INTRODUCTION
Adolescence is a stage of life in which physical, sexual, cognitive, and emotional changes are prominent, and that establishes behavior patterns of future adults1,2. In this period,
indi-viduals experiment with new practices and behaviors to gain more autonomy, which can lead to exposure to risk situations related to violence and accidents3.
In Brazil, accidents and violence are the main public health problems among children, adolescents, and young adults, having the greatest impact on mortality for these groups3.
In 2014, a study on mortality profile showed that, in the population aged 5 to 14 years, land transport accidents (LTA) topped the list of causes of death, followed by homicides, for both males and females4. In the age group of 15 to 29 years, the main cause of death among
males was homicide (29,830), followed by LTA (12,005); among females, the main cause was LTA (2,148), followed by homicides (1,968)4. According to the World Health Organization
(WHO), for each homicide of a young person, there are around 20 to 40 non-fatal victims of youth violence receiving hospital treatment5, revealing substantial burden of
conse-quences on health systems6.
Among students, participating in physical fights, bullying, and carrying weapons are recognized risk factors for youth violence5. Understanding the impact of intrafamilial
and community violence on adolescents, as well as their participation as perpetrators of violence, is essential to identify violations of human rights and prompt the action of public managers7.
RESUMO:Objetivo: Apresentar as tendências encontradas nas três últimas edições da Pesquisa Nacional de Saúde do Escolar (PeNSE) sobre situações de violência vivenciadas por escolares brasileiros. Metodologia: Estudo de séries temporais com recorte para as capitais brasileiras, utilizando as bases de dados da PeNSE de 2009, 2012 e 2015. Os indicadores avaliados foram: faltar às aulas por insegurança no trajeto casa-escola ou na escola; envolvimento em briga com arma de fogo ou arma branca; e agressão por adulto da família. Foram estimadas as prevalências dos indicadores para o total dos adolescentes, por sexo, tipo de escola e capitais. As tendências das prevalências foram estimadas por meio de regressão linear, ajustadas por idade. Resultados: Identificou-se tendência de aumento das prevalências, com significância estatística, para todos os indicadores de violência selecionados no período de 2009 a 2015, nas capitais brasileiras. Discussão: Os grupos mais vulneráveis foram escolares das escolas públicas; adolescentes do sexo masculino no caso do envolvimento em brigas com arma branca ou de fogo; e adolescentes do sexo feminino no caso de agressão física por familiar. Conclusão: A PeNSE contribuiu para identificar o aumento das prevalências de violências vividas pelos adolescentes, o que alerta para a necessidade de planejamento e implementação de políticas que contribuam para a prevenção de violência, promoção da saúde e da cultura de paz.
The violence suffered and practiced by adolescents interferes with their quality of life, affecting their family, friends, and community, and can cause poor educational performance, risk behaviors in health, disabilities, illnesses, and deaths5,6.
The National Adolescent Student Health Survey (Pesquisa Nacional de Saúde do Escolar - PeNSE) contributes to the monitoring of violent situations experienced by Brazilian students3. This information is key to prevent violence, guide planning, and assess
policies for adolescents8.
The purpose of this article was to present trends found in the last three PeNSE (2009, 2012, and 2015)9-11 in the students’ perception of safety in the school route
and at school, involvement in a fight in which someone used a firearm, involve-ment in a fight in which someone used a melee weapon, and physical assault by family members.
We expect that the results presented in this study contribute to the design of public pol-icies to prevent violence, and promote health and a culture of peace.
METHODS
This is a time-series study with a focus on the Brazilian state capitals, using PeNSE databases – a survey carried out in public and private schools in three editions (2009, 2012, and 2015)9-11. The first edition represented only the Brazilian state capitals; the second
edition expanded its content to include Brazil and its regions. The last sample (2015), in addition to the previous information, brings results for ninth grade students according to states and the Federal District. It also included a national sub-sample to represent stu-dents based on age (13, 14, 15, 16, and 17 years), allowing a more accurate comparison with data from international researches, such as the indicators created by WHO, which encompass more than 100 countries, in the transnational study Global School-based Student Health Survey (GSHS).
The population of the present study consisted of students of the ninth grade of elementary school in public and private schools of the Brazilian state capitals and the Federal District in 2009, 2012, and 2015. In all editions, the sample size cal-culation considered an estimate of proportion of 50% and a probability of type I error or α = 0.05. This is a cluster sample selected in two stages: the first one was
in schools, and the second, in eligible classes of selected schools (ninth grade of elementary school).
The National Committee for Ethics in Research (Comissão Nacional de Ética em Pesquisa - CONEP) approved all editions of the research under the reports no. 11,537/2009, 16,805/2012, and 1,006,467/2015. All students who participated in the interviews agreed with the Informed Consent Form. Details of the methodology of the surveys are available in other publications9-11.
• missed classes due to insecurity in the home-school route: percentage of students who reported having missed at least 1 day of classes in the 30 days prior to data collection due to insecurity in the commute;
• missed classes due to insecurity at school: percentage of students who reported having missed at least 1 day of classes in the 30 days prior to data collection due to insecurity at school; • was involved in a fight in which someone used a firearm: percentage of students who
reported having been involved in a fight in which someone used a firearm (such as revolver or shotgun) in the 30 days prior to data collection;
• was involved in a fight in which someone used a melee weapon: percentage of students who reported having been involved in a fight in which someone used a melee weapon (such as knife, pen knife, chef ’s knife, stone, piece of wood, or bottle) in the 30 days prior to data collection;
• suffered physical assault by an adult of the family: percentage of students who reported having suffered physical assault by an adult of the family at least once in the 30 days prior to data collection.
Initially, data analysis described the general characteristics of students in the three edi-tions of the investigation. Prevalence was estimated sequentially with the respective con-fidence intervals of 95% (95%CI) for violence indicators according to the total number of adolescents, gender, and school type in 2009, 2012, and 2015, considering only data from Brazilian state capitals. Trend estimates in each year were evaluated through linear regres-sion testings adjusted for age, total number of adolescents, gender, school type, and capital. Data analysis was performed in the STATA software, version 14.0, using sample weights that considered the complex sampling of this study. We considered trends with p-value < 0.05 significant. The linear coefficient of the regression line determined the annual mean change of frequencies in percentage points (p.p.) over the period under study.
RESULTS
This study included 173,310 ninth grade students from public and private schools in Brazilian state capitals; result of the samples of three PeNSE surveys: 60,973 in 2009, 61,145 in 2012, and 51,192 in 2015. Out of them, 51.4% were female, most of whom were 14-year-olds (49.9%) and attended public schools (75.5%) (data not shown in table).
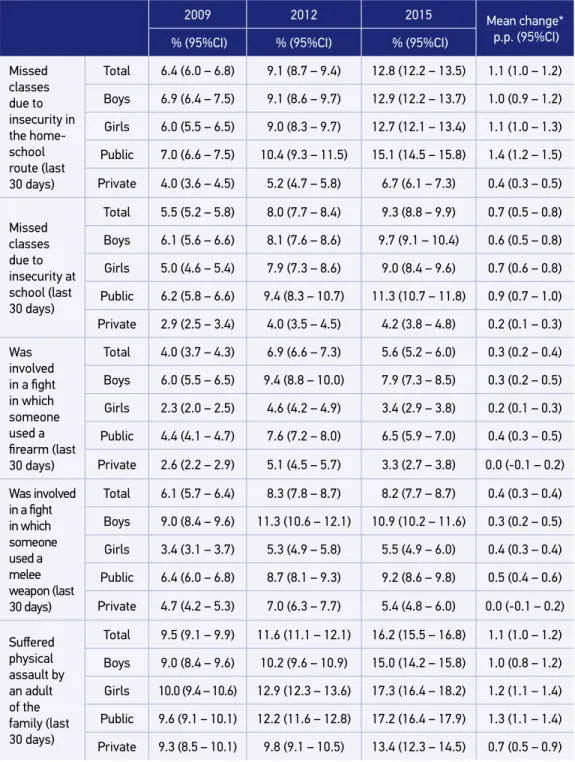
With respect to involvement in fights with firearm and melee weapon, there was also an increase in prevalence. Involvement in fights in which someone used a firearm rose from 4.0% in 2009 to 5.6% in 2015 (mean change = 0.3 p.p.), with male and public school stu-dents presenting the highest prevalence and mean changes (0.3 and 0.4 p.p., respectively). Involvement in fights in which someone used a melee weapon increased from 6.1% in 2009 to 8.2% in 2015 (mean change = 0.4 p.p.). Prevalence of this indicator was also higher for boys and public schools students (Table 1).
There was an increase in prevalence of physical assault by a member of the family, from 9.5% in 2009 to 16.2% in 2015, with a mean change of 1.1 p.p. In this case, the prevalence was higher for female adolescents (10% in 2009 and 17.3% in 2015; mean change = 1.2 p.p.) and public schools students (9.6% in 2009 and 17.2% in 2015; mean change = 1.3 p.p.) (Table 1).
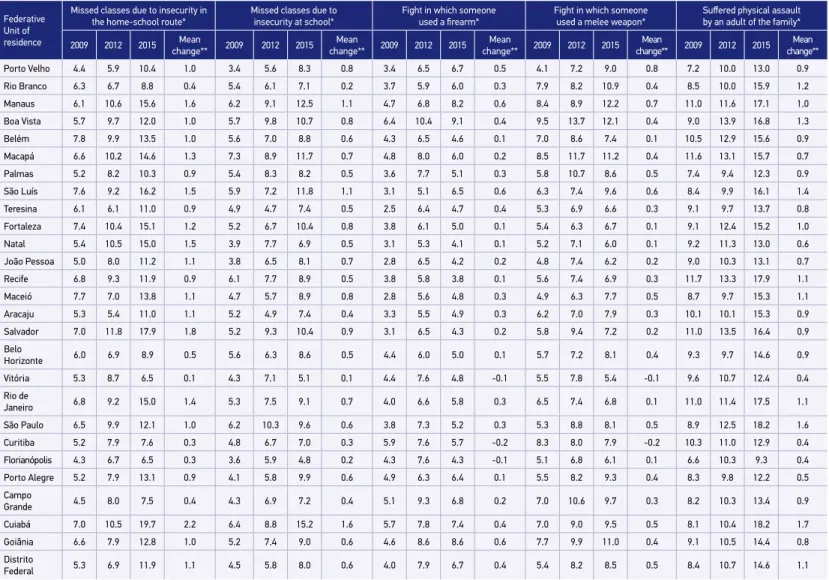
Table 2 shows the prevalence of the assessed indicators and the annual mean change. In all capitals, the trends observed were statistically significant (p-value < 0.05). There was a pos-itive change for indicators of missed classes due to insecurity in the home-school route and at school in all capitals. In 2015, the capitals with the highest prevalence and mean changes for missed classes due to insecurity in the home-school route were Cuiabá (prevalence = 19.7%; mean change = 2.2 p.p.) and Salvador (prevalence = 17.9%; mean change = 1.8 p.p.). For the indicator of missed classes due to insecurity at school, the capitals with highest prev-alence and mean changes in 2015 were Cuiabá (prevprev-alence = 15.2%; mean change = 1.6 p.p.) and Manaus (prevalence = 12.5%; mean change = 1.1 p.p.) (Table 2).
Regarding involvement in a fight in which someone used a firearm, in spite of the low mean changes, most capitals had a statistically significant trend of increase, except Vitória, Curitiba, and Florianópolis, which showed negative trends. The capitals with the highest prevalence for involvement in fights in which someone used a firearm in 2015 were Boa Vista (9.1%) and Goiânia (8.6%). There was also a trend of increase for the indicator of fight in which someone used a melee weapon in most capitals, except Vitória and Curitiba, where the trend was negative. The capitals with the highest prevalence for involvement in fights in which someone used a melee weapon were Manaus and Boa Vista, with prevalence of 12% in 2015. All capitals showed a statistically significant trend of increase for physical assault by an adult of the family. In 2015, the capitals with the highest prevalence were Recife (17.9%) and Manaus (17.1%) and those with highest mean changes were Cuiabá, with 1.7 p.p., and São Paulo, with 1.6 p.p. (Table 2).
DISCUSSION
The current study shows the temporal trend of PeNSE from 2009 to 2015, pointing to an increase in prevalence of violence experienced by adolescents in all indicators studied in this period in Brazilian state capitals.
Table 1. Prevalence and confidence interval of 95% for students of the ninth grade of elementary
school who experienced violent situations in Brazilian state capitals, according to gender and
administrative dependence of the school. Brazil, 2009, 2012, and 2015.
2009 2012 2015 Mean change*
p.p. (95%CI) % (95%CI) % (95%CI) % (95%CI)
Missed classes due to insecurity in the home-school route (last
30 days)
Total 6.4 (6.0 – 6.8) 9.1 (8.7 – 9.4) 12.8 (12.2 – 13.5) 1.1 (1.0 – 1.2)
Boys 6.9 (6.4 – 7.5) 9.1 (8.6 – 9.7) 12.9 (12.2 – 13.7) 1.0 (0.9 – 1.2)
Girls 6.0 (5.5 – 6.5) 9.0 (8.3 – 9.7) 12.7 (12.1 – 13.4) 1.1 (1.0 – 1.3)
Public 7.0 (6.6 – 7.5) 10.4 (9.3 – 11.5) 15.1 (14.5 – 15.8) 1.4 (1.2 – 1.5)
Private 4.0 (3.6 – 4.5) 5.2 (4.7 – 5.8) 6.7 (6.1 – 7.3) 0.4 (0.3 – 0.5)
Missed classes due to insecurity at school (last
30 days)
Total 5.5 (5.2 – 5.8) 8.0 (7.7 – 8.4) 9.3 (8.8 – 9.9) 0.7 (0.5 – 0.8)
Boys 6.1 (5.6 – 6.6) 8.1 (7.6 – 8.6) 9.7 (9.1 – 10.4) 0.6 (0.5 – 0.8)
Girls 5.0 (4.6 – 5.4) 7.9 (7.3 – 8.6) 9.0 (8.4 – 9.6) 0.7 (0.6 – 0.8)
Public 6.2 (5.8 – 6.6) 9.4 (8.3 – 10.7) 11.3 (10.7 – 11.8) 0.9 (0.7 – 1.0)
Private 2.9 (2.5 – 3.4) 4.0 (3.5 – 4.5) 4.2 (3.8 – 4.8) 0.2 (0.1 – 0.3)
Was involved
in a fight
in which someone used a
firearm (last 30 days)
Total 4.0 (3.7 – 4.3) 6.9 (6.6 – 7.3) 5.6 (5.2 – 6.0) 0.3 (0.2 – 0.4)
Boys 6.0 (5.5 – 6.5) 9.4 (8.8 – 10.0) 7.9 (7.3 – 8.5) 0.3 (0.2 – 0.5)
Girls 2.3 (2.0 – 2.5) 4.6 (4.2 – 4.9) 3.4 (2.9 – 3.8) 0.2 (0.1 – 0.3)
Public 4.4 (4.1 – 4.7) 7.6 (7.2 – 8.0) 6.5 (5.9 – 7.0) 0.4 (0.3 – 0.5)
Private 2.6 (2.2 – 2.9) 5.1 (4.5 – 5.7) 3.3 (2.7 – 3.8) 0.0 (-0.1 – 0.2)
Was involved
in a fight
in which someone used a melee weapon (last
30 days)
Total 6.1 (5.7 – 6.4) 8.3 (7.8 – 8.7) 8.2 (7.7 – 8.7) 0.4 (0.3 – 0.4)
Boys 9.0 (8.4 – 9.6) 11.3 (10.6 – 12.1) 10.9 (10.2 – 11.6) 0.3 (0.2 – 0.5)
Girls 3.4 (3.1 – 3.7) 5.3 (4.9 – 5.8) 5.5 (4.9 – 6.0) 0.4 (0.3 – 0.4)
Public 6.4 (6.0 – 6.8) 8.7 (8.1 – 9.3) 9.2 (8.6 – 9.8) 0.5 (0.4 – 0.6)
Private 4.7 (4.2 – 5.3) 7.0 (6.3 – 7.7) 5.4 (4.8 – 6.0) 0.0 (-0.1 – 0.2)
Suffered
physical assault by an adult of the family (last
30 days)
Total 9.5 (9.1 – 9.9) 11.6 (11.1 – 12.1) 16.2 (15.5 – 16.8) 1.1 (1.0 – 1.2)
Boys 9.0 (8.4 – 9.6) 10.2 (9.6 – 10.9) 15.0 (14.2 – 15.8) 1.0 (0.8 – 1.2)
Girls 10.0 (9.4 – 10.6) 12.9 (12.3 – 13.6) 17.3 (16.4 – 18.2) 1.2 (1.1 – 1.4)
Public 9.6 (9.1 – 10.1) 12.2 (11.6 – 12.8) 17.2 (16.4 – 17.9) 1.3 (1.1 – 1.4)
Private 9.3 (8.5 – 10.1) 9.8 (9.1 – 10.5) 13.4 (12.3 – 14.5) 0.7 (0.5 – 0.9)
Table 2. Prevalence for adolescent students of the ninth grade of elementary school who experienced violent situations according to Brazilian
state capitals. Brazil, 2009, 2012, and 2015.
Federative Unit of residence
Missed classes due to insecurity in the home-school route*
Missed classes due to insecurity at school*
Fight in which someone
used a firearm*
Fight in which someone used a melee weapon*
Suffered physical assault
by an adult of the family*
2009 2012 2015 change**Mean 2009 2012 2015 change**Mean 2009 2012 2015 change**Mean 2009 2012 2015 change**Mean 2009 2012 2015 change**Mean
Porto Velho 4.4 5.9 10.4 1.0 3.4 5.6 8.3 0.8 3.4 6.5 6.7 0.5 4.1 7.2 9.0 0.8 7.2 10.0 13.0 0.9
Rio Branco 6.3 6.7 8.8 0.4 5.4 6.1 7.1 0.2 3.7 5.9 6.0 0.3 7.9 8.2 10.9 0.4 8.5 10.0 15.9 1.2
Manaus 6.1 10.6 15.6 1.6 6.2 9.1 12.5 1.1 4.7 6.8 8.2 0.6 8.4 8.9 12.2 0.7 11.0 11.6 17.1 1.0
Boa Vista 5.7 9.7 12.0 1.0 5.7 9.8 10.7 0.8 6.4 10.4 9.1 0.4 9.5 13.7 12.1 0.4 9.0 13.9 16.8 1.3
Belém 7.8 9.9 13.5 1.0 5.6 7.0 8.8 0.6 4.3 6.5 4.6 0.1 7.0 8.6 7.4 0.1 10.5 12.9 15.6 0.9
Macapá 6.6 10.2 14.6 1.3 7.3 8.9 11.7 0.7 4.8 8.0 6.0 0.2 8.5 11.7 11.2 0.4 11.6 13.1 15.7 0.7
Palmas 5.2 8.2 10.3 0.9 5.4 8.3 8.2 0.5 3.6 7.7 5.1 0.3 5.8 10.7 8.6 0.5 7.4 9.4 12.3 0.9
São Luís 7.6 9.2 16.2 1.5 5.9 7.2 11.8 1.1 3.1 5.1 6.5 0.6 6.3 7.4 9.6 0.6 8.4 9.9 16.1 1.4
Teresina 6.1 6.1 11.0 0.9 4.9 4.7 7.4 0.5 2.5 6.4 4.7 0.4 5.3 6.9 6.6 0.3 9.1 9.7 13.7 0.8
Fortaleza 7.4 10.4 15.1 1.2 5.2 6.7 10.4 0.8 3.8 6.1 5.0 0.1 5.4 6.3 6.7 0.1 9.1 12.4 15.2 1.0
Natal 5.4 10.5 15.0 1.5 3.9 7.7 6.9 0.5 3.1 5.3 4.1 0.1 5.2 7.1 6.0 0.1 9.2 11.3 13.0 0.6
João Pessoa 5.0 8.0 11.2 1.1 3.8 6.5 8.1 0.7 2.8 6.5 4.2 0.2 4.8 7.4 6.2 0.2 9.0 10.3 13.1 0.7
Recife 6.8 9.3 11.9 0.9 6.1 7.7 8.9 0.5 3.8 5.8 3.8 0.1 5.6 7.4 6.9 0.3 11.7 13.3 17.9 1.1
Maceió 7.7 7.0 13.8 1.1 4.7 5.7 8.9 0.8 2.8 5.6 4.8 0.3 4.9 6.3 7.7 0.5 8.7 9.7 15.3 1.1
Aracaju 5.3 5.4 11.0 1.1 5.2 4.9 7.4 0.4 3.3 5.5 4.9 0.3 6.2 7.0 7.9 0.3 10.1 10.1 15.3 0.9
Salvador 7.0 11.8 17.9 1.8 5.2 9.3 10.4 0.9 3.1 6.5 4.3 0.2 5.8 9.4 7.2 0.2 11.0 13.5 16.4 0.9
Belo
Horizonte 6.0 6.9 8.9 0.5 5.6 6.3 8.6 0.5 4.4 6.0 5.0 0.1 5.7 7.2 8.1 0.4 9.3 9.7 14.6 0.9
Vitória 5.3 8.7 6.5 0.1 4.3 7.1 5.1 0.1 4.4 7.6 4.8 -0.1 5.5 7.8 5.4 -0.1 9.6 10.7 12.4 0.4
Rio de
Janeiro 6.8 9.2 15.0 1.4 5.3 7.5 9.1 0.7 4.0 6.6 5.8 0.3 6.5 7.4 6.8 0.1 11.0 11.4 17.5 1.1
São Paulo 6.5 9.9 12.1 1.0 6.2 10.3 9.6 0.6 3.8 7.3 5.2 0.3 5.3 8.8 8.1 0.5 8.9 12.5 18.2 1.6
Curitiba 5.2 7.9 7.6 0.3 4.8 6.7 7.0 0.3 5.9 7.6 5.7 -0.2 8.3 8.0 7.9 -0.2 10.3 11.0 12.9 0.4
Florianópolis 4.3 6.7 6.5 0.3 3.6 5.9 4.8 0.2 4.3 7.6 4.3 -0.1 5.1 6.8 6.1 0.1 6.6 10.3 9.3 0.4
Porto Alegre 5.2 7.9 13.1 0.9 4.1 5.8 9.9 0.6 4.9 6.3 6.4 0.1 5.5 8.2 9.3 0.4 8.3 9.8 12.2 0.5
Campo
Grande 4.5 8.0 7.5 0.4 4.3 6.9 7.2 0.4 5.1 9.3 6.8 0.2 7.0 10.6 9.7 0.3 8.2 10.3 13.4 0.9
Cuiabá 7.0 10.5 19.7 2.2 6.4 8.8 15.2 1.6 5.7 7.8 7.4 0.4 7.0 9.0 9.5 0.5 8.1 10.4 18.2 1.7
Goiânia 6.6 7.9 12.8 1.0 5.2 7.4 9.0 0.6 4.6 8.6 8.6 0.6 7.7 9.9 11.0 0.4 9.1 10.5 14.4 0.8
Distrito
Federal 5.3 6.9 11.9 1.1 4.5 5.8 8.0 0.6 4.0 7.9 6.7 0.4 5.4 8.2 8.5 0.5 8.4 10.7 14.6 1.1
and rooted in social relations, but is also built inside the conscience and subjectivities, and cannot be understood just as an external force to individuals and groups. The civilization progress of society can be measured by the way in which it repudiates the use of physical, moral, or political force in favor of the control and the subjugation of another12,13.
In addition, the literature clearly establishes the association between the aggressive behav-ior of young people and increased risk of victimization and involvement in risk behavbehav-iors to health3,6, mainly with the consumption of alcohol and illicit drugs3.
Thus, monitoring violent situations experienced by adolescents is an important public health action. PeNSE allowed us to verify the increase in all forms of violence researched, constituting important evidence that points to the need for policies to reduce social inequal-ities and promote the health of adolescents, mainly in countries where physical assault leads the causes of death among them4.
The increase in prevalence of adolescents victims of violence demonstrates the vul-nerability of this group, which depends on continuous careand public policies for their healthy development14. Therefore, the violation of their rights directly or indirectly affects
their physical and mental health and impacts their educational performance, family, and friends6,15,16. In Brazil, data from the Global Burden of Disease Study 201517 indicates
stabil-ity in homicide mortalstabil-ity rates in the country between 1990 and 2015. However, they also point out that the highest rates occur among young people aged 15 to 19 years, followed by those aged 20 to 24 years. Thus, PeNSE data can signal a worsening in violence indicators among adolescents and young adults.
Data from the three editions of PeNSE demonstrated that violent events were more prevalent in public schools and among male students, except for physical assault by a mem-ber of the family, in which the prevalence was higher for females.
The literature corroborates the fact that violence affects males more frequently, either as perpetrators or victims6,14,18, which relates to the social construction of masculinity linked to
attitudes of violence, strength, aggression, and sexism19,20. In this scenario, homicides, the
more perverse and extreme face of violence, constitutes the main cause of death in indi-viduals aged 15 to 29 years, comprising predominantly young black males who live in the city outskirts and metropolitan areas of urban centers21.
With respect to public schools, this stratum represents an approximation of the eco-nomic condition. Thus, the greater prevalence of violent situations in these schools reveals inequalities in housing, health, education, culture, and leisure activities22. In fact, poverty
situations, economic inequality, and unemployment of one or both parents are risk factors for involvement with violence5,6.
Prevalence of the notion of insecurity in the school route or at school doubled in mag-nitude, considering 2009 and 2015, indicating the progress of violence perceived in this commute and at the institution.
In turn, the perception of insecurity at school is also a reflection of violent situations experienced in its surroundings3, which happens more often in public schools. Violent
sit-uations experienced at school compromise objectives of socialization, education, and pro-tection of this space23.
Researches in several countries have used these indicators to monitor violence at school and its surroundings24. The National Youth Risk Behavior Survey25, held in the United States
with high school students, showed a much lower prevalence in comparison with the one found in PeNSE 2015, revealing that 5.9% of the students did not go to school in the 30 days prior to data collection due to insecurity at school or in the school route25.
A study conducted in three cities of Maranhão, Brazil, found that 22.4% of students and 20.8% of teachers declared that the school was an unsafe place, due to gang activities and violence in school surroundings, bus stops, home-school route, and at school26.
The prev-alence of insecurity experienced by students in schools of this state was almost twice the one observed in PeNSE 2015.
The literature widely discusses the involvement of students in violent behaviors, espe-cially the physical type, presenting quite a diverse prevalence between countries and the different cut-off ages used. The Health Behavior in School-Aged Children27, conducted
among adolescents from Europe, North America, Israel among other countries, in 2009 and 2010, demonstrated that 13% of 13-year-old students and 10% of 15-year-old students were involved in a fight with physical struggle in the 12 months prior to the survey. Moreover, this situation was more frequent with boys (25%) than girls (7%).
The National Study on Drug Use and Health (NSDUH), a population-based survey in the United States with national and state-level representation, with adolescents from 12 to 17 years, pointed out that, in a trend analysis between 2002 and 2014, involvement in fights and violence decreased from a maximum of 33.6% in 2003 to a minimum of 23.7% in 201414.
In the context of the GSHS, data from the Philippines indicated a decrease in prevalence of physical fights between 2003 and 2011 among male – from 51.6 to 42.8% – and female adolescents – from 48.8 to 30.6%28.
The use of firearm or melee weapon in fights aggravates the injuries and morbidity among young people25. Involvement of Brazilian students in fights in which someone
used a melee weapon increased throughout PeNSE editions. Involvement of Brazilians students in fights in which someone used a firearm also increased between PeNSE 2009 and 2015.
Research performed in the United States found that 16.6% of American students took a melee weapon to school in the 30 days prior to the survey, while 5.1% took a firearm25.
Even though PeNSE does not monitor these variables, they present a risk exposure to the use of these weapons in schools, especially in conflict situations.
In all editions of PeNSE, involvement in fights with the use of firearms and melee weap-ons was at least twice as high among male adolescents than females. This fact reveals the sociocultural differences regarding gender roles, in which weapons are used to materialize the power and submission of others, in the exercise of the hegemonic masculinity, related to virility, competition, and aggressiveness29.
Domestic violence had the highest prevalence in comparison with other indicators, in all editions of PeNSE. The higher incidence of domestic violence against girls stands out, which is consistent with the literature and reflects the patriarchal culture and gender dom-ination3,30. For its intimate character, associated with the power relations within the family,
it has great potential to be of repetitive nature, which can result in changes in physical, psy-chological, and social development31,32.
In 2015, the Notifiable Diseases Information System (Sistema de Informação de Agravos de Notificação - SINAN) received 30,989 reports of cases of violence against female adolescents aged 13 to 19 years4. Profile analysis of notifications of violence
against this group showed that physical assaults were more prevalent (44.5%), with 54.7% of the cases occurring in the residence. The main aggressors were spouse/ ex-spouse/boyfriend/ex-boyfriend (22.7%), followed by father/stepfather/mother/ stepmother (20.8%)4.
Among the limitations of this study, we underline that PeNSE is a cross-sectional study and the sample consists of students, which may not represent the universe of adolescents, especially those outside of school, who could have even more frequent problems with violence. The comparison of trends occurred through distinct cross-sec-tional studies, without following the evolution of the individuals, as with longitudinal studies. However, the literature indicates cross-sectional studies to monitor trends33,
and PeNSE fulfilled this role.
CONCLUSION
The temporal trend study indicated an increase in prevalence of violence experienced by adolescents in all indicators studied from 2009 to 2015 in Brazilian state capitals.
The most vulnerable groups were public school students, male adolescents for involve-ment in fights with melee weapons or firearms, and female adolescents for physical assault by family members. In places where students stay most of the time, where they should be safe and have their healthy development provided, as at home or school, vic-timization happens in a significant, and sometimes predominant, way. Future analyses considering race/color characteristics of students could identify groups with a higher risk for victimization.
1. Assis SG. A adolescente e a violência. In: Taquette SR, Ed. Violência contra a mulher adolescente-jovem. Rio de Janeiro: EdUERJ; 2007.
2. Clark T, Fleming T, Bullen P, Crengle S, Denny S, Dyson B, et al. Health and well-being of secondary school students in New Zealand: Trends between 2001, 2007 and 2012. J Paediatrics Child Health. 2013; 49(11): 925-34. https://doi.org/10.1111/jpc.12427
3. Andrade SSCDA, Yokota RTDC, Bandeira de Sá NN, Silva MMAD, Araújo WND, Mascarenhas MDM, et al. Relação entre violência física, consumo de álcool e outras drogas e bullying entre adolescentes escolares brasileiros. Cad Saúde Pública. 2012; 28(9): 1725-36. http://dx.doi.org/10.1590/S0102-311X2012000900011
4. Brasil. Ministério da Saúde. Secretaria de Vigilância em Saúde. Departamento de Vigilância de Doenças e Agravos Não Transmissíveis e Promoção da Saúde. Violência contra a mulher: o desafio de articulação da vigilância com a rede de atenção e proteção. In: Brasil. Ministério da Saúde. Saúde Brasil 2015/2016: uma análise da situação de saúde e da epidemia pelo vírus Zica e por outras doenças transmitidas pelo Aedes aegypti. Brasília: Ministério da Saúde; 2016.
5. Organização Mundial de Saúde. World report on violence and health. Genebra: WHO; 2002.
6. Organização Mundial da Saúde. Prevenindo a violência juvenil: um panorama das evidências. Genebra: OMS; 2015.
7. Souza ER, Peres MFT, Constantino P, Boghossian CO, Ruotti C, Freitas TV, et al. Jovens em risco social: avaliação de programas de prevenção à violência armada. Rio de Janeiro: Centro Latino-Americano de Estudos de Violência e Saúde Jorge Careli, Escola Nacional de Saúde Pública Sergio Arouca, Fundação Oswaldo Cruz / São Paulo: Editora Hucitec; 2013. 166 p.
8. Phebo L. Vigilância em saúde e a violência contra adolescentes. In: Taquette SR, Ed. Violência contra a mulher adolescente-jovem. Rio de Janeiro: EdUERJ; 2007.
9. Instituto Brasileiro de Geografia e Estatística. Pesquisa Nacional de Saúde do Escolar 2009. Rio de Janeiro: IBGE; 2009.
10. Instituto Brasileiro de Geografia e Estatística. Pesquisa Nacional de Saúde do Escolar 2012. Rio de Janeiro: IBGE; 2012.
11. Instituto Brasileiro de Geografia e Estatística. Pesquisa Nacional de Saúde do Escolar 2015. Rio de Janeiro: IBGE; 2015.
12. Domenach JM. La violencia. In: Organização das Nações Unidas para a Educação, a Ciência e a Cultura, Ed. La violencia y sus causas. Paris: UNESCO; 1981. p. 33-45.
13. Minayo MCS. Violência e educação: impactos e tendências. Rev Pedagógica. 2013; 15(31): 249-64. http://dx.doi.org/10.22196/rp.v15i31.2338
14. Salas-Wright CP, Nelson EJ, Vaughn MG, Reingle Gonzalez JM, Córdova D. Trends in Fighting and Violence Among Adolescents in the United States, 2002–2014. Am J Public Health. 2017; 107(6): 977-82. https://doi.org/10.2105/AJPH.2017.303743
15. Deslandes SF. Atenção a crianças e adolescentes vítimas de violência doméstica: análise de um serviço. Cad Saúde Pública. 1994; 10(Supl. 1): S177-87. http:// dx.doi.org/10.1590/S0102-311X1994000500013
16. Souza ER, Mello Jorge MHP. Impacto da violência na infância e adolescência brasileiras: magnitude da morbimortalidade. In: Brasil. Ministério da Saúde. Violência faz mal à saúde. Brasília: Ministério da Saúde; 2006. p. 23-28.
17. Malta DC, Minayo MCS, Soares Filho AM, Silva MMA, Montenegro MMS, Ladeira RM, et al. Mortalidade e anos de vida perdidos por violências interpessoais e autoprovocadas no Brasil e Estados: análise das estimativas do Estudo Carga Global de Doença, 1990 e 2015. Rev Bras Epidemiol [Internet]. 2017 [citado em 13 dez. 2017]; 20(Supl. 1): 142-56. Disponível em: http://www.scielo. br/scielo.php?script=sci_arttext&pid=S1415-790X2017000500142&lng=en http://dx.doi. org/10.1590/1980-5497201700050012
18. Organização Mundial de Saúde. World report on child injury prevention. Genebra: OMS; 2008.
19. Guimarães NM, Pasian SR. Agressividade na adolescência: experiência e expressão da raiva. Psicol Estud. 2006; 11(1): 89-97. http://dx.doi.org/10.1590/ S1413-73722006000100011
20. García M, Madriaza P. Estudio cualitativo de los determinantes de la violencia escolar en Chile. Estud Psicol. 2006; 11(3): 247-56. http://dx.doi.org/10.1590/ S1413-294X2006000300001
21. Souto RMCV, Barufaldi LA, Nico LS, Freitas MG. Perfil epidemiológico do atendimento por violência nos serviços públicos de urgência e emergência em capitais brasileiras, Viva 2014. Ciênc Saúde Coletiva. 2017; 22(9): 2811-23. http://dx.doi. org/10.1590/1413-81232017229.13342017
22. Malta DC, Souza ER, Silva MMA, Silva CS, Andreazzi MAR, Crespo C, et al. Vivência de violência entre escolares brasileiros: resultados da Pesquisa Nacional de Saúde do Escolar (PeNSE). Ciênc Saúde Coletiva. 2010; 15(Supl. 2): 3053-63. http://dx.doi.org/10.1590/ S1413-81232010000800010
© 2018 associação Brasileira de saúde coletiva This is an open access article distributed under the terms of the creative commons license.
23. Castro ML, Cunha SS, Souza DPO. Comportamento de violência e fatores associados entre estudantes de Barra do Garças, MT. Rev Saúde Pública. 2011; 45(6): 1054-61. http://dx.doi.org/10.1590/ S0034-89102011005000072
24. Granero R, Poni ES, Escobar-Poni BC, Escobar J. Trends of violence among 7th, 8th and 9th grade students in the state of Lara, Venezuela: The Global School Health Survey 2004 and 2008. Arch Public Health. 2011; 69(1): 7. https://dx.doi.org/10.1186%2F0778-7367-69-7
25. Centers for Disease Control and Prevention. National Youth Risk Behavior Survey (YRBS). Atlanta: CDC [Internet]. [citado em 28 set. 2017] Disponível em: http://www.cdc.gov/HealthyYouth/yrbs/index.htm
26. Macedo RMA, Bomfim MCA. Violências na escola. Rev Diálogo Educ. 2009; 9(28): 605-18. http://dx.doi. org/10.7213/rde.v9i28.3343
27. Organização Mundial de Saúde. Social determinants of health and well-being among young people: Health Behaviour in School-Aged Children (HBSC) study. International report from the 2009/2010 survey. Genebra: OMS; 2012.
28. Peltzer K, Pengpid S. Health risk behaviour among in-school adolescents in the Philippines: Trends between 2003, 2007 and 2011, a cross-sectional study. Int J Environ Res Public Health. 2015; 13(1): 73-84. https:// doi.org/10.3390/ijerph13010073
29. Souza ER. Masculinidade e violência no Brasil: contribuições para a reflexão no campo da saúde. Ciênc Saúde Coletiva. 2005; 10: 59-70. http://dx.doi. org/10.1590/S1413-81232005000100012
30. Minayo MC. Laços perigosos entre machismo e violência. Ciênc Saúde Coletiva. 2005; 10(1). http:// dx.doi.org/10.1590/S1413-81232005000100005
31. Stoddard SA, Henly SJ, Sieving RE, Bolland J. Social connections, trajectories of hopelessness and serious violence in impoverished urban youth. J Youth Adolesc. 2011; 40(3): 278-95. https://doi.org/10.1007/s10964-010-9580-z
32. Brasil. Lei nº 8.069 de 13 de julho de 1990. Dispõe sobre o Estatuto da Criança e do Adolescente e dá outras providências. Diário Oficial da União. 1990; Seção 1: 13563.
33. Malta DC, Stopa SR, Santos MAS, Andrade SSCA, Oliveira TP, Cristo EB, et al. Evolution of tobacco use indicators according to telephone surveys, 2006-2014. Cad Saúde Pública [Internet]. 2017 [citado em 13 dez. 2017]; 33(Supl. 3): e00134915. Disponível em: http://www.scielo.br/scielo.php?script=sci_ arttext&pid=S0102-311X2017001505008&lng=en http://dx.doi.org/10.1590/0102-311x00134915
Received on: 10/20/2017