ABSTRACT:Objective:To analyze the socioeconomic inequalities in medical visits (MV) in the past year in Brazil. Methods: Data from adults aged ≥ 20 years old who participated in the Brazilian National Household Surveys and living in the Northeastern (2003; n = 75,652 and 2008, n = 79,779) and Southeastern (2003; n = 76,029 and 2008; n = 79,356) regions were analyzed according to MV. We compared MVs according to demographic and health variables in the first (D1) and last (D10) per capita family income deciles. All analyses considered the complex cluster design. Results: The proportion of people who had MV during this period increased in the Northeastern (from 61.2 to 66.9%) and the Southeastern (from 67.9 to 73.5%) regions. The absolute difference (AD) in the use of MV, according to D1 and D10 in this period, was equal to 6.4 percentage points (pp) in the Northeastern and 4.2 pp in the Southeastern regions. Significant reduction in inequalities was observed among men without chronic diseases, in those who had a positive perception of their health, and among those without health insurance which included MV. The Southeastern region has also showed significant reduction among those with chronic disease (8 pp) and with negative health self-perception (6 pp). Conclusion: The increasing number of MVs was found in Brazil. However, persistent inequalities were observed between the poorest and the richest, higher in the Northeastern than in the Southeastern region. More effective and equitable policies to reduce health inequalities should be adopted in Brazil.
Keywords: Health services. Health inequalities. Socioeconomic factors. Epidemiology. Brazil. Medical consultation.
Reduction of inequalities in medical visits
in Brazil: analysis of the Northeastern and
Southeastern regions between 2003 and 2008
Redução das desigualdades no uso de consultas médicas no Brasil:
análise das regiões Nordeste e Sudeste entre 2003 e 2008
Paulo Sérgio Cardoso da SilvaI, Antonio Fernando BoingI, Karen Glazer PeresI,II ORIGINAL ARTICLE / ARTIGO ORIGINAL
IGraduate Program in Collective Health, Public Health Department, Universidade Federal de Santa Catarina – Florianópolis (SC), Brazil.
IIAustralian Research Centre for Population Oral Health, School of Dentistry, The University of Adelaide – Adelaide, Australia.
Corresponding author: Karen Glazer Peres. Universidade Federal de Santa Catarina. Campus Universitário, Trindade, CEP: 88010-970, Florianópolis, SC, Brasil. E-mail: [email protected]
INTRODUCTION
Based on the Brazilian Constitution of 1988, health began to be recognized in the country as a right to all citizens and a duty of the state. In the early 1990s, with the regulation of health actions and services by laws n. 8.080/90 and 8.142/90, a legal base was created for the principles that structure the universal and redistributive
model of the Unified Health System (SUS)1.
However, even if SUS was built on healthcare equity, in the national context it is possible to observe important differences regarding the access and the use of health services. Among the main determining variables, it is important to emphasize the socioeconomic profile of people, their health-related characteristics and the demand for care, as well as the structure of the offered services2-4. Many studies show that women use health services more often, as well as older people and people with chronic conditions5,6.
With regard to socioeconomic inequalities, Travassos et al.7 identified, in the
1990s, more medical visits in Brazil among the richer population, and there was only
RESUMO:Objetivo: Analisar as desigualdades socioeconômicas na utilização de consultas médicas (CM) no último ano no Brasil. Métodos: Dados da Pesquisa Nacional por Amostra de Domicílios (≥ 20 anos de idade) das Regiões Nordeste (2003, n = 75.652 e 2008, n = 79.779) e Sudeste (2003, n = 76.029 e 2008, n = 79.356) foram analisados segundo CM. Compararam-se as prevalências de CM segundo as variáveis exploratórias demográficas e de saúde no primeiro (D1) e último (D10) decil de renda familiar per capita. As análises consideraram o desenho amostral complexo. Resultados: A proporção de pessoas com CM aumentou no período na Região Nordeste (61,2 para 66,9%) e Sudeste (67,9 para 73,5%). A diferença absoluta de CM, segundo D1 e D10 no período, foi de 6,4 pontos percentuais (pp) no Nordeste e 4,2 pp no Sudeste. Houve importante redução das desigualdades entre os homens; naqueles sem doenças crônicas; naqueles que tinham uma percepção positiva da sua saúde e naqueles sem plano de saúde com direito a CM. A Região Sudeste ainda apresentou redução entre aqueles com apenas uma morbidade autorreferida (8 pp) e com percepção negativa da saúde (6 pp). Conclusão: Houve aumento de CM no Brasil. Observa-se ainda persistente desigualdade entre os mais pobres e os mais ricos, maior no Nordeste do que no Sudeste. Políticas para a redução da desigualdade em saúde mais eficazes e equânimes devem ser adotadas no Brasil.
a slight reduction of such a difference between 1989 and 1996/7. By analyzing the outcome between 1998 and 2008, Viacava8 identified that all Brazilian regions presented increasing percentage of financial care provided by SUS; the Northeastern region was the most prevalent one (68.6%), and the Southeastern region, the least prevalent one
(49.9%) in 20088. However, the variations in socioeconomic inequalities concerning
medical visits were not analyzed in the regions in the context of amplified access. Marked by major social inequalities, the National Commission on Social Determinants of Health recommends the encouragement for the production of evidence regarding the magnitude of such inequalities in Brazil, as well as the social determinants of health, in order to subsidize the construction of public policies addressed to the reduction of social and health-related inequalities in Brazil. The association between the use of health services and other demographic, socioeconomic and behavioral variables needs to be further analyzed so that public policies can be better oriented6.
The Brazilian National Household Survey (PNAD) between 1998 and 2008 included, every 5 years, a set of questions related to health, which is added to the socioeconomic questions that are regularly collected. This instrument enables the acquirement of information about perceived morbidity, access to health services, plan coverage, use of health services, among others that are extremely relevant. Besides, its sampling
process allows comparing the results between the years when it was conducted9.
By considering that Brazil presents inequalities concerning the use of health services in its macro-regions, and due to the fact that the Northeastern and the Southeastern regions presented, throughout its history, remarkable inequality in terms of use of health services7,10, knowing the magnitude of these inequalities can help to create more efficient and equal public policies, favoring the reduction of health inequalities in Brazil. The relevance of the analysis of medical visits stands out, since they are characterized as the main demand of the health system, overloading it in terms of time, due to the higher demand of services, and also financially, because of the higher
number of requests for complementary examinations11.
Being aware of the magnitude and the variation of inequalities concerning the use of medical visits is essential to plan and organize health services12. The constant control of the variables related to the use of health services allows health policies to be better oriented in search for universality and equality5.
The objective of this study was to analyze the magnitude of socioeconomic inequalities in medical visits in the Southeastern and Northeastern regions of Brazil, from 2003 to 2008.
METHODS
PNAD 2003 was performed in a total of 133,255 households, and 384,834 people
participated13. In 2008, 150,591 household units were surveyed, distributed in all
Units of the Federation, accounting for a total of 391,868 people. PNAD counts on a probability sample of households that allows the inference of its results all over Brazil. The sampling process is conducted in several stages, and the cities are considered as primary units; the census sectors are considered as secondary units; and the households are considered as tertiary units. The survey is applied to all people living in the surveyed households. The methodology of PNAD predicts the use of substitute respondents. Additional details about the PNAD sample can be
consulted in publications from IBGE9. For this study, data from PNAD 2003 and
2008 were used referring to adults (≥ 20 years old or more) from the Northeastern (2003, n = 75,652 and 2008, n = 79,779) and Southeastern regions (2003, n = 76,029 and 2008, n = 79,356).
The analyzed outcome was the use of medical visits, and this information was obtained by the question “Did you see a doctor in the past 12 months?”. The exploratory variables were gender (male; female), age in years per age group (20 to 29; 30 to 39; 40 to 49; 50 to 59 and 60 years old or more), per capita family income decile, self-reported morbidity (no diseases; one; two or more), health self-perception (positive; negative) and having a health insurance plan giving access to medical visits (yes; no). The per capita family income variable was built based on the ratio between monthly family income for all of the household units (which excludes pensioners, domestic workers and their relatives), being afterwards classified in income deciles. Missing values were excluded for not being representative (< 0.01% of the sample). For the analysis of socioeconomic inequalities, the associations of the outcome with the other variables were tested, and the prevalence of the outcome in the first (D1) and the last (d10) per capita family income decile was estimated for both years (2003 and 2008). The ratio of the proportions of individuals who visited a doctor in the past 12 months was calculated between the richest (D10) and the poorest (D1) people in the Northeastern and Southeastern regions and in both periods (2003 and 2008). The descriptive statistics about the use of medical visits in Brazil and other variables considered the 95% confidence interval (95%CI). In order to test
the significance of the sample, the χ2 test was used. The investigated subsamples
were large enough to obtain 80% power or more to test the associations between the independent variables and the outcome, by considering the exposure frequency between 38.9 and 86.1%, alpha error of 5% and minimum prevalence ratio of 1.2.
of the participants, the proposal of this study was not submitted to the Research Ethics Committee.
RESULTS
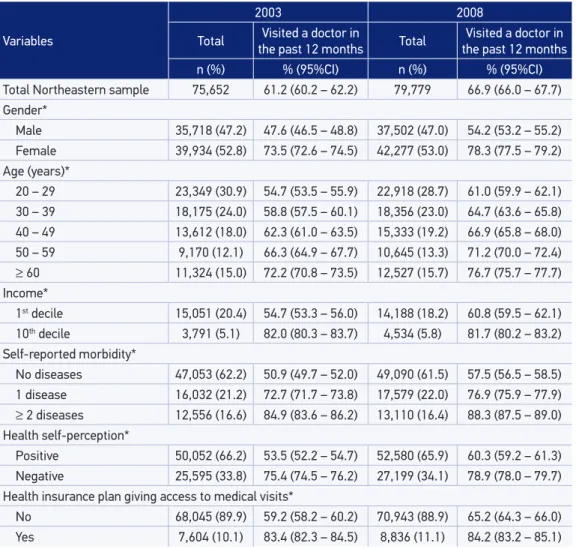
In the Northeastern Region, it was possible to observe the increasing proportion of people who visited a doctor in the past year, ranging from 61.2% (2003) to 66.9% (2008). There was also a higher prevalence of medical visits among women and older people, both in 2003 and 2008. The prevalence among those who belong to the richest decile was higher than among the ones belonging to the poorest decile in both years; however, the increase was significant for those belonging to the poorest decile (54.7 to 60.8%), and because of this fact, the inequality between the deciles from 2003 and 2008 reduced. The higher the number of chronic conditions, the higher the attendance to the doctor. Individuals with negative health self-perception presented higher prevalence of medical visits in both investigated years, when compared to those with positive health self-perception. The prevalence of medical visits from 2003 to 2008 changed little among those with health insurance plans; however, it was more expressive for those without a health insurance plan (Table 1).
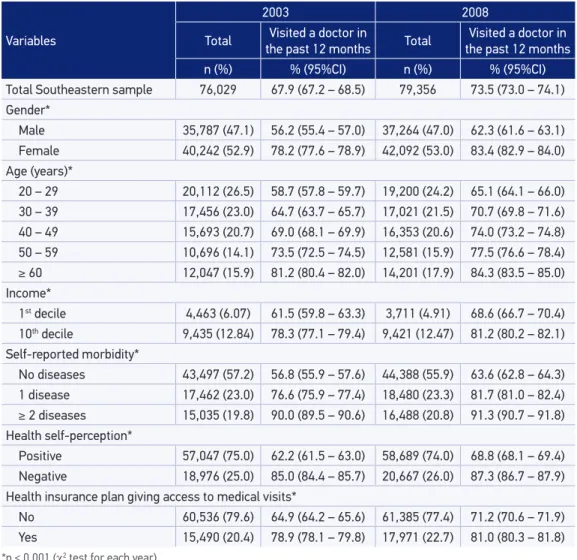
In the Southeastern region, the proportion of people who visited a doctor in the past year also increased, ranging from 5.6 percentage points (pp), from 2003 to 2008. Besides, as well as in the Northeastern region, women visited the doctor more often, as well as older and richer people in both analyzed periods. By analyzing the poorest decile, it was possible to observe increasing prevalence of medical appointments from 2003 to 2008 (61.5 to 68.6%), which contributed with the reduced inequality between the richest and the poorest. The ones with two or more chronic conditions also visited doctors more often than people with only one chronic disease. There was increasing prevalence of medical visits for people without health insurance plans (6.3 pp) and the ones with health insurance plan with access to medical visits (2.1 pp) in the analyzed periods (Table 2).
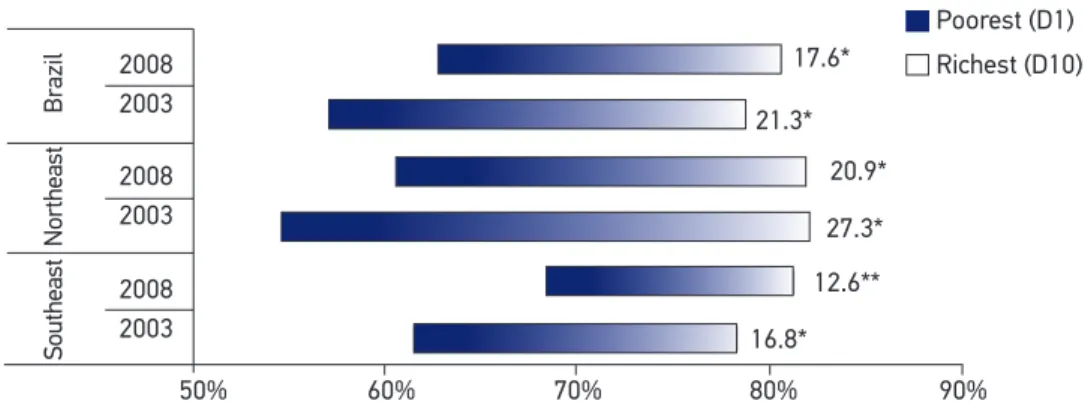
Brazil presented reduced inequality in the prevalence of medical visits from 2003 to 2008, therefore, the relationship between the poorest and the richest decreased 3.7 pp in the analyzed period. When the Northeastern region was analyzed, it was possible to observe reduced inequality in the prevalence of medical visits between the poorest (D1) and the richest (D10) from 2003 to 2008, of 6.4 pp, while in the Southeastern region this reduction was lower (4.2 pp) (Figure 1).
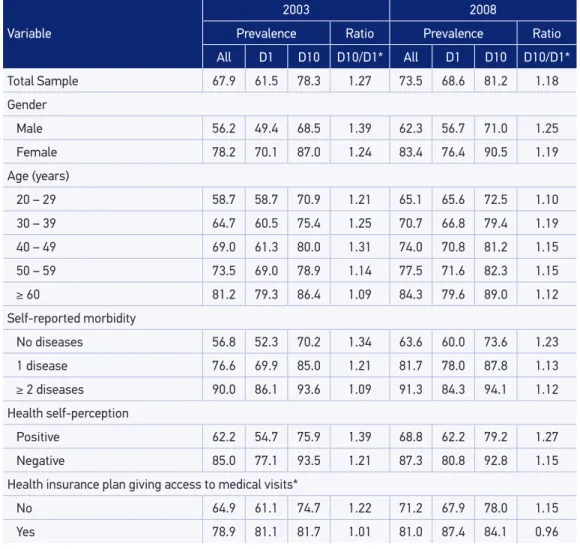
analyzed, there was a reduction of about 13.9% in inequality (1.87 in 2003 to 1.61 in 2008). Among women, such a reduction was of approximately 9% in the same period. The prevalence ratio of medical visits between the richest (D10) and the poorest (D1) decreased in all age groups, from 2003 to 2008. A higher prevalence was observed in terms of medical visits among those with two or more chronic conditions. For those without chronic diseases, there was a reduction in terms of inequality of about 15.6% (1.67 in 2003 to 1.41 in 2008). The ratio between the poorest and the richest (D10/D1) decreased approximately 15.4% among those who had a positive perception of health (D10/D1 of 1.75 in 2003, and 1.48 in 2008). Among those without health insurance, it was possible to observe increasing prevalence of medical visits among the poorest (54.6%
Table 1. Prevalence and distribution of variables related to medical visits in the past year in the Northeast. Brazil, 2003 (n = 75,652) and 2008 (n = 79,779).
Variables
2003 2008
Total the past 12 months Visited a doctor in Total the past 12 months Visited a doctor in
n (%) % (95%CI) n (%) % (95%CI)
Total Northeastern sample 75,652 61.2 (60.2 – 62.2) 79,779 66.9 (66.0 – 67.7) Gender*
Male 35,718 (47.2) 47.6 (46.5 – 48.8) 37,502 (47.0) 54.2 (53.2 – 55.2)
Female 39,934 (52.8) 73.5 (72.6 – 74.5) 42,277 (53.0) 78.3 (77.5 – 79.2)
Age (years)*
20 – 29 23,349 (30.9) 54.7 (53.5 – 55.9) 22,918 (28.7) 61.0 (59.9 – 62.1)
30 – 39 18,175 (24.0) 58.8 (57.5 – 60.1) 18,356 (23.0) 64.7 (63.6 – 65.8)
40 – 49 13,612 (18.0) 62.3 (61.0 – 63.5) 15,333 (19.2) 66.9 (65.8 – 68.0)
50 – 59 9,170 (12.1) 66.3 (64.9 – 67.7) 10,645 (13.3) 71.2 (70.0 – 72.4)
≥ 60 11,324 (15.0) 72.2 (70.8 – 73.5) 12,527 (15.7) 76.7 (75.7 – 77.7)
Income*
1st decile 15,051 (20.4) 54.7 (53.3 – 56.0) 14,188 (18.2) 60.8 (59.5 – 62.1)
10th decile 3,791 (5.1) 82.0 (80.3 – 83.7) 4,534 (5.8) 81.7 (80.2 – 83.2)
Self-reported morbidity*
No diseases 47,053 (62.2) 50.9 (49.7 – 52.0) 49,090 (61.5) 57.5 (56.5 – 58.5)
1 disease 16,032 (21.2) 72.7 (71.7 – 73.8) 17,579 (22.0) 76.9 (75.9 – 77.9)
≥ 2 diseases 12,556 (16.6) 84.9 (83.6 – 86.2) 13,110 (16.4) 88.3 (87.5 – 89.0)
Health self-perception*
Positive 50,052 (66.2) 53.5 (52.2 – 54.7) 52,580 (65.9) 60.3 (59.2 – 61.3)
Negative 25,595 (33.8) 75.4 (74.5 – 76.2) 27,199 (34.1) 78.9 (78.0 – 79.7)
Health insurance plan giving access to medical visits*
No 68,045 (89.9) 59.2 (58.2 – 60.2) 70,943 (88.9) 65.2 (64.3 – 66.0)
Yes 7,604 (10.1) 83.4 (82.3 – 84.5) 8,836 (11.1) 84.2 (83.2 – 85.1)
*p < 0.001 (χ2 test for each year).
in 2003 to 60.7% in 2008), which explains the decreasing ratio between groups (D10/D1) of about 10.1% in the analyzed period (from 1.39, in 2003, to 1.25, in 2008) (Table 3).
In the Southeast, there was increasing prevalence of medical visits in all of the categories. The ratio between the richest and the poorest (D10/D1) decreased from 2003 to 2008 in both genders, being higher among men (10.1%) than women (4%). For those aged less than 50 years old, it was possible to observe decreasing ratio between the richest and the poorest (D10/D1) from 2003 to 2008 (9.1, 4.8 and 12.2%, respectively). Both for the poorest (D1) and the richest (D10), there was increasing prevalence in medical visits in all of the categories involving the number of chronic diseases, except for the poorest participants (D1) with two or more chronic diseases,
Table 2.Prevalence and distribution of variables related to medical visits in the past year in the Southeast. Brazil, 2003 (n = 76,029) and 2008 (n = 79,356).
Variables
2003 2008
Total Visited a doctor in
the past 12 months Total the past 12 monthsVisited a doctor in
n (%) % (95%CI) n (%) % (95%CI)
Total Southeastern sample 76,029 67.9 (67.2 – 68.5) 79,356 73.5 (73.0 – 74.1) Gender*
Male 35,787 (47.1) 56.2 (55.4 – 57.0) 37,264 (47.0) 62.3 (61.6 – 63.1)
Female 40,242 (52.9) 78.2 (77.6 – 78.9) 42,092 (53.0) 83.4 (82.9 – 84.0)
Age (years)*
20 – 29 20,112 (26.5) 58.7 (57.8 – 59.7) 19,200 (24.2) 65.1 (64.1 – 66.0)
30 – 39 17,456 (23.0) 64.7 (63.7 – 65.7) 17,021 (21.5) 70.7 (69.8 – 71.6)
40 – 49 15,693 (20.7) 69.0 (68.1 – 69.9) 16,353 (20.6) 74.0 (73.2 – 74.8)
50 – 59 10,696 (14.1) 73.5 (72.5 – 74.5) 12,581 (15.9) 77.5 (76.6 – 78.4)
≥ 60 12,047 (15.9) 81.2 (80.4 – 82.0) 14,201 (17.9) 84.3 (83.5 – 85.0)
Income*
1st decile 4,463 (6.07) 61.5 (59.8 – 63.3) 3,711 (4.91) 68.6 (66.7 – 70.4)
10th decile 9,435 (12.84) 78.3 (77.1 – 79.4) 9,421 (12.47) 81.2 (80.2 – 82.1)
Self-reported morbidity*
No diseases 43,497 (57.2) 56.8 (55.9 – 57.6) 44,388 (55.9) 63.6 (62.8 – 64.3)
1 disease 17,462 (23.0) 76.6 (75.9 – 77.4) 18,480 (23.3) 81.7 (81.0 – 82.4)
≥ 2 diseases 15,035 (19.8) 90.0 (89.5 – 90.6) 16,488 (20.8) 91.3 (90.7 – 91.8)
Health self-perception*
Positive 57,047 (75.0) 62.2 (61.5 – 63.0) 58,689 (74.0) 68.8 (68.1 – 69.4)
Negative 18,976 (25.0) 85.0 (84.4 – 85.7) 20,667 (26.0) 87.3 (86.7 – 87.9)
Health insurance plan giving access to medical visits*
No 60,536 (79.6) 64.9 (64.2 – 65.6) 61,385 (77.4) 71.2 (70.6 – 71.9)
Yes 15,490 (20.4) 78.9 (78.1 – 79.8) 17,971 (22.7) 81.0 (80.3 – 81.8)
*p < 0.001 (χ2 test for each year).
Figure 1. Proportion of people who visited a doctor in theplast year, with amplitude of variation between the richest 10% and poorest 10% in the Northeastern and Southeastern regions of Brazil in 2003 and 2008.
Note: values beside the horizontal bars represent the diference between D1 and D10. *p < 0.001; **p = 0.001 (χ2 test).
Source: Brazilian Institute of Geography and Statistics, 2003 and 20089,13.
50% 60% 70% 80% 90%
2008 2003
2008 2003
2008 2003
Br
azil
Northeast
Southeast
Poorest (D1)
Richest (D10) 17.6*
21.3*
20.9*
27.3*
12.6**
16.8*
Table 3. Proportion of people who visited a doctor in the past year, according to the 1st and 10th
deciles of per capita family income and related variables, in Northeastern Brazil, in 2003 and 2008.
Variable
2003 2008
Prevalence Ratio Prevalence Ratio All D1 D10 D10/D1* All D1 D10 D10/D1*
Total sample 61.2 54.7 82.0 1.50 66.9 60.8 81.7 1.34 Gender
Male 47.6 38.9 72.9 1.87 54.2 45.3 73.0 1.61
Female 73.5 68.0 90.3 1.33 78.3 74.1 89.7 1.21
Age (years)
20 – 29 54.7 53.6 73.3 1.37 61.0 59.9 77.6 1.30
30 – 39 58.8 53.4 80.3 1.50 64.7 60.9 78.0 1.28
40 – 49 62.3 55.3 83.7 1.51 66.9 59.8 82.1 1.37
50 – 59 66.3 58.2 88.0 1.51 71.2 63.6 81.8 1.29
≥ 60 72.2 63.2 86.5 1.37 76.7 65.7 89.2 1.36
Self-reported morbidity
No diseases 50.9 46.0 76.9 1.67 57.5 53.1 75.1 1.41
1 disease 72.7 70.7 84.9 1.20 76.9 72.8 88.3 1.21
≥ 2 diseases 84.9 80.2 92.2 1.15 88.3 84.9 93.1 1.10
Health self-perception
Positive 53.5 46.1 80.5 1.75 60.3 53.9 79.6 1.48
Negative 75.4 71.2 88.2 1.24 78.9 74.4 90.6 1.22
Health insurance plan giving access to medical visits*
No 59.2 54.6 75.9 1.39 65.2 60.7 76.0 1.25
Yes 83.4 75.7 88.3 1.17 84.2 77.7 87.8 1.13
*p < 0.001 (χ2 test for each year).
among whom the prevalence reduced 1.8 pp from 2003 to 2008. For those without chronic conditions and the ones with one chronic disease, the ratio D10/D1 reduced (8.2 and 6.6%, respectively) in the analyzed period. When the ratio (D10/D1) is considered, it is possible to observe the reduced inequality from 2003 to 2008, both for those with positive (about 8.6%) and negative health self-perception (about 5%). Regardless of the income category and of having a health insurance plan, there was an increasing prevalence of medical visits from 2003 to 2008. The inequality between D10 and D1 reduced with regard to the presence of a health insurance plan (1.22 in 2003 to 1.15 in 2008) (Table 4).
Table 4. Proportion of people who visited a doctor in the past year, according to the 1st and 10th
deciles of per capita family income and related variables, in Southeastern Brazil, in 2003 and 2008.
Variable
2003 2008
Prevalence Ratio Prevalence Ratio All D1 D10 D10/D1* All D1 D10 D10/D1*
Total Sample 67.9 61.5 78.3 1.27 73.5 68.6 81.2 1.18
Gender
Male 56.2 49.4 68.5 1.39 62.3 56.7 71.0 1.25
Female 78.2 70.1 87.0 1.24 83.4 76.4 90.5 1.19
Age (years)
20 – 29 58.7 58.7 70.9 1.21 65.1 65.6 72.5 1.10
30 – 39 64.7 60.5 75.4 1.25 70.7 66.8 79.4 1.19
40 – 49 69.0 61.3 80.0 1.31 74.0 70.8 81.2 1.15
50 – 59 73.5 69.0 78.9 1.14 77.5 71.6 82.3 1.15
≥ 60 81.2 79.3 86.4 1.09 84.3 79.6 89.0 1.12
Self-reported morbidity
No diseases 56.8 52.3 70.2 1.34 63.6 60.0 73.6 1.23
1 disease 76.6 69.9 85.0 1.21 81.7 78.0 87.8 1.13
≥ 2 diseases 90.0 86.1 93.6 1.09 91.3 84.3 94.1 1.12
Health self-perception
Positive 62.2 54.7 75.9 1.39 68.8 62.2 79.2 1.27
Negative 85.0 77.1 93.5 1.21 87.3 80.8 92.8 1.15
Health insurance plan giving access to medical visits*
No 64.9 61.1 74.7 1.22 71.2 67.9 78.0 1.15
Yes 78.9 81.1 81.7 1.01 81.0 87.4 84.1 0.96
*p < 0.001 (χ2 test for each year).
DISCUSSION
The ratio between the richest and the poorest, when analyzing medical visits, was higher in the Northeastern region. This difference decreased from 2003 to 2008, which suggests a reduction in socioeconomic inequalities; however, the value was much higher than the national average. The Southeastern region, on the other hand, had lower amplitude in comparison to the national average, and much lower to that found in the Northeastern region in both years, thus reflecting lower levels of inequalities. It was possible to observe reduced inequality between the richest and the poorest in both regions, especially because the prevalence was maintained among the richest and due to the increasing prevalence among the poorest in the analyzed periods. In a study based on PNAD 2003, it was observed that the Northeastern region had one of the largest proportions of people assisted by SUS in the two weeks prior to the study — much higher than the national average — and the lowest proportions of health services outside of SUS, among the other macro-regions. In the Southeastern region, this relationship was more balanced, even if the health services provided by SUS have been more frequent. The same
study also showed that, among the users of SUS, the per capita family income did
not influence the prevalence rates, while for those who were not users of SUS,
having higher income meant the higher prevalence of service use4. Capilheira and
Santos11 showed that those who belonged to classes A and B visited a doctor 13%
more often than the ones belonging to classes D and E. Another study demonstrated that the prevalence of health service use was of 26.7% among the richest, against 15.1% among the poorest. After the stratification as being a SUS user or not, it was possible to observe higher prevalence among the poorest for SUS users, and a higher prevalence among the richest for non-users4. Goldbaum et al.3 found similar results in their study.
Both in the Northeastern and in the Southeastern region, it was possible to observe a higher prevalence of medical visits among women, older people, richer people, those with more chronic conditions, with negative health self-perception and with a health insurance plan that gives access to medical visits, thus corroborating the findings of other studies3,4,14-19. Still, the inequality among men and poorer women decreased when compared to richer people in both assessed macro-regions. A study
by Giatti and Barreto19 showed increasing prevalence of medical visits among men
from 1998 to 2008, and this increase was higher among unemployed people (23.2%) when compared to workers without social security (17.9%).
increasing prevalence. This situation causes problems, once individuals with more chronic conditions and lower income are those who mostly depend on public health services5,8,15.
In both analyzed regions, there was an increasing prevalence of medical visits among the poorest, for those with a positive and a negative health perception,
from 2003 to 2008. Bastos et al.6 assessed the prevalence of medical visits in the
public health service and observed that, among men who had a negative health perception, the prevalence of medical visits was 13% higher in comparison to those with excellent or very good health self-perception. Among women, this value was of 26%. Another study showed that those who considered their health as being poor/ regular visited doctors 2.96 times more often than the ones with excellent health14.
Capilheira and Santos11 showed 33% more prevalence of medical visits among the
ones who considered their health as being regular or poor, in comparison to those who considered their health to be excellent or very good. With the amplification of the Family Health Program (PSF), health services began to improve considerably in terms of access and use in different groups, also showing superior treatment in mostly excluded strata20.
This study verified that individuals without health insurance with access to medical appointments presented increasing prevalence of medical visits in both regions in the analyzed period, even though they attend the doctor’s office less often than those with health insurance plans. With regard to health plans, the National
Agency of Supplementary Health21 states that 13.57% of the Northeastern region
was insured in 2012, increasing 24.72% from 2010 to 2012. As to the Southeastern region, in 2012, 41.39% of its population was insured, increasing 4.97% from 2010 to 2012. A study showed that 36.9% of those with private health insurance and no chronic diseases visited a doctor in the past 12 months, while the prevalence for the ones with private health insurance plan and chronic diseases was of 11.4%6. Another study identified 3.3 times more chances of visiting a doctor in the past 12 months among users of SUS, ad 6 times more chances among people with health insurance
plans, both compared to those who financed their own appointments19.
CONCLUSION
The prevalence of medical visits increased and the inequality between the richest and the poorest decreased in both macro-regions analyzed from 2003 to 2008. Even though the Northeastern region still presents important differences concerning medical visits among the richest and the poorest, the decreasing inequality was more present in this region when compared to the Southeast.
The action of measuring socioeconomic inequality levels in terms of medical visits has been very used in national analyses6-8,10,11. One of the hypotheses for the expressive reduction in the levels of inequality in terms of health in Brazil, in the past few years, is the PSF adopted by the Federal Government. Created in 1994, PSF has the objective of reorganizing basic health care in the country22, but in 2003, with the Program of Expansion and Consolidation of the Family Health Strategy (PROESF),
the access to health services was widely spread throughout the Brazilian cities20.
The approximate coverage was, in 2000, of 20.6% of the Northeastern population, increasing to 55% in 2004. In 2004, the Southeast presented 30% of coverage23. Another hypothesis that cannot be ruled out is the possibility of the increasing search for preventive medical visits, which, in the long term, could lead to a reduced prevalence of chronic degenerative conditions.
Even though the health-related inequalities are decreasing, they are still unacceptable, surrounded by relationships in which inequity is strongly present. According to the National Commission on Social Determinants of Health, inequities should be remedied by specific public policies that promote education, income
redistribution and increasing social security24. These policies should increase the
average of health service use in regions whose rates are below the national mean, thus ensuring an equal distribution, and also prioritizing the social distribution
in regions with good access to services9. Recent studies have been showing that
the increasing number of initiatives such as the Family Health Strategy seem to
favor the access and the consequent use of health services of the population4,6.
1. Noronha JC, Lima LD, Machado CV. O sistema único de saúde, SUS. In: Giovanella L, Escorel S, Lobato LVC, Noronha JC, Carvalho AI. Políticas e sistema de saúde no Brasil. Rio de Janeiro: Fiocruz; 2008. p. 435-72.
2. Sawyer DO, Leite IC, Alexandrino R. Perfis de utilização de serviços de saúde no Brasil. Ciênc Saúde Coletiva 2002; 7(4): 757-76.
3. Goldbaum M, Gianini RJ, Novaes HMD, César CLG. Utilização de serviços de saúde em áreas cobertas pelo programa saúde da família (Qualis) no Município de São Paulo. Rev Saúde Pública 2005; 39(1):90-9.
4. Ribeiro MCSA, Barata RB, Almeida MF, Silva ZP. Perfil sociodemográfico e padrão de utilização de serviços de saúde para usuários e não-usuários do SUS – PNAD 2003. Ciênc Saúde Coletiva 2006; 11(4): 1011-22.
5. Barros MBA, Francisco PMSB, Zanchetta LM, César CLG. Tendências das desigualdades sociais e demográficas na prevalência de doenças crônicas no Brasil, PNAD: 2003-2008. Ciênc Saúde Coletiva 2011; 16(9): 3755-68.
6. Bastos GA, Duca GF, Hallal PC, Santos IS. Utilization of medical services in the public health system in the Southern Brazil. Rev Saúde Pública 2011; 45(3): 475-84.
7. Travassos C, Viacava F, Fernandes C, Almeida CM. Desigualdades geográficas e sociais na utilização de serviços de saúde no Brasil. Ciênc Saúde Coletiva 2000; 5(1): 133-49.
8. Viacava F. Acesso e uso de serviços de saúde pelos brasileiros. Radis 2010; 96: 12-9.
9. Instituto Brasileiro de Geografia e Estatística. Pesquisa Nacional por Amostra de Domicílios (PNAD 2008). Um panorama da saúde no Brasil: acesso e utilização dos serviços, condições de saúde e fatores de risco e proteção à saúde. Rio de Janeiro: IBGE; 2010.
10. Travassos C, Oliveira EXG, Viacava F. Desigualdades geográficas e sociais no acesso aos serviços de saúde no Brasil: 1998 e 2003. Ciênc Saúde Coletiva 2006; 11(4): 975-86.
11. Capilheira MF, Santos IS. Fatores individuais associados à utilização de consultas médicas por adultos. Rev Saúde Pública 2006; 40(3): 436-43.
12. Viacava F. Informações em saúde: a importância dos inquéritos populacionais. Ciênc Saúde Coletiva 2002; 7(4): 607-21.
13. Instituto Brasileiro de Geografia e Estatística. Pesquisa Nacional por Amostra de domicílios (PNAD 2003). Um panorama da Saúde no Brasil: acesso e utilização dos serviços, condições de saúde e fatores de risco e proteção à saúde. Rio de Janeiro: IBGE; 2005.
14. Mendoza-Sassi R, Béria JU, Barros ADJ. Outpatient health service utilization and associated factors: a population-based study. Rev Saúde Pública 2003; 37(3): 372-8.
15. Dias-da-Costa JS, Reis MC, Silveira Filho CV, Linhares RS, Piccinni F. Prevalence of medical visits and associated factors, Pelotas, Southern Br azil, 1999-2000. Rev Saúde Pública 2008; 42(6): 1074-84.
16. Fernandes LCL, Bertoldi AD, Barros AJD. Utilização dos serviços de saúde pela população coberta pela Estratégia de Saúde da Família. Rev Saúde Pública 2009; 43(4): 595-603.
17. Boing AF, Mato IB, Arruda MP, Oliveira MC, Njaine K. Prevalência de consultas médicas e fatores associados: um estudo de base populacional no Sul do Brasil. Rev Assoc Med Bras 2010; 56(1): 41-6.
18. Giatti L, Barreto SM. Situação no mercado de trabalho e utilização de serviços de saúde no Brasil. Ciênc Saúde Coletiva 2011; 16(9): 3817-27.
19. Moreira JPL, Moraes JR, Luiz RR. Use of medical consultations and the occurrence of systemic arterial hypertension in urban and rural areas of Brazil, according to PNAD data 2008. Ciênc Saúde Coletiva 2011; 16(9): 3781-93.
20. Elias PE, Ferreira CW, Alves MCG, Cohn A, Kishima V, Escrivão Junior A, et al. Atenção Básica em Saúde: comparação entre PSF e UBS por estrato de exclusão social no município de São Paulo. Ciênc Saúde Coletiva 2006; 11(3): 633-641.
21. Agência Nacional de Saúde Suplementar. Ministério da Saúde. Atlas econômico-financeiro da saúde suplementar 2012. Ano 8, Rio de Janeiro: ANS; 2013. Disponível em http://www.ans.gov.br/ images/stories/Materiais_para_pesquisa/Perfil_ setor/Atlas/2012_atlas.pdf. (Acessado em 09 de novembro de 2013).
22. Bousquat A, Gomes A, Alves MCGP. Acesso realizado ao Programa Saúde da Família em área com “alta” cobertura do subsistem privado. Ciênc Saúde Coletiva 2012; 17(11): 2913-21.
23. Brasil. Ministério da Saúde. Secretaria de Vigilância em Saúde. Saúde Brasil 2008: 20 anos de Sistema Único de Saúde (SUS) no Brasil. Brasília: Ministério da Saúde; 2009. Disponível em http://portal.saude.gov.br/ portal/arquivos/pdf/saude_brasil_2008_web_20_11. pdf. (Acessado em 09 de novembro de 2013).
24. Comissão Nacional sobre Determinantes Sociais da Saúde. As causas das iniquidades em saúde no Brasil. Rio de Janeiro: CNDSS; 2008. (Relatório inal). Disponível em http://bvsms.saude.gov.br/bvs/publicacoes/ causas_sociais_iniquidades.pdf. (Acessado em 09 de novembro de 2013).
Received on: 03/24/2014