ABSTRACT:Objectives: To assess the prevalence and factors associated with diabetes in the elderly population and verify the correlation between the use of medications for diabetes and information about the disease.
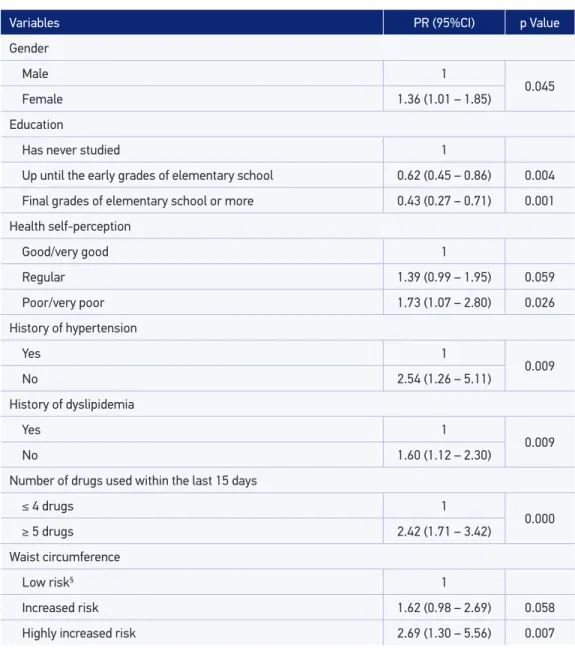
Methods: This epidemiological cross-sectional study was conducted in Viçosa, Minas Gerais, Brazil, with 621 elderly people aged 60 years or older selected by simple random sampling. A semi-structured questionnaire was used as a research tool and included questions about socioeconomic conditions, lifestyle, health conditions, and nutritional status. The weight, height, and waist circumference were measured. The dependent variable was the self-reported diabetes. In the association analysis between explanatory variables and self-reported diabetes, the Poisson regression analysis with robust variance was used. In the bivariate analysis, a p value < 0.25 was used to include the variables for the multivariate modeling, and in the inal model, the variables with p value < 0.10 association were included. Results: The prevalence of diabetes was 22.4%. The multivariate hierarchical analysis showed the following factors independently and positively associated with diabetes: gender, self-reported health, history of hypertension/dyslipidemia, polypharmacy, and waist circumference. The elderly schooling was negatively associated with diabetes. Conclusion: The results showed the need for implementation of educational public policies to promote behavior changes of the population to prevent and control diabetes and its complications.
Keywords: Aged. Diabetes mellitus. Chronic disease. Prevalence. Health of the elderly. Demographic aging.
Prevalence and associated factors of diabetes
in the elderly population in Viçosa,
Minas Gerais, Brazil
Prevalência e fatores associados ao diabetes em idosos no município de
Viçosa, Minas Gerais
Nayla Cordeiro VitoiI, Aline Siqueira FogalI, Clarissa de Matos NascimentoI, Sylvia do Carmo Castro FranceschiniI, Andréia Queiroz RibeiroI
IUniversidade Federal de Viçosa – Viçosa (MG), Brazil.
Corresponding author: Aline Siqueira Fogal. Universidade Federal de Viçosa. Departamento de Nutrição e Saúde. Avenida Peter Henry Rolfs, sem número, CCB II, Centro, CEP: 36570-900, Viçosa, MG, Brasil. E-mail: [email protected]
Conlict of interests: nothing to declare – Financial support: Conselho Nacional de Desenvolvimento Cientíico e Tecnológico
(CNPq), process 579255/2008-5 e 474689-2008-5; and Coordenação de Aperfeiçoamento de Pessoal de Nível Superior (CAPES), process 23038.039412/2008-73.
INTRODUCTION
The knowledge of the health–disease process and its determinants in the elderly popula-tion has taken on an increasing importance in the context of health research in Brazil. This fact is associated to the populational aging phenomena, which outlines a series of challen-ges in order to ensure appropriate life conditions to this growing age group1.
The changes in the Brazilian demographic proile are accompanied by changes in the epidemio-logical proile. Currently, there is a predominance of chronic noncommunicable diseases (NCDs), especially in older age groups, among which the diabetes stands out, representing an important public health problem with high morbidity, mortality, and signiicant economic repercussions2,3.
The diabetes mellitus (DM) is characterized as a worldwide epidemic. Currently, the World Health Organization (WHO) estimates that 346 million people reveal diabetes; in 2030, it is estimated that deaths owing to this condition will double in relation to 20054. The current estimate of the total DM carriers, aged between 20 and 79 years, in Brazil, is 11.9 million, corresponding to approximately 6% of the Brazilian population5. In the elderly Brazilian population, the prevalence of DM is 16.1%6.
Diferent risk factors for DM have been pointed out in the literature, such as family history, ethnicity, and the increasing age. Other factors are related to the growing urbanization and the adoption of unhealthy lifestyles, such as a sedentary lifestyle, inappropriate diet, and obesity; these are found to be the major causes for the incidence and prevalence of DM worldwide7-9.
Although knowingly increasing worldwide, little is known on the prevalence of this condition in cities other than the Brazilian capital cities. The social, economic, and cultural
RESUMO:Objetivo: Avaliar a prevalência e os fatores associados ao diabetes em idosos, bem como veriicar a concordância entre o uso de medicamentos para diabetes e a informação referida sobre a doença. Métodos: Estudo epidemiológico transversal realizado na cidade de Viçosa, Minas Gerais, com 621 idosos com 60 anos ou mais, selecionados a partir de amostragem aleatória simples. Utilizou-se como instrumento de pesquisa um questionário semiestruturado que constava de perguntas sobre condições sociodemográicas, estilo de vida, condições de saúde e estado nutricional. Foram aferidos peso e altura, além do perímetro da cintura. A variável dependente do estudo foi o diabetes autorreferido. A análise da associação entre as diversas variáveis explicativas e a presença de diabetes foi feita por meio da regressão de Poisson com variância robusta simples e múltipla. Nas análises bivariadas foi utilizado o valor p < 0,25 para inclusão das variáveis na análise de regressão múltipla hierarquizada e, no modelo inal, permaneceram as associações cujas variáveis apresentaram associação com o desfecho com valor p < 0,05. Resultados: A prevalência de diabetes foi de 22,4%. A análise múltipla hierarquizada evidenciou como fatores independentemente e positivamente associados ao diabetes: gênero, autopercepção da saúde, história de hipertensão e/ou dislipidemias, polifarmácia e obesidade abdominal. A escolaridade se manteve negativamente associada à presença de diabetes. Conclusão: Os resultados obtidos são similares aos de outros estudos conduzidos no país, sugerindo que os fatores associados ao diabetes entre idosos são semelhantes em todo o país. Ainda, observou-se moderada concordância entre o uso de medicamentos para diabetes e a informação referida sobre a doença, o que sugere o uso da última como método alternativo de investigação quando não se dispuser de outra forma de avaliação.
diferences are clear among the various Brazilian populations, and the efectiveness of DM prevention programs and campaigns are inluenced by these diferent realities10,11.
One of the reasons for the lack of knowledge on this prevalence is the diiculty for deter-mining it through measuring the blood glucose level and the use of hypoglycemic, which generate costs and operational diiculties12. Another alternative is the use of self-reported information that is obtained quickly and at a low cost, enabling their adoption in popula-tional studies. However, owing to some biases — lack of knowledge on the information of interest by the respondent, memory bias, and the desire not to inform the prevalence of the disease or the fact that it is still not diagnosed — there is the need of assessing the relia-bility of the self-reported diabetes13,14.
Given the above-mentioned scenario, the objective of this study was to assess the preva-lence of the factors associated with self-reported diabetes in elderly population and verify the correlation between DM medication and the information about the disease.
METHODS
DESIGN AND SUBJECTS
This cross-sectional epidemiological study (household survey) was carried out in the municipality of Viçosa, Minas Gerais, during the year 2009.
Six hundred and twenty-one elderly people aged 60 years or older, from both urban and rural areas, were selected and studied from a simple random sampling in a reference popu-lation of 7,980 elderly persons.
The elderly people were registered during the National Elderly Vaccination Campaign, in the period from April to May 2008. Later on, the database from the servers of the Federal University of Viçosa, both the active and retired ones, the records of the elderly persons in the Family Health Program (Programa de Saúde da Família — PSF), the municipal physiothe-rapy service, the women’s health center, the psychosocial service, care unit, and HiperDia and Polyclinic were obtained and confronted with each other. This combination of databa-ses aimed to identify the elderly population who did not take part in the vaccination cam-paign of 2008 in order to complement the records in the base. After the merger of the data-bases, the records of the people who were aged 60 years or older totaled to 7,980, which served as a basis for obtaining the sample. The institutionalized elderly people did not take part in this study.
DATA COLLECTION
For the collection of the data, a semi-structured questionnaire was used, tested in pilot phase. The interviews were held in households and, preferably, prescheduled. Pairs of inter-viewers, previously trained, would locate the households and visit the elderly people in order to explain the objectives of the research. They would then be invited to take part in it, and a date and time would be scheduled for those who accepted it.
Data collection was carried out by ive pairs of interviewers. They were properly trai-ned, previously to the data collection. This step consisted of four days of training, where the pairs administered the questionnaires and underwent the anthropometric measures among themselves with an observed monitoring and evaluating their performance.
The information was obtained using a semi-structured questionnaire with mostly closed and precoded questions. The questionnaire was applied directly to the elderly people, but in case they expressed any diiculties, the next closest respondent (relative or caretaker) would assist them. About 25.7% of the elderly people was assisted in some section of the questionnaire owing to cognitive or communication deicit, with most of this assistance being provided by family members (95%).
VARIABLES OF THE STUDY
The dependent variable of this study was the DM, obtained by the following question: “Has a doctor or another health professional ever said you have diabetes?” The independent variables analyzed were: sociodemographic characteristics (gender, age range, and educa-tion); lifestyle characteristics (smoking habits and practice of physical activities); health con-ditions (self-perceived health, number of doctor appointments in the last year; history of hypertension, dyslipidemia and/or kidney disease, and use of medications within the last 15 days); and nutritional status (excessive weight and abdominal obesity).
The investigation on the practice of physical activities was self-reported (yes or no) and restricted to that performed regularly, for at least 20 minutes, 3 times a weeks, disregarding other dimensions of activities held within the household, work environment, and in going and coming wherever.
Body mass index (BMI was used in order to characterize the elderly people as for their nutritio-nal status and classiied according to the cutof points for elderly people proposed by Lipschitz15: low weight < 22 kg/m²; eutrophic between 22 and 27 kg/m²; and overweight > 27 kg/m².
The waist circumference was used in order to detect abdominal obesity, being considered a predic-tor of cardiovascular risk16. The cutof points used were established by Lean et al.17 and recommended by the WHO18, according to the risk for diseases associated with obesity: increased risk for women ≥ 80 cm and for men ≥ 94 cm; and highly increased risk for women ≥ 88 cm and for men ≥102 cm.
and the origin of the prescription/indication. Most medication revealed their uses proven by bullae, packaging and/or prescriptions presented by the participants.
All the medications used and reported were transcribed into their generic names. Later on, a classiication of the antidiabetic drugs was carried out, based on the Anatomical Therapeutic Chemical (ATC) classiication19.
DATA ANALYSIS
Initially, a descriptive analysis of the data was performed. The prevalence of DM in the sample and its respective 95% conidence interval (95%CI) was also estimated. The analysis of the association between the various independent variables and the DM was veriied by the Pearson χ2-test and the linear trend χ2 with a signiicance level of 5%; the simple Poisson regression with robust variance was used in order to estimate the reasons of gross prevalence.
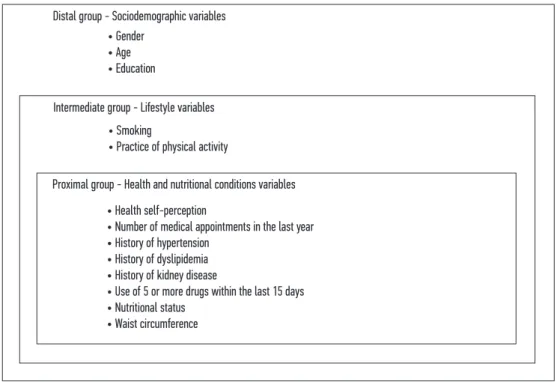
In the multiple regression model, there were included the variables presenting p-value < 0.25; thus enabling a higher number of variables in the model. The explanatory variables were included using the hierarchical approach on three levels: sociodemographic variables in the distal level; lifestyle variables in the intermediate level; and health conditions and nutritional status variables at the proximal level (Figure 1).
Figure 1. Hierarchical model for determination of diabetes.
Intermediate group - Lifestyle variables
Proximal group - Health and nutritional conditions variables Distal group - Sociodemographic variables
• Smoking
• Practice of physical activity
• Health self-perception
• Number of medical appointments in the last year • History of hypertension
• History of dyslipidemia • History of kidney disease
• Use of 5 or more drugs within the last 15 days • Nutritional status
• Waist circumference • Gender
According to the hierarchical proposal, once included in the model, the variables were kept until the end, regardless of the p-value in the following stages. In the final model, the associations whose variables presented association to the outcome p-value < 0.05 remained.
In order to assess the concordance between the “use of diabetes medication” and “self-repor-ted diabetes” variables, the Kappa coeicient was used, with the following interpretation: values higher than 0.75 indicate excellent concordance; values lower than 0.40 indicate low con-cordance; and values between 0.40 and 0.75 represent moderate concordance20.
The statistical analyzes were performed using theStata 11 software.
ETHICAL PROCEDURES
The interview was conducted after signing the informed consent by the elderly person or their caretaker, and the protocol of the research was approved by the Ethics Committee on Human Research of the Federal University of Viçosa, process No. 027/2008.
RESULTS
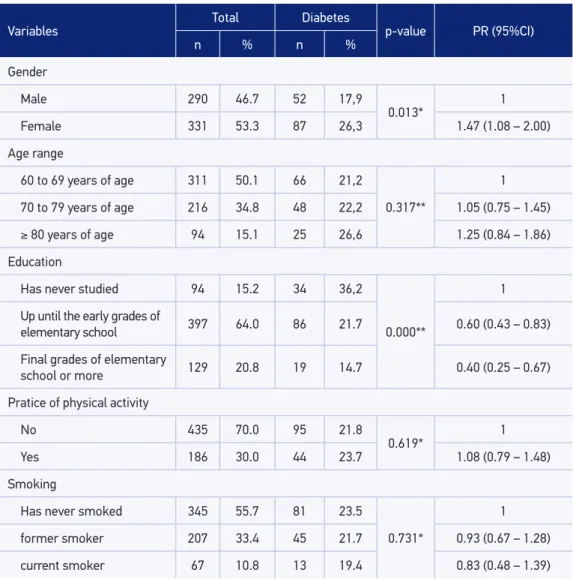
In total, 621 elderly people were studied, most of them (53.3%) being women. The age varied from 60 to 98 years, with median of 69 years, mean of 70.8 years, and a standard deviation (SD) of 8.06 years. About half the number of the elderly people was aged from 60 to 69 years (50.1%). Most of them reported having studied up until the early grades of elementary school (64.0%) (Table 1).
The prevalence of self-reported diabetes was 22.4% (95%CI 18.8 – 26.4). Among the sociodemographic variables, the gender and education level were statistically associated with the DM. A higher prevalence of morbidity among women and among those who had fewer study years was veriied. Most elderly people reported not practicing physical activity (70%) and never having smoked (55.7%), not having been observed a signiicant association between these variables and the self-referred diabetes (Table 1).
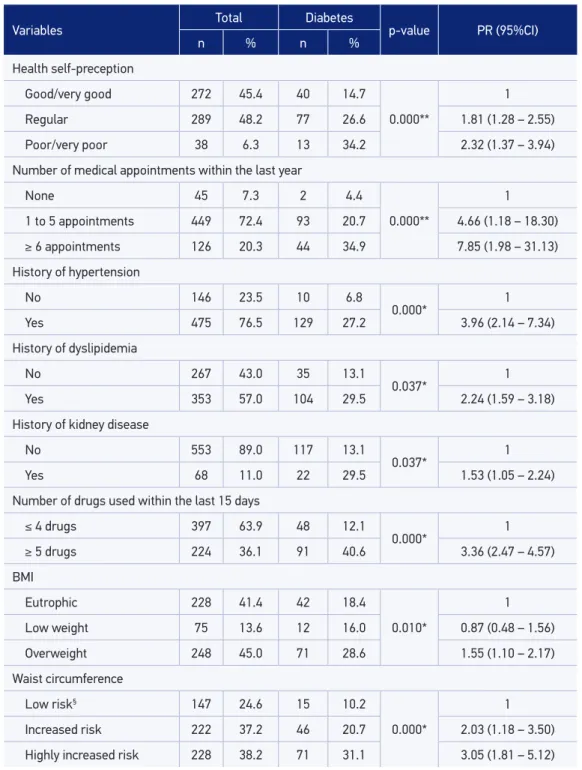
It was observed that a signiicant association prevailed between all the health conditions and nutritional status indicators selected and the presence of self-reported diabetes. The prevalence of a negative health self-assessment and the excessive weight was higher among diabetic people than among nondiabetic people (Table 2).
the elderly people with waist circumference of ≤ 94 cm and ≤ 80 cm for men and women, res-pectively (Table 2).
Among the 97 elderly people who used antidiabetic medication within 15 days previou-sly to the interview, 94 (96.9%) of them reported a history of DM. Among the 139 elderly persons, who reported a history of DM, 45 (32.4%) did not use lipid-lowering medication. The Kappa coeicient obtained was 0.75 (95%CI 0.68 – 0.82), indicating a moderate to high concordance between the two variables.
Table 1. The prevalence and the reasons for the prevalence of self-reported diabetes, according to the sociodemographic and lifestyle variables for the elderly people, Viçosa, MG, 2009.
PR: prevalence ratio; 95%CI: 95% of conidence interval; *Pearson c²-test; **linear trend c²-test.
Variables Total Diabetes p-value PR (95%CI)
n % n %
Gender
Male 290 46.7 52 17,9
0.013* 1
Female 331 53.3 87 26,3 1.47 (1.08 – 2.00)
Age range
60 to 69 years of age 311 50.1 66 21,2
0.317**
1
70 to 79 years of age 216 34.8 48 22,2 1.05 (0.75 – 1.45)
≥ 80 years of age 94 15.1 25 26,6 1.25 (0.84 – 1.86)
Education
Has never studied 94 15.2 34 36,2
0.000**
1
Up until the early grades of
elementary school 397 64.0 86 21.7 0.60 (0.43 – 0.83)
Final grades of elementary
school or more 129 20.8 19 14.7 0.40 (0.25 – 0.67)
Pratice of physical activity
No 435 70.0 95 21.8
0.619* 1
Yes 186 30.0 44 23.7 1.08 (0.79 – 1.48)
Smoking
Has never smoked 345 55.7 81 23.5
0.731*
1
former smoker 207 33.4 45 21.7 0.93 (0.67 – 1.28)
Table 2. The prevalence and the reasons for the prevalence of self-reported diabetes, according to the health condition and nutritional status variables for the elderly people, Viçosa, MG, 2009.
PR: prevalence ratio; 95%CI: 95% of conidence interval; BMI: body mass index; *Pearson χ²-test; **linear trend χ²-test; §corresponds to waist circumference values: < 94 cm for men and < 80 cm for women.
Variables Total Diabetes p-value PR (95%CI)
n % n %
Health self-preception
Good/very good 272 45.4 40 14.7
0.000**
1
Regular 289 48.2 77 26.6 1.81 (1.28 – 2.55)
Poor/very poor 38 6.3 13 34.2 2.32 (1.37 – 3.94)
Number of medical appointments within the last year
None 45 7.3 2 4.4
0.000**
1
1 to 5 appointments 449 72.4 93 20.7 4.66 (1.18 – 18.30)
≥ 6 appointments 126 20.3 44 34.9 7.85 (1.98 – 31.13)
History of hypertension
No 146 23.5 10 6.8
0.000* 1
Yes 475 76.5 129 27.2 3.96 (2.14 – 7.34)
History of dyslipidemia
No 267 43.0 35 13.1
0.037* 1
Yes 353 57.0 104 29.5 2.24 (1.59 – 3.18)
History of kidney disease
No 553 89.0 117 13.1
0.037* 1
Yes 68 11.0 22 29.5 1.53 (1.05 – 2.24)
Number of drugs used within the last 15 days
≤ 4 drugs 397 63.9 48 12.1
0.000* 1
≥ 5 drugs 224 36.1 91 40.6 3.36 (2.47 – 4.57)
BMI
Eutrophic 228 41.4 42 18.4
0.010*
1
Low weight 75 13.6 12 16.0 0.87 (0.48 – 1.56)
Overweight 248 45.0 71 28.6 1.55 (1.10 – 2.17)
Waist circumference
Low risk§ 147 24.6 15 10.2
0.000*
1
Increased risk 222 37.2 46 20.7 2.03 (1.18 – 3.50)
Table 3. Prevalence and reason of prevalence of the self-reported diabetes, according to the interest of the analysis and hierarchical multiple regression variables, Viçosa, MG, 2009.
PR: prevalence ratio; 95%CI: 95% of conidence interval; §corresponds to waist circumference values: < 94 cm for men and < 80 cm for women.
Variables PR (95%CI) p Value
Gender
Male 1
0.045
Female 1.36 (1.01 – 1.85)
Education
Has never studied 1
Up until the early grades of elementary school 0.62 (0.45 – 0.86) 0.004
Final grades of elementary school or more 0.43 (0.27 – 0.71) 0.001
Health self-perception
Good/very good 1
Regular 1.39 (0.99 – 1.95) 0.059
Poor/very poor 1.73 (1.07 – 2.80) 0.026
History of hypertension
Yes 1
0.009
No 2.54 (1.26 – 5.11)
History of dyslipidemia
Yes 1
0.009
No 1.60 (1.12 – 2.30)
Number of drugs used within the last 15 days
≤ 4 drugs 1
0.000
≥ 5 drugs 2.42 (1.71 – 3.42)
Waist circumference
Low risk§ 1
Increased risk 1.62 (0.98 – 2.69) 0.058
Highly increased risk 2.69 (1.30 – 5.56) 0.007
DISCUSSION
In this study, the prevalence of self-reported diabetes among the elderly population was estimated at 22.4%, higher than in other studies11,21-24. According to the data from the National Research per Household Sample (Pesquisa Nacional por Amostra de Domicílios – PNAD), the prevalence of DM in the elderly population in Brazil is 16.1%6.
In relation to the sociodemographic characteristics, there was a higher prevalence of DM among women, as observed by other studies in Brazil11,25. A possible explanation for these results would be the higher proportions of lack of knowledge on the presence of the disease among men and higher frequency of women in health services26. The hormonal changes associated with climaterium seem to be responsible for the higher prevalence of DM among women than among men, from the age of 50 years27.
In this study, higher education levels were inversely associated with the occurrence of DM and in other studies10,11,28. The low level of school education may limit the access to health information and hinder the understanding of the guidelines for prevention and/or treatment of DM, resulting in poor adequate control and risk of complications. This fact is especially relevant in Brazil, where illiteracy rates among elderly is still high: 30.7% of the Brazilian elderly exhibit less than one year of school education6.
As for the age range, there was a signiicant increase of DM prevalence with growing age. This result corroborates the one observed by other national studies11,21,22,29.
Most elderly people who were interviewed did not practice any physical activity. It was also observed a slight increase, although signiicant, in the prevalence of DM among indi-viduals who practiced physical activities, a fact that may have occurred owing to the guide-lines for health conditions improvement of these elderly people. Physical exercises result in signiicant improvement for type 2 DM carriers, such as reducing blood glucose after per-forming exercises, reduction of blood glucose in fasting, glycated hemoglobin, and impro-ved vascular function7,30.
The BMI was signiicantly associated to the DM, which replicates the indings of several studies reporting a statistically signiicant relation between obesity and incidence or preva-lence of DM among the elderly population22,27,30. Besides the increased prevalent of general overweight, it was observed a high prevalence of abdominal obesity prevailed among the diabetic elderly. Abdominal obesity is associated with important cardiovascular and meta-bolic alterations, such as dyslipidemia, glucose intolerance or DM, and hypertension,being considered more relevant in the diagnoses of individuals, with elevated risk to health than the general adiposity31.
as poor or very poor reveal a higher risk of mortality in comparison with those who report presenting excellent health32.
The higher frequency of medical consultations was associated with the presence of DM and points out to a higher use of consultations by patients with chronic conditions, once that its complexity could demand a higher number of medical appointments28,33. It is also consi-dered that the people with health problems and who negatively assess their health condition tend to visit doctors more often for treatment and follow-up34. In the study by Boing et al.35, the prevalence of medical appointments within the last year was 13% higher among people who self-reported DM and 11% higher among those who classiied their health negatively.
The reporting of hypertension and dyslipidemia by elderly people was high, and a higher signiicant prevalence of these diseases among diabetic patients was expected, considering the clinical researches that corroborate the relation between them22,25. According to the Brazilian Diabetes Society (Sociedade Brasileira de Diabetes)7, hypertension and the changes in lipids and plasma lipoproteins (typically elevated triglycerides and HDL cholesterol reduc-tion) are conigured as risk factors for the development of cardiovascular diseases, which contributed to up to 80% of deaths among diabetic people.
In Brazil, the use of a great number of medication drugs is widely observed among indi-viduals who are aged 60 years or older36,37. They are a subject of simultaneous impairment of diferent organs or systems and, therefore, candidate to multipurpose drugs. In this study, it was observed that a higher prevalence occurred in the consumption of ive or more medi-cation drugs among the diabetic people. Here, it is important to relect about the condi-tions under which polypharmacy occurs, considering that several studies have related this phenomenon to the inappropriate use of medication among elderly people38,39, which can be an aggravating factor to the adequate DM control in this population.
Some limitations in the study may be pointed out. The irst of them is the cross-sectional design, which does not allow establishing a causal relation between the explanatory variables and the outcome. Another limitation may be the fact that it was used the variable “diabe-tes” through self-report measuring. However, the use of self-reported information is recom-mended by the WHO13, and studies have proven that the information obtained under the presence of chronic diseases have good concordance when compared with medical records or clinical examinations40-42. Moreover, in this study, it was observed a moderate to excellent concordance veriied through the Kappa test between the use of antidiabetic drugs and the DM report. Although this concordance is not enough in order to validate the use of the dependent variable “self-reported diabetes” as the diagnose method of DM in the sample.
CONCLUSION
In addition to that, the increased concordance observed between the use of DM medi-cation and the reported information on the disease suggests the use of self-reported dia-betes as an alternative investigation method when there is no other form of assessment.
Given the results observed, eforts must be made in order to implement and improve the policies and practices for the prevention and control of DM. In this sense, the actions must emphasize the therapeutical adherence, the promotion of healthy eating habits, and the encouraging of physical activity among elderly people.
Despite the high concordance between the self-reported diabetes and the use of hypo-glycemic agents, further studies are necessary in order to evaluate the DM from more relia-ble measures, such as laboratory tests, and which, furthermore, assess other factors that may contribute for the development of DM in the elderly population.
1. Lima-Costa MF, Matos DL, Camargos VP, Macinko J. Tendências em dez anos das condições de saúde de idosos brasileiros: evidências da Pesquisa Nacional por Amostra de Domicílios (1998, 2003, 2008). Ciênc Saúde Coletiva 2011; 16(9): 3689-96.
2. Brasil. Ministério da Saúde. Secretaria de Atenção à Saúde. Departamento de Atenção Básica. Envelhecimento e saúde da pessoa idosa. Cadernos de Atenção Básica nº 19. Série A. Normas e manuais técnicos. Brasília: Ministério da Saúde; 2006. 3. Vasconcelos AMN, Gomes MMF. Transição
demográfica: a experiência brasileira. Epidemiol Serv Saúde 2012; 21(4): 539-48.
4. World Health Organization (WHO). Diabetes. Fact sheet nº 312. 2011. [Internet]. Disponível em: http:// www.who.int/mediacentre/factsheets/fs312/en/ index.html (Acessado em 20 de janeiro de 2014). 5. International Diabetes Federation. IDF Diabetes Atlas.
6th ed. 2013.
6. Instituto Brasileiro de Geograia e Estatística (IBGE). Pesquisa Nacional por Amostra de Domicílios (2010). Síntese de Indicadores 2009. Disponível em: http:// biblioteca.ibge.gov.br/visualizacao/livros/liv42820. pdf (Acessado em: 16 agosto de 2015).
7. Sociedade Brasileira de Diabetes. Diretrizes da Sociedade Brasileira de Diabetes. 3 ed. Itapevi; 2009. 8. Naranjo AA, Rodríguez ÁY, Llera RE, Aroche R.
Diabetes risk in a Cuban primary care setting in persons with no known glucose abnormalities. MEDICC Rev 2013; 15(2): 16-9.
9. Marinho NBP, Vasconcelos HCA, Alencar AMPG, Almeida PC, Damasceno MMC. Risco para diabetes mellitus tipo 2 e fatores associados. Acta Paul Enferm 2013; 26(6): 569-74.
10. Lyra R, Silva RS, Montenegro Jr RM, Matos MVC, Cézar NJB, Maurício-da-Silva L. Prevalência de diabetes melito e fatores associados em população urbana adulta de baixa escolaridade e renda do sertão nordestino brasileiro. Arq Bras Endocrinol Metab 2010; 54(6): 560-6.
11. Viegas-Pereira APF, Rodrigues RN, Machado CJ. Fatores associados à prevalência de diabetes auto-referido entre idosos de Minas Gerais. Rev Bras Estud Popul 2008; 25(2): 365-76.
12. Genuth S, Alberti KG, Bennett P, Buse J, Defronzo R, Kahn R, Kitzmiller J, et al. Follow-up report on the diagnosis ofdiabetes mellitus. Diabetes Care 2003; 26(11): 3160-7.
13. De Bruin A, Picavet HS, Nossikov A. Health interview surveys: towards international harmonization of methods and instruments. WHO Reg Publ Eur Ser 1996; 58(1-13): 1-161.
14. Goldman N, Lin IF, Weinstein M, Lin YH. Evaluating the quality of self-reports of hypertension and diabetes. J Clin Epidemiol 2003; 56(2): 148-54.
15. Lipschitz DA. Screening for nutritional status in the elderly. Prim Care 1994; 21(1) :55-67.
16. World Health Organization (WHO). Waist circumference and waist-hip ratio: report of a WHO expert consultation. Geneva: WHO; 2011.
17. Lean ME, Han TS, Morrison CE. Waist circumference as a measure for indicating need for weight management. BMJ 1995; 311(6998): 158-61.
18. World Health Organization (WHO). Obesity: preventing and managing the global epidemic. Report of a WHO consultation (WHO Ttechnical Report Series). Geneva: WHO; 1998.
19. World Health Organization (WHO). The Anatomical Therapeutic Chemical Classiication System with Defined Daily Doses (ATC/DDD). [Internet]. Disponível em: http://www.who.int/classiications/ atcddd/en/ (Acessado em: 20 de fevereiro de 2014). 20. Landis JR, Koch GG. The measurement of observer
agreement for categorical data. Biometrics 1977; 33(1): 159-74.
21. Ali MK, McKeever Bullard K, Imperatore G, Barker L, Gregg EW. Characteristics associated with poor glycemic control among adults with self-reported diagnosed diabetes: National Health and Nutrition Examination Survey, United States, 2007-2010. MMWR Morb Mortal Wkly Rep 2012; 61(Suppl): 32-7. 22. Francisco PMSB, Belon AP, Barros MBA, Carandina L,
Alves MCGP, Goldbaum M, et al. Diabetes auto-referido em idosos: prevalência, fatores associados e práticas de controle. Cad Saúde Pública 2010; 26(1): 175-84. 23. Oba S, Nagata C, Nakamura K, Takatsuka N, Shimizu
H. Self-reported diabetes mellitus and risk of mortality from all causes, cardiovascular disease, and cancer in Takayama: a population-based prospective cohort study in Japan. J Epidemiol 2008; 18(5): 197-203. 24. Pelegrini A, Coqueiro RS, Petroski EL, Benedetti TRB.
Diabetes mellitus auto-referido e sua associação com excesso de peso em idosos. Rev Bras Cineantropom Desempenho Hum (Online) 2011; 13(6): 442-7. 25. Silva RCP, Simões MJS, Leite AA. fatores de risco para
doenças cardiovasculares em idosos com diabetes mellitus tipo 2. Rev Ciênc Farm Básica Apl 2007; 28(1): 113-21. 26. Gomes R, Moreira MCN, Nascimento EF, Rebello LEFS,
Couto MT, Schraiber LB. Os homens não vêm! Ausência e/ou invisibilidade masculina na atenção primária. Ciênc Saúde Coletiva 2011; 16(Suppl 1): 983-92.
27. Kim C. Does menopause increase diabetes risk? Strategies for diabetes prevention in midlife women. Womens Health (Lond Engl) 2012; 8(2): 155-67. 28. Passos VM, Barreto SM, Diniz LM, Lima-Costa MF.
Type 2 diabetes: prevalence and associated factors in a Brazilian community: the Bambuí health and aging study. Sao Paulo Med J 2005; 123(2): 66-71. 29. Gündogan K, Bayram F, Capak M, Tanriverdi F, Karaman
A, Ozturk A, et al. Prevalence of metabolic syndrome in the Mediterranean region of Turkey: evaluation of hypertension, diabetes mellitus, obesity, and dyslipidemia. Metab Syndr Relat Disord. 2009; 7(5): 427-34.
30. Ockene IS, Tellez TL, Rosal MC, Reed GW, Mordes J, Merriam PA, et al. Outcomes of a Latino community-based intervention for the prevention of diabetes: the Lawrence Latino Diabetes Prevention Project. Am J Public Health 2012; 102(2): 336-42.
31. World Health Organization (WHO). Waist circumference and waist-hip ratio. Report of a WHO Expert Consultation. Geneva: WHO; 2008. 32. DeSalvo KB, Bloser N, Reynolds K, He J, Muntner P.
Mortality prediction with a single general self-rated health question: a meta-analysis. J Gen Intern Med 2006; 21(3): 267-75.
33. Dias-da-Costa JS, Olinto MTA, Gigante DP, Menezes AMB, Macedo S, Daltoé T, et al. Utilização de serviços ambulatoriais de saúde em Pelotas, Rio Grande do Sul, Brasil: alguns fatores relacionados com as consultas médicas acima da média. Cad Saúde Pública 2008; 24(2): 353-63. 34. Sáez M. Factors conditioning primary care services
utilization: empirical evidence and methodological inconsistencies. Gac Sanit 2003; 17(5): 412-9. 35. Boing AF, Matos IB, Arruda MP, Oliveira MC, Njaine K.
Prevalência de consultas médicas e fatores associados: um estudo de base populacional no sul do Brasil. Rev Assoc Med Bras 2010; 56(1): 41-6.
36. Ribeiro AQ, Acurcio FA, Wick JY. Pharmacoepidemiology of the elderly in Brazil: state of the art. Consult Pharm 2009; 24(1): 30-6, 41-4.
37. Silva AL, Ribeiro AQ, Klein CH, Acurcio FA. Utilização de medicamentos por idosos brasileiros, de acordo com a faixa etária: um inquérito postal. Cad Saúde Pública 2012; 28(6): 1033-45.
38. Hajjar ER, Caiero AC, Hanlon JT. Polypharmacy in elderly patients. Am J Geriatr Pharmacother 2007; 5(4): 345-51. 39. Guaraldo L, Cano FG, Damasceno GS, Rozenfeld S.
Inappropriate medication use among the elderly: a systematic review of administrative databases. BMC Geriatr 2011; 11: 79.
40. Ferraro KF, Su YP. Physician-evaluated and self-reported morbidity for predicting disability. Am J Public Health 2000; 90(1): 103-8.
41. Haapanen N, Miilunpalo S, Pasanen M, Oja P, Vuori I. Agreement between questionnaire data and medical records of chronic diseases in middle-aged and elderly Finnish men and women. Am J Epidemiol 1997; 145(8): 762-9.
42. Wu SC, Li CY, Ke DS. The agreement between self-reporting and clinical diagnosis for selected medical conditions among the elderly in Taiwan. Public Health 2000; 114(2): 137-42.
Received on: 04/17/2015