ABSTRACT: Objective: To analyze the association between perceived neighborhood environment and physical activity (PA) in high school students from Curitiba (PR), Brazil. Methods: A sample of 1,611 high school students from public schools was surveyed. The PA was assessed through questions, engaged for at least 20 minutes or 60 minutes. Perceptions on neighborhood environment were assessed through ten questions about neighborhood characteristics. Gender, age and number of cars in the household were self-reported and used as confounding variables. Absolute and relative frequencies were used in the sample, and associations were tested through adjusted logistic regressions for the confounding variables and stratiied by gender (p < 0.05). Results: The adjusted analyses showed that the variables “interesting things” among girls (OR = 1.77; 95%CI 1.05 – 2.96) and “there are places I like” (OR = 2.18; 95%CI 1.33 – 3.58) and “I see people my age”, among boys, were associated with PA of at least 20 minutes/day once a week. Additionally, among boys, “I see people my age” was associated with 60-minute (OR = 1.68; 95%CI 1.15 – 2.45). Perceiving the neighborhood environment as “very good” was associated with higher chances of taking up PA among girls (OR = 1.92; 95%CI 1.15 – 3.22) and boys (OR = 3.13; 95%CI 1.97 – 4.97). Conclusion: A positive perception of the environment was associated to PA practice among boys and girls in this sample. The results suggest that some environmental characteristics which make neighborhoods more attractive could be related to PA among adolescents.
Keywords: Environment. Perception. Physical Activity. Motor Activity. Public Health. Adolescent.
Perceived neighborhood environment
and physical activity among high
school students from Curitiba, Brazil
Ambiente do bairro percebido e atividade física
entre estudantes do ensino médio de Curitiba, Brasil
Adalberto Aparecido dos Santos LopesI,II,III, Alessandra Nunes LanzoniIII, Adriano Akira Ferreira HinoII,III, Ciro Romélio Rodriguez-AñezIII,IV, Rodrigo Siqueira ReisI,II,III
ORIGINAL ARTICLE / ARTIGO ORIGINAL
ISchool of Health and Biosciences; Pontifícia Universidade Católica do Paraná - Curitiba (PR), Brazil. IIGraduate Program in Physical Education; Universidade Federal do Paraná - Curitiba (PR), Brazil.
IIIResearch Group in Physical Activity and Quality of Life; Pontifícia Universidade Católica do Paraná - Curitiba (PR), Brazil. IVUniversidade Tecnológica Federal do Paraná - Curitiba (PR), Brazil.
Corresponding author: Adalberto Lopes. Rua Imaculada Conceição, 1155, CEP 80215-901, Curitiba, PR, Brazil. E-mail: [email protected]
INTRODUCTION
The regular practice of physical activity (PA) has been recommended for people all ages due to its beneicial efects on health1. Such efects are also observed in both physical2
and mental health3 of children and adolescents. Despite that, a great proportion of young
people have low levels of PA4. Evidence suggest that the physically active behavior in
adolescence tends to be continued in adulthood5.
In this sense, the understanding of the factors which inluence PA among adolescents is important in order to develop intervention strategies which maintain or attenuate the declines observed at this age6. Several studies have been trying to understand the correlates and
determinants of PA among adolescents, in order to increase the efectiveness of programs and interventions on the promotion of PA among teenagers7.
Practicing PA demands spaces and speciic facilities, therefore the study of the natural and built up environments’ characteristics is important in the understanding of how much those are able to stimulate or inhibit PA8,9. In fact, there is an increasing number
of studies assessing the relations between environment and youngsters’ PA10. Among
teenagers, it is believed that the inluence of the social and built up environments is also important11,12, once they are subjected to social standards or rules (parents’ authorization
or friends’ invitations, for example) which may interfere on their access to a number of locations, including places intended for PA practicing. For example, adolescents who live in more insecure regions, in terms of crime incidence, and with higher social disorder13
or the ones living far from parks and recreational facilities14 are less active than teenagers
who live in safer places and close to parks. However, there is basically no evidence of this relation in countries of low or medium incomes. In Brazil, two large studies carried out in capitals do not present a direct relation between safety perception and PA practice. Nevertheless, the same studies show that observing people their own age practicing PA in the neighborhood and noticing the existence of places they like near their home (♂ OR = 1.96; 95%CI 1.40 – 2.78 and ♀ OR = 1.33; 95%CI 1.10 – 1.74)15 and the presence
of people their own age (♀ OR = 1.8; IC95% 1.3 – 2.4) are associated to PA practice16.
However, in addition to being limited and few studies, the results available up until now show inconsistency as to their indings. Thus, given the need for broadening the knowledge on PA correlates among Brazilian adolescents and the neraly inexistence of studies on which environmental characteristics are related to PA in this age group, this study aims at analyzing the association between the characteristics perceived in the neighborhood environment and the practice of PA among high school students in the city of Curitiba (PR).
METHODS
This study is characterized as a school-based cross-sectional survey. The data were collected between March and May 2006, in Curitiba (PR), as a part of the project “Determinantes da atividade física e obesidade em escolares do ensino médio da rede pública da cidade de Curitiba (PR), Brasil” (“Determinants of physical activity and obesity among high school students from public schools in Curitiba (PR), Brazil”).
According to the Secretaria Estadual de Educação do Paraná, in 2006 (year when the data were collected), there was a municipal population of 42,563 student adolescents in public schools, studying during daytime. In order to estimate the size of the sample, there were considered a sampling error of three percentage points, a estimated prevalence for PA practice at recommended levels of1 50%, a design efects of 1.5, a conidence interval of 95%
determined. School classes, with enough students to meet the desired number of students per grade, were randomly selected (n = 62) within the participant schools.
For the collection of the data, a questionnaire previously developed and validated for the evaluation of the perceived environment among American adolescents17; however, it
was translated and adapted into Portuguese and it presented adequate reliability values. For the present study, the Portuguese version was used in a group of teenagers in order to test the clarity and understanding of the items18. Its use was carried out inside the classroom,
during Physical Education class, and guided by interviewers who were trained for such. In order to assess the overall PA, we used the question adopted by the Youth Risk Behavior Surveillance System19. This measure has already been used in Brazilian studies20 and it presents
acceptable elevated reproducibility values (Interclass Correlation R = 0.87; 95%CI 0.81 – 0.91) and concurrent validity21. The teenagers who reported practicing PA ive or more days a
week for at least 60 minutes were classiied as active, corresponding to the most recent PA recommendations among youngsters1. Once the perceived environment variables may present
several forms of association for diferent PA levels22, a question was used in order to identify
the adolescents who take up any PA for at least 20 minutes at least once a week. This question has also been used in surveys of national coverage with American teenagers23.
The perception of the neighborhood environment was assessed by tem questions on the characteristics of the neighborhood in which the teenager lives, based on the items of the module of perceived environment assessment17. The processes of
translation, clarity and reliability were previously performed in a pilot study with Portuguese adolescents24. For this study, the translated version was used in a group of
teenagers in order to assess its clarity and understanding, and there was no need for further adaptations. The questions used were: “there are many places I like”, “Most streets have sidewalks”, “there are biking tracks or walking trails”, “taking a walk or playing is safe in my neighborhood”, “it is easy to see people walking”, “there is so much traffic it is difficult to take a walk”, “there are too many crimes”, “I always see people my age playing or exercising”, “There are a lot of interesting things to be seen when I take a walk”, “the streets are well lit at night”. The response options consisted of four categories (“I strongly disagree”, “I disagree”, “I agree” and “I strongly agree”).
The variables gender, age, weight, height, mother and father school education and the number of cars in the house were self-reported and used as potential confounding variables. Weight and height were used in order to calculate the body mass index (BMI). For this classiication, we used the cutof point derived from the Brazilian population25 to deine the
classes “average weight” (low and normal weight) and “excess of weight” (overweight and/ or obesity). The highest parental school education (father or mother) was used considering the highest of the three categories: complete elementary school (parents with no school education or complete elementary education, at best), complete high school education (parents who inished high school or who have incomplete college education) and complete college education (parents who, at least, inished their college education). The number of cars in the house was grouped into four categories (none; one; two; and three or more cars).
For the description of the participants in the study, the distribution of absolute and relative frequencies was used, comparing both gender using the χ² test for proportions. Potential confounding variables were identiied according to the criteria suggested in literature: 1) to be associated with the dependent variable within the “exposure” levels; 2) to be associated to the exposure and 3) not to be an “efect” of the “exposure” (independent variable)26. Similar
studies have identiied, yet, that the factors associated to PA difer signiicantly between genders15, therefore it was chosen to conduct the stratiies analyses according to the gender.
The relation between the variables of perceived neighborhood environment and the practice of PA was analyzed according to two outcomes (to exercise at least 20 minutes a day/week and to fulill the recommendation of 60 minutes of PA at least Five days/week) through binary logistic regressions stratiied by gender. The raw model was obtained through the analysis of neighborhood environmental factors with PA (for both outcomes); then, for the adjusted model, the relation between each environmental variable and the PA was analyzed, considering the confounding variables, speciically for outcomes and strata (gender). Finally, besides the confounding variables, all factors of neighborhood environment perception statistically related to PA were inserted in a third model of analysis. Such analyses were carried out by the statistical softwares SPSS 17.0 and STATA 9.2 and the signiicance level was kept at 5%. Considering it is a cluster sample, the correction for the design efect was performed through the “svy” command for the analysis of data from complex samples.
The research was approved by the Research Ethics Committee of the Pontifícia Universidade Católica do Paraná (CEP-PUCPR, No. 1076/2006) and the protocols followed the recommendations by the National System of Research Ethics.
RESULTS
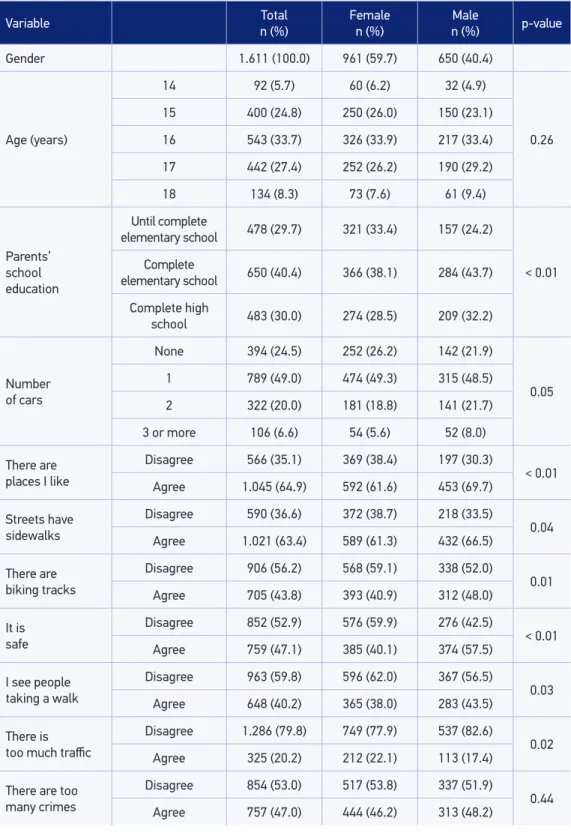
Table 1. Distribution of participants by sex, according to selected variables (n = 1.611).
Variable Total
n (%)
Female n (%)
Male
n (%) p-value
Gender 1.611 (100.0) 961 (59.7) 650 (40.4)
Age (years)
14 92 (5.7) 60 (6.2) 32 (4.9)
0.26 15 400 (24.8) 250 (26.0) 150 (23.1)
16 543 (33.7) 326 (33.9) 217 (33.4)
17 442 (27.4) 252 (26.2) 190 (29.2)
18 134 (8.3) 73 (7.6) 61 (9.4)
Parents’ school education
Until complete
elementary school 478 (29.7) 321 (33.4) 157 (24.2)
< 0.01 Complete
elementary school 650 (40.4) 366 (38.1) 284 (43.7)
Complete high
school 483 (30.0) 274 (28.5) 209 (32.2)
Number of cars
None 394 (24.5) 252 (26.2) 142 (21.9)
0.05 1 789 (49.0) 474 (49.3) 315 (48.5)
2 322 (20.0) 181 (18.8) 141 (21.7)
3 or more 106 (6.6) 54 (5.6) 52 (8.0)
There are places I like
Disagree 566 (35.1) 369 (38.4) 197 (30.3)
< 0.01 Agree 1.045 (64.9) 592 (61.6) 453 (69.7)
Streets have sidewalks
Disagree 590 (36.6) 372 (38.7) 218 (33.5)
0.04 Agree 1.021 (63.4) 589 (61.3) 432 (66.5)
There are biking tracks
Disagree 906 (56.2) 568 (59.1) 338 (52.0)
0.01 Agree 705 (43.8) 393 (40.9) 312 (48.0)
It is safe
Disagree 852 (52.9) 576 (59.9) 276 (42.5)
< 0.01 Agree 759 (47.1) 385 (40.1) 374 (57.5)
I see people taking a walk
Disagree 963 (59.8) 596 (62.0) 367 (56.5)
0.03 Agree 648 (40.2) 365 (38.0) 283 (43.5)
There is too much traic
Disagree 1.286 (79.8) 749 (77.9) 537 (82.6)
0.02 Agree 325 (20.2) 212 (22.1) 113 (17.4)
There are too many crimes
Disagree 854 (53.0) 517 (53.8) 337 (51.9)
0.44 Agree 757 (47.0) 444 (46.2) 313 (48.2)
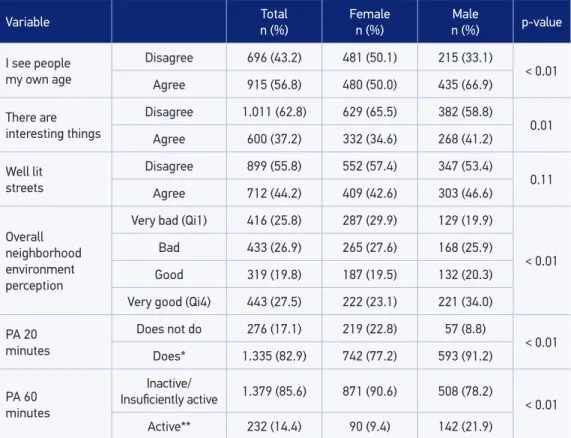
level and that they possess at least one family car. Also, most participants reported that, in their neighborhood, there are places they like (64.9%), There are sidewalks (63.4%) and biking tracks (56.2%) and safety is perceived as positive (52.9%). The “overall neighborhood environment perception” as “very good” was more frequent among boys (34.0% considered it to be “very good”) when compared to girls (23.1%). Finally, most part of the participants (82.9%) take part in some PA (at least 20 minutes in one day/week), though only 14% of them classify within the recommendation for PA practice with beneits to health (60 minutes at least ive days/week). In general, the proportion of active boys was higher than the one of girls for both PA outcomes (91.2 versus 82.9%; 21.9 versus 9.4%, respectively).
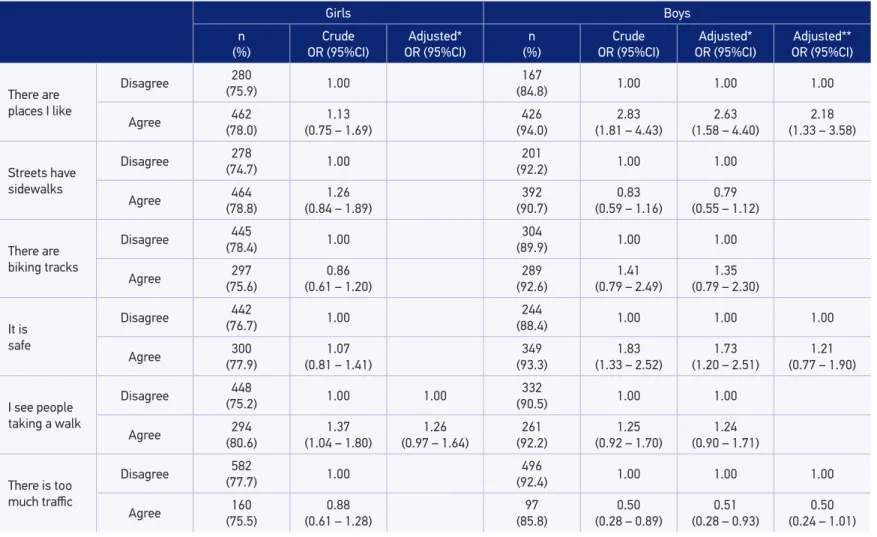
In Table 2, the analyses of the raw and adjusted associations between the perceived environment variables and the PA for boys and girls are presented, following the 20-minute PA criterion. Among girls, the only neighborhood environment variable which remained in the inal model, after the adjustment of the remaining variables, was “there are interesting things in my neighborhood” (OR = 1.77; 95%CI 1.05 – 2.96). Among boys, the variables “There are places I like in my neighborhood” (OR = 2.18; 95%CI 1.33 – 3.58) and “I see
Variable n (%)Total Femalen (%) n (%)Male p-value
I see people my own age
Disagree 696 (43.2) 481 (50.1) 215 (33.1)
< 0.01 Agree 915 (56.8) 480 (50.0) 435 (66.9)
There are interesting things
Disagree 1.011 (62.8) 629 (65.5) 382 (58.8)
0.01 Agree 600 (37.2) 332 (34.6) 268 (41.2)
Well lit streets
Disagree 899 (55.8) 552 (57.4) 347 (53.4)
0.11 Agree 712 (44.2) 409 (42.6) 303 (46.6)
Overall neighborhood environment perception
Very bad (Qi1) 416 (25.8) 287 (29.9) 129 (19.9)
< 0.01 Bad 433 (26.9) 265 (27.6) 168 (25.9)
Good 319 (19.8) 187 (19.5) 132 (20.3)
Very good (Qi4) 443 (27.5) 222 (23.1) 221 (34.0)
PA 20 minutes
Does not do 276 (17.1) 219 (22.8) 57 (8.8)
< 0.01 Does* 1.335 (82.9) 742 (77.2) 593 (91.2)
PA 60 minutes
Inactive/
Insuiciently active 1.379 (85.6) 871 (90.6) 508 (78.2) < 0.01
Active** 232 (14.4) 90 (9.4) 142 (21.9)
*practices PA at least 20 minutes, once a week **practices PA at least 60 minutes, 5 days a week; PA: physical activity.
Table 2. Factors associated with the practice of 20-minute physical activity among high school students.
Girls Boys
n (%)
Crude OR (95%CI)
Adjusted* OR (95%CI)
n (%)
Crude OR (95%CI)
Adjusted* OR (95%CI)
Adjusted** OR (95%CI)
There are places I like
Disagree 280
(75.9) 1.00 (84.8)167 1.00 1.00 1.00
Agree 462 (78.0)
1.13
(0.75 – 1.69) (94.0)426 (1.81 – 4.43)2.83 (1.58 – 4.40)2.63 (1.33 – 3.58)2.18
Streets have sidewalks
Disagree 278
(74.7) 1.00 (92.2)201 1.00 1.00
Agree (78.8)464 (0.84 – 1.89)1.26 (90.7)392 (0.59 – 1.16)0.83 (0.55 – 1.12)0.79
There are biking tracks
Disagree (78.4)445 1.00 (89.9)304 1.00 1.00
Agree (75.6)297 (0.61 – 1.20)0.86 (92.6)289 (0.79 – 2.49)1.41 (0.79 – 2.30)1.35
It is safe
Disagree (76.7)442 1.00 (88.4)244 1.00 1.00 1.00
Agree (77.9)300 (0.81 – 1.41)1.07 (93.3)349 (1.33 – 2.52)1.83 (1.20 – 2.51)1.73 (0.77 – 1.90)1.21
I see people taking a walk
Disagree 448
(75.2) 1.00 1.00
332
(90.5) 1.00 1.00
Agree 294 (80.6)
1.37 (1.04 – 1.80)
1.26 (0.97 – 1.64)
261 (92.2)
1.25 (0.92 – 1.70)
1.24 (0.90 – 1.71)
There is too much traic
Disagree 582
(77.7) 1.00
496
(92.4) 1.00 1.00 1.00
Agree 160
(75.5) (0.61 – 1.28)0.88 (85.8)97 (0.28 – 0.89)0.50 (0.28 – 0.93)0.51 (0.24 – 1.01)0.50
*adjusted for confounding variables: cars per family and age **adjusted for signiicant variables on crude analysis.
Table 2. Continuation.
Girls Boys
n (%)
Crude OR (95%CI)
Adjusted* OR (95%CI)
n (%)
Crude OR (95%CI)
Adjusted* OR (95%CI)
Adjusted** OR (95%CI)
There are too many crimes
Disagree (78.0)403 1.00 (91.7)309 1.00 1.00
Agree 339
(76.4) (0.62 – 1.35)0.91 (90.7)284 (0.42 – 1.88)0.89 (0.42 – 1.91)0.90
I see people my own age
Disagree 360
(74.8) 1.00
184
(85.6) 1.00 1.00 1.00
Agree (79.6)382 (0.98 – 1.75)1.31 (94.0)409 (1.72 – 4.09)2.65 (1.51 – 3.71)2.37 (1.13 – 3.37)1.95
There are interesting things
Disagree 464
(73.8) 1.00 1.00 (89.3)341 1.00 1.00
Agree 278 (83.7)
1.83 (1.08 – 3.09)
1.77 (1.05 – 2.96)
252 (94.0)
1.89 (0.99 – 3.60)
1.82 (0.91 – 3.65)
Well lit streets
Disagree (75.7)418 1.00 (91.6)318 1.00 1.00
Agree 324 (79.2)
1.22
(0.89 – 1.68) (90.8)275 (0.72 – 1.12)0.90 (0.66 – 1.14)0.87
Overall neighborhood environment perception
Very bad 211
(73.5) 1.00
111
(86.1) 1.00 1.00
Bad (76.6)203 (0.84 – 1.66)1.18 (89.3)150 (0.82 – 2.23)1.35 (0.77 – 2.14)1.28
Good 141
(75.4) (0.75 – 1.62)1.10
121
(91.7) (1.04 – 3.05)1.78 (0.93 – 2.45)1.51
Very good 187 (84.2)
1.92 (1.15 – 3.22)
211 (95.5)
3.42 (2.33 – 5.03)
people my age practicing PA” (OR = 1.95; 95%CI 1.13 – 3.37) remained associated to PA in the inal model. The “overall neighborhood environment perception” remained associated to PA for both girls (OR = 1.92; 95%CI 1.15 – 3.22) and boys (OR = 3.13; 95%CI 1.97 – 4.97)
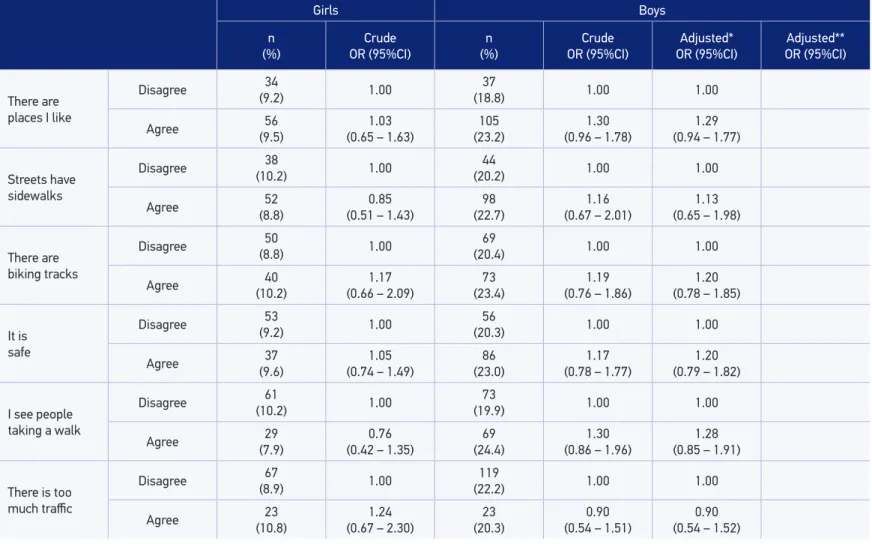
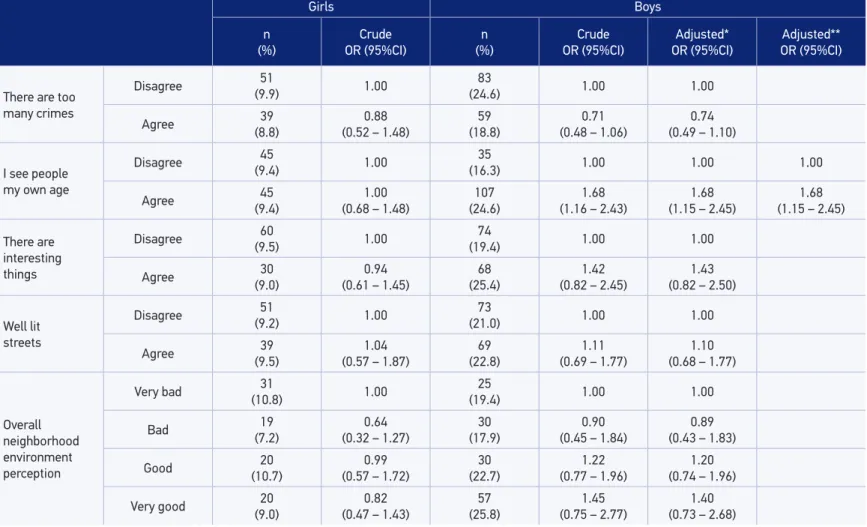
In Table 3 we presented the results of the association between PA practice at recommended levels and the neighborhood environment perception, according to gender. Among girls, there were no associations for any of the environmental variables, while among boys only the variable “I see people my age practicing PA” remained associated to the inal model (OR = 1.68; 95%CI 1.15 – 2.45). No associations to the indicator “overall neighborhood perception” were observed for either gender.
DISCUSSION
This was one of the first studies to identify the environmental correlates among adolescents in Brazil and one of the few in Latin America. The probabilistic sampling allowed inferring to the population of public schools of the city and had enough power to detect relatively small effects. Still, the analyses were stratified between boys and girls, enabling gender-specific applications. Besides that, the confounding variables were properly tested and applied according to the normative criteria, not limited only to what has been suggested in the literature. At last, two distinct cutoff points were used, allowing the identification of variables which may contribute so that teenagers do “some/any” physical activity and achieve the recommended activity levels, making this study more applicable into reality.
However, some limitations ought to be considered for the interpretation of this study’s results. Its cross-sectional design does not allow identifying the sense of the observed associations, and therefore, the adolescents may have presented better perception of their environment as a result of the increased levels of PA. The PA practice was assesses by a widely used overall measure with adequate psychometric properties27, though it does not
detail the domain (leisure or transportation) in which it is performed, neither its intensity, characteristics which are related in different ways to the environment7. In addition to
that, the instrument used in order to assess the environmental characteristics perception was originally developed for adults and, although it has been translated, adapted, tested and previously applied to17, it may not allow the assessment of important environmental
characteristics for teenagers. Despite the sample’s size and design, only students from the public educational system were assessed, making it impossible to broaden the result data over all population. Also, the possible effects of negative confounding were not taken into consideration in the adjusted model.
Table 3. Factors associated with the practice of 60-minute physical activity on high school students.
Girls Boys
n (%)
Crude OR (95%CI)
n (%)
Crude OR (95%CI)
Adjusted* OR (95%CI)
Adjusted** OR (95%CI)
There are places I like
Disagree 34
(9.2) 1.00 (18.8)37 1.00 1.00
Agree 56
(9.5) (0.65 – 1.63)1.03 (23.2)105 (0.96 – 1.78)1.30
1.29 (0.94 – 1.77)
Streets have sidewalks
Disagree 38
(10.2) 1.00 (20.2)44 1.00 1.00
Agree 52
(8.8) (0.51 – 1.43)0.85 (22.7)98 (0.67 – 2.01)1.16
1.13 (0.65 – 1.98)
There are biking tracks
Disagree 50
(8.8) 1.00 (20.4)69 1.00 1.00
Agree (10.2)40 (0.66 – 2.09)1.17 (23.4)73 (0.76 – 1.86)1.19 (0.78 – 1.85)1.20
It is safe
Disagree (9.2)53 1.00 (20.3)56 1.00 1.00
Agree (9.6)37 (0.74 – 1.49)1.05 (23.0)86 (0.78 – 1.77)1.17 (0.79 – 1.82)1.20
I see people taking a walk
Disagree (10.2)61 1.00 (19.9)73 1.00 1.00
Agree (7.9)29 (0.42 – 1.35)0.76 (24.4)69 (0.86 – 1.96)1.30 (0.85 – 1.91)1.28
There is too much traic
Disagree 67
(8.9) 1.00
119
(22.2) 1.00 1.00
Agree 23
(10.8)
1.24 (0.67 – 2.30)
23 (20.3)
0.90 (0.54 – 1.51)
0.90 (0.54 – 1.52)
Girls Boys
n (%)
Crude OR (95%CI)
n (%)
Crude OR (95%CI)
Adjusted* OR (95%CI)
Adjusted** OR (95%CI)
There are too many crimes
Disagree (9.9)51 1.00 (24.6)83 1.00 1.00
Agree 39
(8.8) (0.52 – 1.48)0.88 (18.8)59 (0.48 – 1.06)0.71 (0.49 – 1.10)0.74
I see people my own age
Disagree 45
(9.4) 1.00 (16.3)35 1.00 1.00 1.00
Agree (9.4)45 (0.68 – 1.48)1.00 (24.6)107 (1.16 – 2.43)1.68 (1.15 – 2.45)1.68 (1.15 – 2.45)1.68
There are interesting things
Disagree (9.5)60 1.00 (19.4)74 1.00 1.00
Agree 30
(9.0)
0.94 (0.61 – 1.45)
68 (25.4)
1.42 (0.82 – 2.45)
1.43 (0.82 – 2.50)
Well lit streets
Disagree 51
(9.2) 1.00 (21.0)73 1.00 1.00
Agree 39
(9.5) (0.57 – 1.87)1.04 (22.8)69
1.11
(0.69 – 1.77) (0.68 – 1.77)1.10
Overall neighborhood environment perception
Very bad (10.8)31 1.00 (19.4)25 1.00 1.00
Bad 19
(7.2)
0.64 (0.32 – 1.27)
30 (17.9)
0.90 (0.45 – 1.84)
0.89 (0.43 – 1.83)
Good 20
(10.7) (0.57 – 1.72)0.99 (22.7)30
1.22
(0.77 – 1.96) (0.74 – 1.96)1.20
Very good (9.0)20 (0.47 – 1.43)0.82 (25.8)57 (0.75 – 2.77)1.45 (0.73 – 2.68)1.40
*adjusted for confounding variables: parents scholar degree **adjusted for signiicant variables on crude analysis.
PA practice (60 minutes of PA at least five days/week). Also, greater amounts of environment perception variables were associated to higher PA practice among boys when compared to girls.
In general, PA practice among girls seems not to relate to isolated environmental characteristics28. In this study, only one out of the ten questions (“there are interesting
things to see”) on the environment was associated to the practice of a PA among girls, which is corroborated by a study conducted in Portugal with teenagers of the same age range24. However, the measure of the overall neighborhood environment
perception was more strongly associated to PA practice in lower volumes, once no association to the practice PA at recommended levels were observed. This result was not observed was not observed as well in another study conducted in Brazil ( João Pessoa), in which girls who reported having interesting things to see, places they liked and to see other adolescents practicing physical activities presented higher probability of recommended PA20. Local characteristics may contribute to this
inconsistency of the findings. For example, Curitiba presents elevated residential density, amount of squares and green areas and structures for PA, resulting in higher availability of places for this practice29, which diminishes the variability of the
exposure variable. On the other hand, studies carried out in the same population group showed that the environmental barriers are the least reported ones29 and
they did not associate with PA30, among girls. Therefore, at least among girls, the
environment may be considered a factor against the their relationship with PA when compared to individual and psychological variables30.
Among boys, “places they like”, “seeing people their same age” and the overall measure of environment perception were associated to the practice of a PA. In a review study, when analyzed the relation of environment perception measures and the self-reported PA, 29% of all comparisons were signiicant and, although none of the environment variables have been strongly related to PA, important factors, such as Access to recreational equipments and the presence of sidewalks and biking tracks, are somehow associated10.
When we analyze the recommended levels of PA practice among boys, the only variable which did not present significant association was “seeing people their own age”, also associated among teenagers from João Pessoa20. This result reinforces the
importance of having partners, for boys, in the places they practice PA, evidencing greater influence of the social environmental characteristics in relation to the physical relations in the practice of PA. In a study performed in Rotterdam (Netherlands), on the other hand, when assessing moderate levels of PA, it was found an association between the perception of parks and squares and the practice of strolling or biking as a PA during leisure time, and also between the perception of public sports spaces and the practice of these activities at least three times a week31.
that a possible explanation for the non-association between PA as na active means of transportations and the safety of the neighborhood is the fact that teenagers do not have another option, considering the irrelevant perception of safety in this context32. However,
there are differences between the results of studies carried out in different countries32,33,
which may be explained by contextual aspects, such as the difference in criminality rates between high, medium and low income countries, or even methodological matters (for example, the low quality of safety measures).
CONCLUSION
A great proportion of adolescents do not meet the recommendation for PA practice. It is also concluded that the environment characteristics are related specially to the practice of some kind of PA and are less consistent when regarding recommended levels. Therefore, it is possible that the environment perceived aspects may be important in the practice of a PA, which is better than practicing no PA at all34. Both the social
environment characteristics and the physical environment are positively associated to the practice of a PA in general, though in a more inconsistent way between gender and in a more relevant way for boys when compared to girls.
These findings confirm that the perception of some environment factors may be important for teenagers’ PA practicing, and it should be considered when analyzing the connections between urban planning and health in populations of various age range. Tools and strategies have been suggested in order to include evidence on this relation for the implementation of policies and changes within the urban environment35.
Such information must be employed in urban planning involving systems of public transportation, parks, squares and biking tracks, making these locations rather attractive as meeting points for adolescents in PA practice.
1. World Health Organization. Global recommendations on physical activity for health. Geneva: WHO; 2010.
2. Strong WB, Malina RM, Blimkie CJ, Daniels SR, Dishman RK, Gutin B, et al. Evidence based physical activity for school-age youth. J Pediatr 2005; 146(6): 732-7.
3. Biddle SJ, Asare M. Physical activity and mental health in children and adolescents: a review of reviews. Br J Sports Med 2011; 45(11): 886-95.
4. Hallal PC, Andersen LB, Bull FC, Guthold R, Haskell W, Ekelund U; Lancet Physical Activity Series Working Group. Global physical activity levels: surveillance progress, pitfalls, and prospects. Lancet 2012; 380(9838): 247-57.
5. Friedman HS, Martin LR, Tucker JS, Criqui MH, Kern ML, Reynolds CA. Stability of Physical Activity across the Lifespan. J Health Psychol 2008; 13(8): 1092-104.
6. Marshall SJ, Biddle SJ, Gorely T, Cameron N, Murdey I. Relationships between media use, body fatness and physical activity in children and youth: a meta-analysis. Int J Obes Relat Metab Disord 2004; 28(10): 1238-46.
7. Bauman AE, Reis RS, Sallis JF, Wells JC, Loos RJ, Martin BW; Lancet Physical Activity Series Working Group. Correlates of physical activity: why are some people physically active and others not? The Lancet 2012; 380(9838): 258-71.
8. Hino AAF, Reis RS, Florindo AA. Ambiente construído e atividade física: Uma breve revisão dos métodos de avaliação. Rev Bras Cineantropom Desempenho Hum 2010; 12(5): 387-94.
9. Sallis JF, Cervero RB, Ascher W, Henderson KA, Kraft MK, Kerr J. An ecological approach to creating active living communities. Annu Rev Public Health 2006; 27: 297-322.
10. Ding D, Gebel K. Built environment, physical activity, and obesity: what have we learned from reviewing the literature? Health Place 2012; 18(1): 100-5.
11. Ding D, Sallis JF, Ker r J, Lee S, Rosenberg DE Neighborhood environment and physical activity among youth: A review. Am J Prev Med 2011; 41(4): 442-55.
12. Davison KK, Lawson CT. Do attributes in the physical environment inluence children’s physical activity? A review of the literature. Int J Behav Nutr Phys Act 2006; 3: 19.
13. Molnar BE, Gortmaker SL, Bull FC, Buka SL. Unsafe to Play? Neighborhood Disorder and Lack of Safety Predict Reduced Physical Activity Among Urban Children and Adolescents. Am J Health Promot. 2004; 18(5): 378-86.
14. Cohen DA, Ashwood JS, Scott MM, Overton A, Evenson KR, Staten LK et al. Public Parks and Physical Activity Among Adolescent Girls. Pediatics 2006; 118(5): e1381-9.
15. de Farias Júnior JC, Lopes Ada S, Mota J, Santos MP, Ribeiro JC, Hallal PC. Perception of the social and built environment and physical activity among Northeastern Brazil adolescents. Prev Med 2011; 52(2): 114-9.
16. Reis RS, Hino AA, Florindo AA, Añez CR, Domingues MR. Association between physical activity in parks and perceived environment: a study with adolescents. J Phys Act Health 2009; 6(4): 503-9.
17. Rosenberg D. Neighborhood Environment Walkability Scale for Youth (NEWS-Y): reliability and relationship with physical activity. Preventive Medicine 2009; 49(213): 8.
18. Farias Júnior JC. Development and validation of a questionnaire measuring factors associated with physical activity in adolescents. Rev Bras Saude Mater Infant 2011; 11(3): 301-12.
19. Centers for Disease Control and Prevention. Physical activity levels of high school students - United States, 2010. MMWR Morb Mortal Wkly Rep 2011; 60(23): 773-7.
20. Farias Júnior JC, Siqueira FV, Nahas MV, Barros MVG. Prevalence and associated factors to insuicient level physical activity and in youth from two city of Brazil: last seven days or typical week. Rev Bras Ativ Fís Saúde 2011; 25(4): 619-29.
21. Nahas MV, Barros MVG, Florindo AA, Farias Júnior JC, Hallal PC, Konrad L et al. Reprodutibilidade e validade do questionário saude na boa para avaliar atividade física e habitos alimentares em escolares do ensino médio. Rev Bras Ativ Fís Saúde 2007; 12(3): 10-8.
22. Gordon-Larsen P, McMurray RG, Popk in BM. Determinants of adolescent physical activity and inactivity patterns. Pediatrics 2000; 105(6): E83.
23. Lowry R, Lee SM, Fulton JE, Kann L. Healthy People 2010 Objectives for Physical Activity, Physical Education, and Television Viewing Among Adolescents: National Trends From the Youth Risk Behavior Surveillance System, 1999–2007. J Phys Act Health 2009; 6 Suppl 1: S36-45.
24. Santos MP, Page AS, Cooper AR, Ribeiro JC, Mota J. Perceptions of the built environment in relation to physical activity in Portuguese adolescents. Health Place 2009; 15(2): 548-52.
25. Conde WL, Monteiro CA. Body mass index cutof points for evaluation of nutritional status in Brazilian children and adolescents. J Pediatr (Rio J). 2006; 82(4): 266-72.
26. Rothman KJ, Greenlan S, Lash TL. “Validade em estudos epidemiológicos”. In Epidemiologia Moderna. ArtMed: Porto Alegre; 2011. p. 887.
27. Lee KS, Loprinzi PD, Trost SG.. Determinants of physical activity in Singaporean adolescents. Int J Behav Med 2010; 17(4): 279-86.
28. Reis RS, Hallal PC, Parra DC, Ribeiro IC, Brownson RC, Pratt M et al. Promoting physical activity through community-wide policies and planning: indings from curitiba, Brazil. J Phys Act Health 2010; 7(2): 137-45.
30. Prins RG, Oenema A, van der Horst K, Brug J. Objective and perceived availability of physical activity opportunities: diferences in associations with physical activity behavior among urban adolescents. Int J Behav Nutr Phys Act 2009; 6: 70.
31. Pizarro AN, Santos MP, Ribeiro JC, Mota J. Physical activity and active transport are predicted by adolescents - diferent built environment perceptions. J Public Health 2012: 20(1): 5-10.
32. Slater SJ, Ewing R, Powell LM, Chaloupka FJ, Johnston LD, O’Malley PM. The association between community physical activity settings and youth physical activity, obesity, and body mass index. J Adolesc Health 2010; 47(5): 496-503.
33. Mak KK, Ho SY, Lo WS, McManus AM, Lam TH. Prevalence of exercise and non-exercise physical activity in Chinese adolescents. Int J Behav Nutr Phys Act 2011; 8: 3.
34. Reis RS, Kelly CM, Parra DC, Barros M, Gomes G, Malta D et al. Developing a research agenda for promoting physical activity in Brazil through environmental and policy change. Rev Panam Salud Publica 2012; 32(2): 93-100.
Received on: 02/27/2013