Original article (short paper)
Effects of match situational variables on possession: The
case of England Premier League season 2015/16
Rodrigo Aquino
Universidade do Porto, Porto, Portugal
Universidade de São Paulo, USP, Ribeirão Preto, SP, Brazil
Júlio Garganta
Universidade do Porto, Porto, Portugal
João P. V. Manechini Bruno L. S. Bedo Enrico F. Puggina
Universidade de São Paulo, USP, Ribeirão Preto, SP, Brazil
Abstract - Aims: To identify the effects of match location, quality of opponents and match status on possession during the 2015/16 Season of England Premier League. Methods: Three hundred and eighty matches played by 20 teams were analysed. For each match, two values were recorded, resulting in 760 observations. Results: Teams who played at home (51.77 ± 10.22%) presented higher possession values (EF=moderate) than those who played away (48.21 ±
10.30%). Quality of opponents also had a signiicant difference, as possession was higher (EF=large) when teams
played against weak (52.30 ± 9.77%) than strong opponents (46.48 ± 10.38%). The multivariate analysis revealed
no interaction between situational variables and possession (p = 0.76). Despite the teams classiied as “best-ranking” (1st to 8th position: 50.60 ± 10.35%) presented greater possession (EF=moderate) than “worst-ranking” (9st to 20th position: 47.59 ± 9.74%), no signiicant differences were found in the comparisons of match status (winner [50.34 ± 10.48%] x drawer [49.95 ± 10.25%] x loser [49.68 ± 10.48%]). Conclusion: General interpretations should be viewed with caution, since the possession can represent an indicator of success for a team but not for others.
Keywords: football association, performance indicator, situational variables, match analysis, elite soccer.
Introduction
Match analysis in soccer has aroused much attention in the past few decades, with possession being one of the most studied performance indicators1-4. This emergent behaviour was stated because possession maintenance usually leads a team to victory5,6, but different possession strategies may be adopted during the same match depending on situational variables of the game7,8.
According to previous studies3,6, by adopting a more defensive pattern of play (i.e.,control the match) it is possible to increase
possession time and ind a way to goal by passing the ball or by long distance shots to offensive ield, both being predictors of
success. Yet, the same authors describe that teams with coun -terattack strategies (absorbing opponents’ attacks) often reach the goal by retaking possession and rapidly moving the ball to
scoring range. However, several factors are suggested to inlu-ence possession (e.g., physical, technical-tactical aspects, phase
of the competition). Match location (playing home or away),
quality and strength of opponents (e.g. “weak” or “strong” and
their position on league rankings), and match status (if winning,
losing or drawing) were identiied as the most important
situ-ational variables that dictates possession patterns9-13.
Concerning match location, playing home presented stronger interaction with team possession than playing away6,8,14, which might be explained by a more familiar environment and a more consistent style of play15,16. The quality of opposition is also a determinant variable when investigating possession in soccer12,16.
According to Taylor, Mellalieu10, when facing strong opponents, teams perform more passes and fewer dribbles. Moreover, there’s association between playing with strong opponents and the reduction in possession time3,8. In addition, recent researches have found interaction between match location and quality of opponents, in manner that when a team faces a strong opponent in home, for example, the possession time is likely to increase when comparing the away situation4,8. Authors have shown evidences that stronger teams presented more consistent patterns
of play and did not beneit the same home advantage outcomes
as weaker opponents6,8,17.
Match status has been pointed as the most important variable to explain possession along the match6. The evolving score is a factor that determines the strategies adopted by teams. For
example, losing-match status presented positive interaction with
ball possession, i.e., when losing, teams usually tried to retake and maintain possession, controlling the match (indirect play),
raising their overall possession time; while in the winning-match
status, teams lowered their possession, which may indicate a
preference for counter-attacking or direct play3,6,8. Also, it is
interesting the inluence of match status on the ield zone
pos-session, as Lago6 found that, when losing, possession time were
greater in offensive ield zone than when winning or drawing.
Nevertheless, many of the reviewed literature brings inconclu
-sive data for reasons such as small sample size, unstandardized
The England Premier League is considered one of the most
disputed and valuable leagues in the world. A non-typical 2015/16
Season of this championship has increased the attention of soc -cer coaches and practitioners in delimiting success indicators
in soccer. In a background of the scientiic literature, the latest
published study on the effects of match situational variables on possession dates from three years ago during the England Premier League4. Barnes, Archer18 identiied that physical (i.e.,
high-intensity running/sprinting distances) and technical (i.e., number of passes) performances have increased by 30-50% across seven seasons of the England Premier League (2006-07 to 2012-13). These evolutions can interfere on the possession
behaviour during current matches, i.e. higher number of success -ful passes can result in higher values of possession3. Thus, the discriminatory power may vary between home/away, matches
played against “strong” and “weak” opponents and successful/
unsuccessful teams along the seasons. In addition, the use of a large sample and the provision of the context of the competition (i.e., situational variables) are recommended for studies with match analysis12. Therefore, the main objective of this study was to investigate the effects of match location, quality of opponents and match status on possession withing a large matches sample of the 2015/16 Season of England Premier League.
Methods
Matches Sample
Three hundred and eighty matches played by the 20 teams of the England Premier League 2015/16 were considered for analysis. The championship was composed of 38 rounds. In each round were performed 10 clashes (matches). For each match, two values were recorded, resulting in 760 observations. For example, in the match Leicester City vs Arsenal the match location, quality of opponents, match status and possession were computed for both teams. Therefore, of the 760 values, 380 were home and 380 were away, 301 were played against strong and 459 against weak op -ponents, which resulted in 273 wins, 214 draws and 273 losses, with 1027 goals scored and 1027 goals conceded.
Procedures
This study was divided in two stages, each with a particular
analysis method. The irst stage aimed to verify possible
inlu-ences of match location and quality of opponents on possession
in all matches of England Premier League season 2015-2016, for
which independent and interactive effects of match location and quality of opponents on possession were assessed. The second stage aimed to identify if possession is a real indicator of success, with the teams being distributed between two groups: successful
(“best-ranking”) and unsuccessful (“worst-ranking”), verifying
if the possession of the ball would discriminate winner, drawer and loser teams. A successful discrimination can support the
Measures
Dependent variable: Possession was deined as the
percent-age of total time the team was in offensive phase. The start of
offensive phase was characterized by recovery of possession (e.g.,
interceptions and crosses followed by pass), while the end was determined by loss of possession (e.g., unsuccessful passing and dribbling). This variable was recorded in the three hundred and
eighty matches during the 2015-2016 England Premier League.
The data was obtained from website (http://www.sportstats.com/)
and was organized in Microsoft Excel sheets. An experienced
researcher and coach (soccer coaching experience with profes -sional players: 10 yrs; academic degree: graduated in sports sci -ence) analysed the possession in 15 randomly‐chosen matches and compared the achieved data with those from website (http:// www.sportstats.com/) to calculate the data reliability. The resulting Cohen’s kappa (k) values were between 0.84 and 0.91.
Independent variables:Matches were divided into episodes
related to match situational variables. These episodes were deined
as match location (i.e. played at home or played away), quality of opponents (i.e. played against strong or weak opponents) and match status (i.e. winners, drawers or losers). The quality of op
-ponents was determined according to k-means cluster analysis14
on inal team ranking at the end of the competition (sum of points obtained). The results identiied two clusters: “best-ranking”,
featuring strong opponents (1st to 8th position); “worst-ranking” representing the weak opponents (9th to 20th position). In addition,
these two clusters were used to deine successful group (strong
teams, n = 8) and unsuccessful group (weak teams, n = 12).
Statistical analysis
Data were analysed as mean and standard deviation (SD).
Normality (Kolmogorov-Smirnov) and homogeneity of
vari-ances (Levene) were checked, and no violations were noticed. To compare the average of the dependent variable (posses -sion) between the match location (home x away), quality of opponents (strong x weak) and teams ranking (best x worst),
we used the T-test for independent samples. One-way ANOVA
was performed to compare the average of the dependent vari -able between the match status (winners x drawers x losers). A multivariate general linear model was used to verify the effect of interactions between match situational variables (location, quality of opponents and status) on possession. Bonferroni
"post-hoc" test was applied when necessary. Fixed effect model was used in ANOVA and multivariate linear model. In
order to examine the possible differences between successful teams (winners x drawers x losers) and those which were not, a discriminant analysis was calculated. The magnitude of effect was calculated using Cohen's "d"19. The d values lower than 0.1, from 0.1 to 0.20, from 0.20 to 0.50, from 0.50 to 0.80 and higher than 0.80 were considered as trivial, small, moderate, large and
very large, respectively. Signiicance level was preserved at 5%
Results
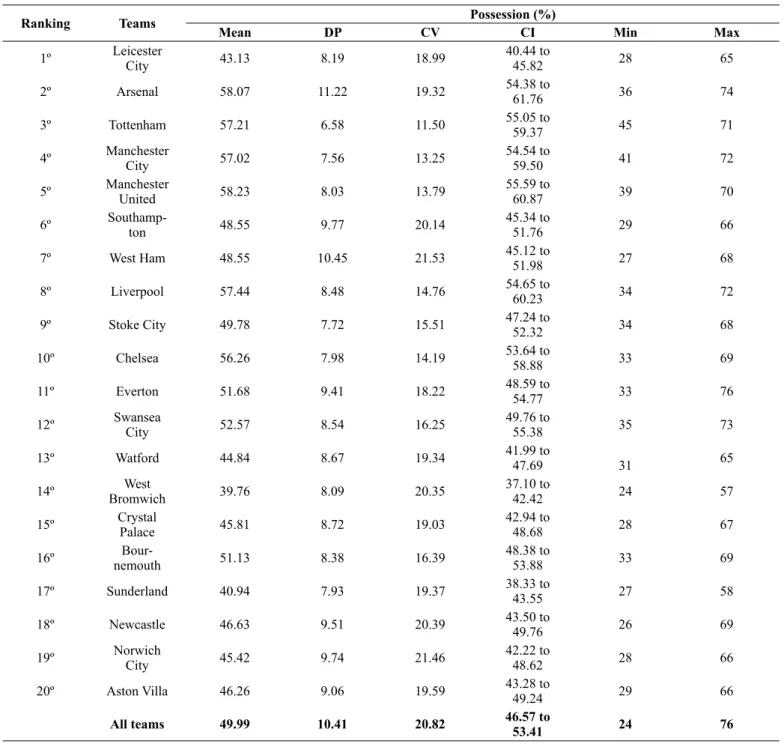
Table 1 presents the descriptive statistics. In general, teams
classiied as "best-ranking" (1st to 8th position) presented greater
possession than the "worst-ranking" teams (9th to 20th position). However, it’s possible to observe that the winner team (i.e.
Leicester City) showed low possession along the competition. Possession presented difference (t = 4.77; p < 0.001; d = 0.34
[moderate]) between matches played at home (51.77 ± 10.22
%) when compared with those played away (48.21 ± 10.30 %) (Figure 1A). Furthermore, the quality of opponents showed a
signiicant difference (t = 7.83; p < 0.001; d = 0.57 [large]), in
which was found higher possession values when teams played against weak opponents (52.30 ± 9.77 %) in comparison to strong opponents (46.48 ± 10.38 %) (Figure 1B).
For univariate analysis, no difference was found in the compari
-son of match status (winner [50.34 ± 10.48 %] x drawer [49.95 ± 10.25 %] x loser [49.68 ± 10.48%]) for possession (F(2,757) = 0.276; p = 0.76) (Figure 2A). Nonetheless, regarding teams ranking, a
signiicant difference was found (t = 8.12; p < 0.001; d = 0.30 [moderate]) on possession values (Best: 50.60 ± 10.35 %; Worst:
47.59 ± 9.74 %) (Figure 2B).
Table 1. Descriptive statistics (mean, standard deviation [DP], coeficient of variation [CV], 95% conidence intervals [CI], minimum [Min], maximum [Max]) of the possession during the England Premier League season 2015/16.
Ranking Teams Possession (%)
Mean DP CV CI Min Max
1º Leicester
City 43.13 8.19 18.99
40.44 to
45.82 28 65
2º Arsenal 58.07 11.22 19.32 54.38 to
61.76 36 74
3º Tottenham 57.21 6.58 11.50 55.05 to
59.37 45 71
4º Manchester
City 57.02 7.56 13.25
54.54 to
59.50 41 72
5º Manchester
United 58.23 8.03 13.79
55.59 to
60.87 39 70
6º Southamp
-ton 48.55 9.77 20.14
45.34 to
51.76 29 66
7º West Ham 48.55 10.45 21.53 45.12 to
51.98 27 68
8º Liverpool 57.44 8.48 14.76 54.65 to
60.23 34 72
9º Stoke City 49.78 7.72 15.51 47.24 to
52.32 34 68
10º Chelsea 56.26 7.98 14.19 53.64 to
58.88 33 69
11º Everton 51.68 9.41 18.22 48.59 to
54.77 33 76
12º Swansea
City 52.57 8.54 16.25
49.76 to
55.38 35 73
13º Watford 44.84 8.67 19.34 41.99 to
47.69 31 65
14º West
Bromwich 39.76 8.09 20.35
37.10 to
42.42 24 57
15º Crystal
Palace 45.81 8.72 19.03
42.94 to
48.68 28 67
16º Bour
-nemouth 51.13 8.38 16.39
48.38 to
53.88 33 69
17º Sunderland 40.94 7.93 19.37 38.33 to
43.55 27 58
18º Newcastle 46.63 9.51 20.39 43.50 to
49.76 26 69
19º Norwich
City 45.42 9.74 21.46
42.22 to
48.62 28 66
20º Aston Villa 46.26 9.06 19.59 43.28 to
49.24 29 66
All teams 49.99 10.41 20.82 46.57 to
Figure 1. Inluence of match location (A) and quality of opponents (B) on possession during the England Premier League season 2015/16. ** p < 0.001.
Multivariate general linear model showed no interaction ef -fects between match situational variables on possession, i.e. match location*quality of opponents (Z = 0.536; p = 0.46; η2 = 0.11), match location*match status (Z = 1.038; p = 0.35; η2 = 0.23), quality of opponents*match status (Z = 1.568; p = 0.20; η2 = 0.33) and match location*quality of opponents*match status (Z = 0.414; p = 0.66;
η2 = 0.11). Finally, the results of the discriminant analysis revealed
that only 36.3% of cases were classiied correctly (see Table 2).
Figure 2. Inluence of match status (A) and team ranking (B) on possession during the England Premier League season 2015/16. ** p < 0.001.
Discussion
The main contribution of the present study is the proposition
of scientiic evidences that possession analysed independently
Table 2. Teams’ classiication by match status and according to discriminant function analysis values.
Original group
Predicted group membership
Winner Drawer Loser
Winner 49.9% 4.4% 46.6%
Drawer 48.1% 3.7% 48.1%
Loser 46.7% 4.4% 48.9%
Note: 36.3% of cases were classiied correctly.
crucial to success in elite soccer disputed during the England
Premier League. Speciically, the results showed independent
effects of match location and quality of opponents on possession,
i.e. home matches or matches against weak opponents resulted in greater possession compared to away or against strong op
-ponents matches, respectively. Despite the teams classiied as "best-ranking" had higher possession compared to teams classiied as "worst-ranking," according to the results of match status, there were no signiicant differences in the comparisons
winners x drawers x losers. This is conirmed by the results found in the discriminant function analysis, where only 36.3% of cases
were classiied correctly. The unsuccessful discrimination
can-not support the validity of the possession to discriminate teams that win, draw and lose. Therefore, the use of this parameter as success indicator should be viewed with caution by the coaches and practitioners in the England Premier League.
The match location variable inluenced independently the
possession during the England Premier League 2015/16, i.e.,
Premiership. Lago and Martín3 showed that home teams have more possession than away teams using data from 170 matches
of the 2003-04 Spanish Soccer League. The same behaviour
was found by a myriad of studies5,8,10,22. Previous researches in sport psychology have demonstrated factors that can explain this behaviour, such as crowd effects23, crowd density24, local familiar -ity25, and travel26. In addition, the tactic strategy adopted by the team in home (i.e., control the match with “possession play”) can
explain this advantage3. On the other hand, we can speculate that
nowadays top-teams do not change game model playing home
or away matches. The changes can occur according to opponent quality, game model (strategy), and match status.
Quality of opponents is another match situational variable that
inluenced the possession during the England Premier League
2015/16. Matches against weak opponents presented a higher possession percentage than matches against strong opponents. In short, Almeida, Ferreira14 explain this result pointing that stronger teams dominate possession against their weaker op -ponents5,6, showing more stable game patterns, independently
of the evolving score-line6,8. In addition, these strong teams did not experience the same home advantage as inferior opponents17.
According to the match status, our study didn’t ind any
differences for possession when comparing winners x drawers
x losers. In contrast, other previous studies
1,3,8showed greater possession when losing than winning and explained their results by changes in tactics and the playing style adopted according
to the within-match status, i.e., when winning suggesting they preferred to play counterattacking or direct play and when losing
suggesting they preferred to “control” the match by dictating
play or indirect play. Methodological issues can explain these
different indings. The aforementioned studies splitted the
variable match status by time (minutes) the team was winning, drawing or losing. In our study, the possession of the ball was obtained at the end of each match. This choice is especially justi
-ied because our purposes in each game were to verify the inal
result and not the offensive strategies of each team according to the evolving score (i.e., score-line).
On the other hand, “best-ranking” teams (1st to 8th position), analysed in our study, demonstrated greater possession than the
“worst-ranking” (9th to 20th position). However, from an indi -vidual team perspective, the champion team (Leicester City) presented low average possession (43.13 ± 8.19 %). In addition,
“best-ranking” teams showed little differences in coeficients of variation compared to “worst-ranking”, e.g., Leiceister City (1st position: CV = 18.99 %) and Aston Villa (20th position: CV = 19.59 %). This suggests that, besides the analysis of performance indicators of all teams together, attention must be paid to soccer performance analysis from the perspective of teams individually27. For example, in the case of England Premier League season 2015/16, it is possible to interpret that Leicester City (champion) preferred to play counterattacking or direct play (low average possession), i.e., this is a success indicator for this team. But for the Arsenal (2th position), the possession of the ball can be a suc
-cess indicator (high average possession [58.07 ± 11.22 %]), i.e.,
suggesting they preferred to “control” the match by indirect play.
Another example refers to a UEFA Champions League 2015/16, the most prestigious club competition in Europe14. The inalist
teams (Atletico Madrid and Real Madrid) had different possession behaviour throughout the competition. While Atletico Madrid presented low average possession (~ 46%), the Real Madrid demonstrated an indirect style of play (high average possession:
~ 54%) (data from oficial UEFA website: http://pt.uefa.org/). The inal between the two clubs in Madrid was widely seen as
a confrontation between a team with a match philosophy based in terms of possession (Real Madrid) and a more direct playing style team (Atletico Madrid). Therefore, by soccer performance analysis from the perspective of individual teams, rather than analysing only possession behaviour of all teams together, it is
possible to plan more speciic training sessions. This can promote a better deinition of what are the real indicators of success of a
team and do not make general interpretations. Coaches can use this information to prepare their teams according to individual characteristics of the players.
This study is not without limitations. Two should be recog
-nized, being irst: possession analyses were registered in the end
of the matches. To measure the match status, the time length each team was winning (minutes winning), drawing (minutes drawing) and losing (minutes losing) can promote other interpre -tations. However, one of the purposes of our study is to question the actual use of possession as indicator of success, and so the record of this variable in minutes will become unnecessary; and second, in this study we did not analyse the possession of the
ball in different ield zones (e.g., defensive, defensive midield,
offensive midield, offensive) and in different leagues. We
as-sume this limitation and recommend for future researches three main data approaches: i) relation between ball possession and the
ield zones it tends to occur; ii) relationship between possession per attack and the inal result of the respective attacking; and
iii) understand how possession is performed, i.e., how players’ behaviours such as passes (short/long), dribbling, shots, allow the teams to maintain ball possession and if it differs between
clubs and players. On the other hand, our study supports the critical review of Mackenzie and Cushion (2013) which
sug-gests a checklist for future researches on soccer performance
analysis: i) strong power of generalization of indings based on the sample size (n = 380 matches) and ii) provide the context of the competition (location, quality of opponents and status). These strong points can increase the validity of results presented.
In summary, our indings demonstrated independent effects
of match location and quality of opponents in possession during
England Premier League season 2015-06, with greater values
when teams played at home or against weak opponents. In
addition, it was not veriied inluence of match status on pos-session behaviour, despite “best-ranking” teams showed more possession than “worst-ranking”. General interpretations should
be viewed with caution, since the possession can represent an indicator of success for a team but not for others.
References
2. Hughes MD, Bartlett RM. The use of performance indicators in performance analysis. J Sports Sci. 2002;20(10):739-54. 3. Lago C, Martín R. Determinants of possession of the ball in soc
-cer. J Sports Sci. 2007;25(9):969-74.
4. Bradley PS, Lago-Peñas C, Rey E, Sampaio J. The inluence of situational variables on ball possession in the English Premier League. J Sports Sci. 2014;32(20):1867-73.
5. Bloomield J, Polman R, O’donoghue P. Effects of score-line on team strategies in FA Premier League Soccer. J Sports Sci. 2005;23(2):192-3.
6. Lago C. The inluence of match location, quality of opposition, and match status on possession strategies in professional association football. J Sports Sci. 2009;27(13):1463-9.
7. Collet C. The possession game? A comparative analysis of ball retention and team success in European and international football, 2007–2010. J Sports Sci. 2013;31(2):123-36.
8. Lago-Peñas C, Dellal A. Ball possession strategies in elite soccer according to the evolution of the match-score: the inluence of situational variables. J Hum Kinet. 2010;25:93-100.
9. Carling C, Williams AM, Reilly T. Handbook of soccer match analysis: A systematic approach to improving performance: Abingdon, UK: Routledge, 2005.
10. Taylor JB, Mellalieu SD, James N, Shearer DA. The inluence of match location, quality of opposition, and match status on techni -cal performance in professional association football. J Sports Sci. 2008;26(9):885-95.
11. Tucker W, Mellalieu DS, James N, Taylor BJ. Game location effects in professional soccer: A case study. Int J Perform Anal Sport. 2005;5(2):23-35.
12. Mackenzie R, Cushion C. Performance analysis in football: A critical review and implications for future research. J Sports Sci. 2013;31(6):639-76.
13. Sarmento H, Marcelino R, Anguera MT, CampaniÇo J, Matos N, LeitÃo JC. Match analysis in football: a systematic review. J Sports Sci. 2014;32(20):1831-43.
14. Almeida CH, Ferreira AP, Volossovitch A. Effects of match location, match status and quality of opposition on regain -ing possession in UEFA Champions League. J Hum Kinet. 2014;41(1):203-14.
15. Pollard R. Home advantage in football: A current review of an unsolved puzzle. TOSSJ. 2008;1(1):12-4.
16. Liu H, Gómez M-A, Gonçalves B, Sampaio J. Technical perfor-mance and match-to-match variation in elite football teams. J Sports Sci. 2016;34(6):509-18.
17. Lago-Peñas C, Lago-Ballesteros J, Rey E. Differences in perfor-mance indicators between winning and losing teams in the UEFA Champions League. J Hum Kinet. 2011;27:135-46.
18. Barnes C, Archer D, Hogg B, Bush M, Bradley P. The evolution of physical and technical performance parameters in the English Premier League. Int J Sports Med. 2014;35(13):1095-100. 19. Cohen J. Statistical power analysis for the behavioral sciences
(revised ed.). New York: Academic Press; 1977.
20. Lago-Ballesteros J, Lago-Peñas C. Performance in team sports: Identifying the keys to success in soccer. J Hum Kinet. 2010;25:85-91.
21. Thomas S, Reeves C, Davies S. An analysis of home advan -tage in the English Football Premiership. Percept Motor Skill. 2004;99(3_suppl):1212-6.
22. Jones P, James N, Mellalieu SD. Possession as a performance indicator in soccer. Int J Perform Anal Sport. 2004;4(1):98-102. 23. Agnew GA, Carron AV. Crowd effects and the home advantage.
Int J Sports Psychol. 1994.
24. Dowie J. Why Spain should win the world cup. New Scientist. 1982;94(1309):693-5.
25. Moore JC, Brylinsky J. Facility familiarity and the home advan -tage. J Sport Behav. 1995;18(4):302.
26. Pace A, Carron AV. Travel and the home advantage. Can J Sport Sci. 1992;17(1):60-4.
27. Bray SR. The home advantage from an individual team perspec -tive. J Appl Sport Psychol. 1999;11(1):116-25.
Acknowledgments
This work was supported by the CAPES.
Corresponding author
*Rodrigo Aquino, MSc.
Medical School of University of Sao Paulo, Av. Bandeirantes, 3900, 14049-900, Ribeirao Preto, Brazil.
Email: [email protected]
Manuscript received on July 30, 2017 Manuscript accepted on September 14, 2017