Rev Bras
Cineantropom
Hum
DOI: http://dx.doi.org/10.5007/1980-0037.2016v18n1p72
original article
Ball Recovery Consistency as a Performance
Indicator in Elite Soccer
Consistência na recuperação da bola como indicador
de desempenho no futebol
Mohammad Maleki1
Kourosh Dadkhah2
Farhad Alahvisi1
Abstract – In soccer, an attack begins with ball recovery. herefore, the consistency of this performance indicator during a match and its balanced distribution in the ield zones can be one of the distinct characteristics of successful soccer teams. his study aims to investigate the performance consistency of ball recovery during a match within several time periods (6 periods of 15 min) and zones (four zones). To this end, observational methodology and software Focus X2 were adopted to evaluate 28 matches of semi-inal teams at FIFA 2014 including Germany, Argentina, Netherlands, and Brazil in terms of ball recovery frequency. In total, 3222 performances were recorded. All teams in each match and in whole competition had homogeneity of distribution of ball recovery during the time periods (χ2
3=1.597, p=0.66). he results of time-zone evaluation indicated that
Netherlands and Brazil teams did not have performance consistency on all ield zones (χ2
15=31.29, p=0.008 and χ 2
15=37.53, p=0.001, respectively). Most ball recoveries were
made in the defensive and middle-defensive zones in accordance with modern soccer. It was found that for a soccer team to be successful, it requires a space distribution of experienced players in the ield, which leads to power balance for redesigning a team to be ofensive in all zones.
Key words: Soccer; Sports; Time.
Resumo – No futebol, um ataque começa com recuperação de bola. Por isso, a consistência desse indicador de desempenho pode ser uma das características distintas para o sucesso das equipes de futebol. Este estudo tem como objetivo investigar a consistência da recuperação da bola no desempenho durante um jogo dentro de vários períodos de tempo (6 períodos de 15 min) e zonas (quatro zonas). Empegou-se o software Focus X2 para avaliar 28 partidas das equipes que chegaram às semiinais do mundial da FIFA de 2014 (Alemanha, Argentina, Holanda e Brasil) em termos de frequência de recuperação de bola. No total, foram registados 3,222 desempenhos. Todas as equipes em cada jogo e em toda competição teve a homogeneidade da distribuição de
recuperação de bola durante os períodos de tempo (χ23 = 1.597, p = 0,66). Os resultados indicaram
que as equipes da Holanda e do Brasil não tinham consistência de desempenho em todas as zonas
de campo (χ215 = 31,29, p = 0,008 e χ215 = 37,53, p = 0,001, respectivamente). A maioria
das recuperações de bola foi feita na zona defensiva e na zona meio-defensivo. Veriicou-se que para um time de futebol ser bem sucedido é necessário distribuição espacial dos jogadores mais
1 University of Kurdistan. Depart-ment of Physical Education and Sport Sciences. Sanandaj. Iran
2 University of Kurdistan. Depart-ment of Sciences. Sanandaj. Iran
Received: 13 August 2015
Sports analysts regard the success of the world’s elite soccer teams as reliant on ball recovery1 and essential strategies to maintain ball possession2-4. his index plays an important role in the defensive as well as irst stage of attack, and most chances of goals at 2010 World Cup were related to ball recovery in the middle-defense zone4. his indicates the importance of middle and defensive player performance in the success of international soccer teams.
Success in soccer requires performance consistency and continuous team efort during time intervals of the match. One of the reasons of teams’ success lies in the implementation of stable behavior during the match as well as maintaining the ofensive stream, irrespective of the playing style, competition stage, and score line in progress2,4,5. Players of such teams do not wait for the opponents to make a mistake so as to take advantage of the turnovers, but rather continuously maintain the attack low through direct ball recovery such as interception and tackle1,6. herefore, one of the indicators of success in elite soccer involves a variety of behaviors for ball recovery and the zones where such behaviors are performed2-4, because such behaviors constitute the basis of any attack linked with the success of teams. Previous studies have shown that the majority of ball recoveries in World Cups 1982 and 1990 occurred from the defensive zone, in European Clubs from the midield zone7, in Euro 1996 from the ofensive zone8, in the World Cup 1998 from the mid-defensive zone9, at the World Cup 2002 from the mid-defensive zone10, at the World Cup 2010 from the defensive and mid-defensive zones4, and in European Champions League 2012-13 from the defensive zone11. Similarly, at the World Cup 1994, there were diferent ball recovery patterns that made successful teams adopt diferent playing styles12. Hence, ball recovery zone is a situational variable afecting match results11.
Ball Recovery Consistency Maleki et al.
contributed to Spain winning the Championship was their performance consistency across all matches14.
he only study on the consistency of performance indicators was conducted to assess time consistency of soccer performance indicators15. Time series and statistical methods such as autocorrelation and cross-correlation were employed to analyze match consistency and its relation with match results in 16 defensive, ofensive, and goal-related performance indicators in eight teams that qualiied for the quarter-inal stage of Euro 2012. he autocorrelation analysis revealed that Spain and Italy (inal-ists) had the highest performance consistency over consecutive matches compared to other teams. he cross-correlation analysis revealed that the highest relationship between goal-related parameters and match result was in Spain and France teams. With regard to ofensive related indicators, France, England, Portugal, Greece, Czech, and Spain performed better. Moreover, France, England, Greece, and Portugal performed better in defensive related indicators. Overall, successful teams in international soccer tournaments tended to have higher performance consistency than any other team in consecutive matches18. However, the results have not been conclusive if such situations would determine the success of teams in other international tournaments.
World Cups are interesting events in the ield of match analysis in terms of quality of opponents, match physical demands, frequency of matches, and time limitation, which are diferent from domestic leagues in any country and even continental tournaments4,15,16. Due to the complexity of soccer and the efects of situational parameters such as match location, quality of opponents, and match status on performance9,17,18, explorations have been carried out on the consistency of ball recovery as the success factor of elite soccer teams and the identiication of zone pattern of ball recovery which play signiicant roles in designing the ofensive event. Although consistency of diferent performance indicators15 as well as ball recovery performance in diferent zones of the ield have been studied, there has not been any literature on comparing the performance indicators of teams over time periods and within both time and zone aspects. Hence, the current study set to evaluate the performance consistency of ball recovery in successful teams at the World Cup 2014 during 15-minute periods of the matches. Although previous studies focused only on ball recovery in diferent zones4,12,13,19, here, the relationship between ball recovery time and zone in premier soccer teams at the World Cup 2014 was investigated.
METHODOLOGICAL PROCEDURES
team seven matches) of 64 matches throughout the tournament. Since the match results were not considered as dependent variable, the teams were equalized through examining only 90-minute periods of four World Cup successful teams while the extra times were excluded from the analysis. he videotapes of each game were recorded to be analyzed.
Data collection instrument
he sport behaviors of teams were observed and recorded by the software Focus X2 (Elite Sport Analysis, Delgaty Bay, Scotland). he software can record the frequency of performances based on deined criteria. he com-mon soccer recoveries include: tackle, interception, goalkeeper save, set play, and turnover won across four ield zones (defensive, mid-defensive, mid-ofensive, and ofensive)9, over six 15-min periods covered the irst 15 min until the sixth 15-min periods recorded by the software. Computer keyboard was used to record the observations. his software is capable of repeating scenes and displaying slow motion. Observations were recorded by an expert specialized in observational analysis and familiar with the software. hereafter, the data were recorded and analyzed by Microsoft Excel 2010 and SPSS 19.
Statistical analysis
Descriptive statistics and contingency tables were employed in assessing the distribution of ball recovery over six-time intervals in the tournament and various zones. Teams performance consistency of ball recovery was examined over 15-min courses per match. Moreover, the performance in diferent zones was tested through χ2 independence, homogeneity and Kruskal-Wallis. he signiicance level was considered 0.05.
RESULTS
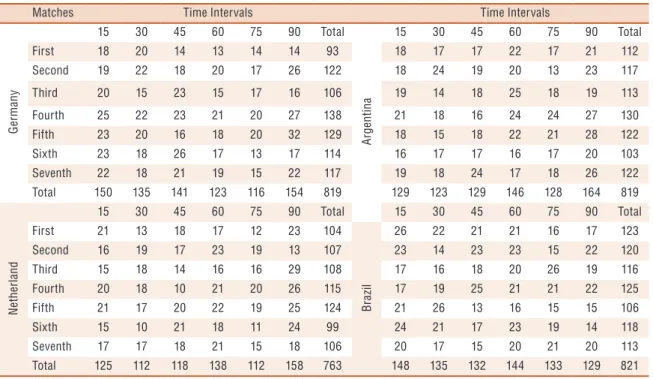
In all 28 matches, the successful World Cup teams recorded a total of 3222 ball recoveries, with Brazil recording 821 and the Netherlands 763. Table 1 illustrates the overall performance statistics of the teams during the 15-min periods of the matches throughout the tournament. he mean frequency of ball recovery within every 15-min in each four zones of Germany, Argentina, the Netherlands, and Brazil were 4.87, 4.87, 4.54, and 4.89, respectively.
Assuming the frequency of ball recovery as random, the Kruskal-Wallis test revealed that the concentration parameter of the four teams had no signiicant diference, that is, they had similar performance in terms of the frequency of ball recovery, hence, equally distributed for the four teams (χ2
3=1.597, p=0.66).
Ball Recovery Consistency Maleki et al.
distribution over 15-min periods and the irst and second halves of the matches. In other words, homogeneity of ball recovery distribution during the game relects the consistency of team performances (Table 2).
Table 1. Ball recovery of the four teams qualified at the World Cup semi-finals 2014 sorted by time and matches
Matches Time Intervals Time Intervals
G
er
many
15 30 45 60 75 90 Total
A
rg
ent
in
a
15 30 45 60 75 90 Total
First 18 20 14 13 14 14 93 18 17 17 22 17 21 112
Second 19 22 18 20 17 26 122 18 24 19 20 13 23 117
Third 20 15 23 15 17 16 106 19 14 18 25 18 19 113
Fourth 25 22 23 21 20 27 138 21 18 16 24 24 27 130
Fifth 23 20 16 18 20 32 129 18 15 18 22 21 28 122
Sixth 23 18 26 17 13 17 114 16 17 17 16 17 20 103
Seventh 22 18 21 19 15 22 117 19 18 24 17 18 26 122
Total 150 135 141 123 116 154 819 129 123 129 146 128 164 819
N
et
h
er
la
n
d
15 30 45 60 75 90 Total 15 30 45 60 75 90 Total
First 21 13 18 17 12 23 104
Br
az
il
26 22 21 21 16 17 123
Second 16 19 17 23 19 13 107 23 14 23 23 15 22 120
Third 15 18 14 16 16 29 108 17 16 18 20 26 19 116
Fourth 20 18 10 21 20 26 115 17 19 25 21 21 22 125
Fifth 21 17 20 22 19 25 124 21 26 13 16 15 15 106
Sixth 15 10 21 18 11 24 99 24 21 17 23 19 14 118
Seventh 17 17 18 21 15 18 106 20 17 15 20 21 20 113
Total 125 112 118 138 112 158 763 148 135 132 144 133 129 821
Table 2. Results of homogeneity test χ2 between the six time periods and match halves for the teams qualified at semi-finals of World Cup 2014
15 min. intervals1 Halves2
X2 p X2 p
Germany 15.83 0.98 5.74 0.45
Argentina 12.94 0.99 4.35 0.63
Netherland 23.01 0.81 2.42 0.88
Brazil 22.81 0.82 6.34 0.38
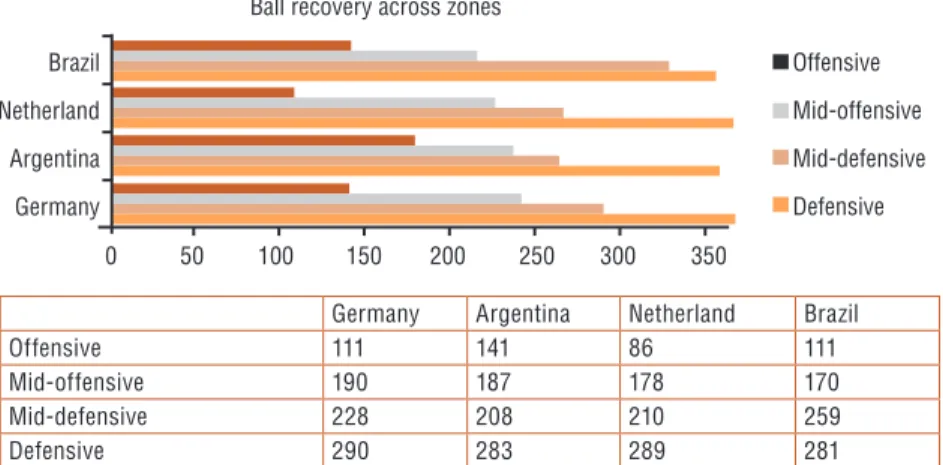
An examination of where ball recoveries occurred at the World Cup 2014, revealed that most performances belonged to the defensive and mid-defensive zones (Figure 1).
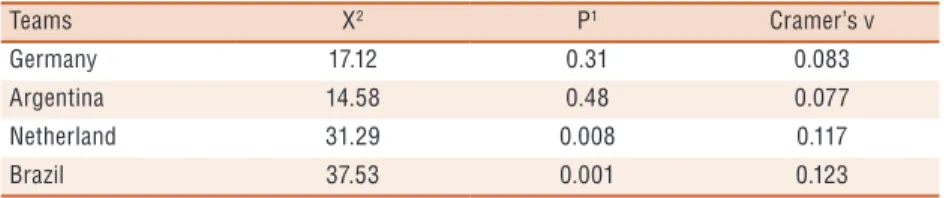
In examining the relationship between zone and ball recovery time, Chi-Square test for independence revealed that the two variables in the Netherlands and Brazil were statistically correlated (χ2
15=31.29, p =0.008 and χ2
Teams X P Cramer’s v
Germany 17.12 0.31 0.083
Argentina 14.58 0.48 0.077
Netherland 31.29 0.008 0.117
Brazil 37.53 0.001 0.123
Table 4. Ball recovery of the teams qualified at the World Cup semi-finals 2014 in field zones
Teams Time Intervals Total
15 Min 30 Min 45 Min 60 Min 75 Min 90 Min
G
er
many Zone
Defensive Count 45 41 48 52 46 58 290
Expected Count 53.1 47.8 49.9 43.6 41.1 54.5 290.0
Mid-defensive Count 45 48 38 26 29 42 228
Expected Count 41.8 37.6 39.3 34.2 32.3 42.9 228.0
Mid-offensive Count 35 34 34 29 29 29 190
Expected Count 34.8 31.3 32.7 28.5 26.9 35.7 190.0
Offensive Count 25 12 21 16 12 25 111
Expected Count 20.3 18.3 19.1 16.7 15.7 20.9 111.0
Total Count 150 135 141 123 116 154 819
A
rg
ent
in
a
Zone
Defensive Count 41 39 44 45 47 67 283
Expected Count 44.6 42.5 44.6 50.4 44.2 56.7 283.0
Mid-defensive Count 36 38 35 37 24 38 208
Expected Count 32.8 31.2 32.8 37.1 32.5 41.7 208.0
Mid-offensive Count 36 23 26 37 31 34 187
Expected Count 29.5 28.1 29.5 33.3 29.2 37.4 187.0
Offensive Count 16 23 24 27 26 25 141
Expected Count 22.2 21.2 22.2 25.1 22.0 28.2 141.0
Total Count 129 123 129 146 128 164 819
N
et
h
er
la
n
d
Zone
Defensive Count 58 44 42 48 41 56 289
Expected Count 47.3 42.4 44.7 52.3 42.4 59.8 289.0
Mid-defensive Count 30 42 30 33 30 45 210
Expected Count 34.4 30.8 32.5 38.0 30.8 43.5 210.0
Mid-offensive Count 30 21 31 43 21 32 178
Expected Count 29.2 26.1 27.5 32.2 26.1 36.9 178.0
Offensive Count 7 5 15 14 20 25 86
Expected Count 14.1 12.6 13.3 15.6 12.6 17.8 86.0
Total Count 125 112 118 138 112 158 763
Br
az
il
Zone
Defensive Count 39 35 48 42 54 63 281
Expected Count 50.7 46.2 45.2 49.3 45.5 44.2 281.0
Mid-defensive Count 60 44 31 48 36 40 259
Expected Count 46.7 42.6 41.6 45.4 42.0 40.7 259.0
Mid-offensive Count 29 36 29 35 27 14 170
Expected Count 30.6 28.0 27.3 29.8 27.5 26.7 170.0
Offensive Count 20 20 24 19 16 12 111
Expected Count 20.0 18.3 17.8 19.5 18.0 17.4 111.0
Ball Recovery Consistency Maleki et al.
Figure 1. Distribution of ball recovery in field zones
DISCUSSION
he primary objective of this study was to identify the patterns of ball re-covery adopted by successful teams at 2014 World Cup. In fact, this study sought to detect the performance consistency of ball recovery in world elite soccer teams and introduce it as an indicator of the team success. To this end, the ball recovery frequency of each team was assessed over the 15-min courses in diferent ield zones. Given that four teams of Germany, Argentina, the Netherlands, and Brazil had equal greatest frequency of matches, it was impractical to compare them with other teams. Hence, the performances of the four teams were evaluated as successful performances.
Results showed that the ball recovery performances of teams at semi-inals of the World Cup 2014 over the 15-min course as well as the irst and second halves in individual games and the whole competition were not signiicantly diferent. Furthermore, performance of the four teams in terms of ball recovery was equal (χ2
3=1.597, p=0.66). hese indings are consist-ent with those on the success of teams at the World Cup 20104. hey also observed that the frequency of attacks carried out by teams in each match and the entire tournament was not signiicantly diferent, indicative of the consistency of team performance. In other words, the successful teams, regardless of the earned rank, maintained a stable rate of ball possession, which can be an indicator of success. In examining the soccer teams in Euro 2012, in which the inalists (Spain and Italy) had the greatest performance consistency during the tournament in the goal, defensive, and ofensive related indicators15, it was concluded that teams’ success in international soccer depends on the consistency and stability of high-level performance, rather than good performance in one or more individual games. Analyzing the scored goals at three World Cups 1998, 2002, and 2006, revealed that in the 1998 and 2002 World Cups, most goals were scored in the second half, however, in FIFA 2006, there was no signiicant diference between the two halves21. Although this study did not focus on the scored goals, the comparison with the three World Cups revealed that coaches had found out, throughout the development of soccer, that the success of the sports
Germany Argentina Netherland Brazil
Offensive 111 141 86 111
Mid-offensive 190 187 178 170
Mid-defensive 228 208 210 259
be no diference between the irst and second halves. Coaches believe that ball recovery methods and strategies as connectors between the three most important moments of defense, transition, and ofense are the most devel-oped aspects of modern soccer24. Hence, maintaining the rhythm and low of such behavior would help the team dominate the match.
Distribution and positioning of the players on the ield is a key perfor-mance indicator to assess the tactical behavior25. his refers to the principle of space distribution26,27 where the zone covered by each player in the length and width of the ield can provide useful information on strategic decision making. Stability and consistency of ball recovery performance in the successful FIFA 2014 teams during various stages of the tournament and match time periods are associated with the arrangement of players by the coach and their space distribution. It is recommended that future stud-ies focus on the relationship between space distribution and ball recovery performance factors in successful and unsuccessful teams.
When the assumption of independence between time periods and ield zones was evaluated, the results for the Netherlands and Brazil were sig-niicant (X2
15=31.29, p=0.008, Cramer’s V=0.117 andX215=37.53, p=0.001, Cramer’s V=0.123, respectively). his means that certain times of the games played by the two teams involved more ball recovery and occurred in one zone as compared to others, suggesting that ball recovery of the two teams in diferent ield zones over the match time was not consistent and stable. Both teams had the weakest ball recovery performance in the ofensive zone, although the Netherlands had theirs in the irst and second 15-min periods (irst half) while that of Brazil was in the ifth and sixth 15-min periods (second half) (Table 4). Although all four teams in the semi-inals of the FIFA 2014 tournament showed stability and consistency of performance in whole competitions, the separation of team performance in diferent zones revealed that the ball recovery performance of the Netherlands and Brazil in the ofensive zone was weaker than other teams, indicating an imbalance in the team power in four zones of the ield. Although this study overlooked the efect of factors such as opponent quality and competition stage4, it appears that lack of equal distribution of elite players in diferent positions in Netherlands and Brazil teams, due to diference in itness level and technical readiness of players23,24, led to lack of integrative occurrence of the ball recovery and transition process of defense to ofense over time. In conirmation of this, researchers observed that, regarding the failure of teams that could not qualify for the inal of EURO 2012, other teams compared with the inalists Spain and Italy performed poorly and incon-sistently with respect to the ofensive and defensive indicators15.
Ball Recovery Consistency Maleki et al.
is initially designed at the midield and defensive lines, where the ofense can be supported by an actively defensive organization26. According to the concentration principle27, when the team is in search of ball recovery, it actually falls in the defensive phase. In such a situation, the teammates pull together and protect the midield zone. Hence, the main objective of any defensive action is to reduce the instability of the team in the key and sensitive zones28. In other words, there should be a greater degree of ball recovery performance in the midield zone. hus, awareness of where the most efective ball recovery occurs in the ield plays an important role in understanding the patterns of ofense and improving the coach training sessions. A review of the World Cup 199829 and the top teams in Europe30, revealed that most ball recoveries leading to goal chances were initiated from the ofensive zone. his contradiction may be due to diferences in the ability and tactics of teams in diferent tournaments.
CONCLUSIONS
he present study thus showed that consistency of ball recovery perfor-mance during time periods of a match and the whole tournament is one of the indicators of success in the World Cup teams. However, this factor can guarantee team success only when it is distributed across the entire ield zones. his requires space distribution of experienced players on the ield, leading to balance of power in all zones so as to redesign an ofense. Following the concentration principle and designing of attacks from the midield zones helps to improve the soccer team productivity. Overall, this study revealed that performance consistency in soccer teams can be an ideal factor that diferentiates successful teams.
REFERENCES
1. Pratas J, Volossovitch A, Ferreira A. he efect of situational variables on teams’ performance in ofensive. Open Sport Sci J 2012;5:193-99.
2. Lago C. he inluence of match location, quality of opposition, and match status on possession strategies. J Sports Sci 2009;27(13):1463-69.
3. Lago C, Martín R. Determinants of possession of the ball in soccer. J Sport Sci 2007;25(9):969-74.
4. Barreira D, Garganta J, Guimaraes P, Machado J, Anguera M. Ball recovery patterns as a performance indicator in elite soccer. J Sports Engineering and Technology 2014; 228(1):61-72.
5. Ruiz-Ruiz C, Fradua L, Fernández-García A, Zubillaga A. Analysis of en-tries into the penalty area as a performance indicator in soccer. Eur J Sport Sci 2013;13(3):241-48.
6. Castelo J. Futebol: a organizaca˜o do jogo. Lisboa: Edicao do autor; 1996.
7. Grant A, Reilly T, Williams M, Borrie A. Analysis of the Goals Scored in the 1998 World Cup. Insight 1998;2(1):17-20.
8. Carling C, Williams M, Reilly T. Handbook of soccer match analysis. London: Routledge; 2005.
9. Almeida C, Ferreira A,Volossovitch A. Efects of Match Location, Match Status and Quality of opposition on regaining possession in UEFA champions ligue. J Human Kinet 2014;41:203-14.
CORRESPONDING AUTHOR
Mohammad Maleki, No. 110, Humanities Faculty, University of Kurdistan, Sanandaj, Iran.
E-mail: [email protected]
ational variables on achieving score-box possessions in a professional soccer team. J Sport Sci 2012;30(14):1455-61.
13. Tenga A, Holme I, Ronglan L, Bahr R. Efect of playing tactics on goal scoring in Norwegian professional soccer. J Sport Sci 2010;28(3):237-44.
14. Camerino O, Chaverri J, Anguera M, Jonsson G. Dynamics of the game in soccer: Detection of T-patterns. Euro J Sport Sci 2012;12(3):216-24.
15. Shaizadeh M, Taylor M, Lago Penas C. Performance Consistency of International Soccer Teams in Euro 2012: a Time Series Analysis. J Hum Kinet 2013;38:169-77.
16. Castellano J, Casamichana D, Lago-Penas C. he use of match statistics that discriminate between successful and unsuccessful soccer teams. J Human Kinet 2012;31:139-47.
17. Lago-Penas C, Lago-Ballesteros J, Dellal A, Gomez M. Game-related statistics that discriminated winning, drawing and losing teams from the Spanish soccer league. J Sport Sci Med 2010;9:288-93.
18. Taylor J, Mellalieu S, James N, Shearer D. he inluence of match location, quality of opposition, and match status on technical performance in professional association football. J Sport Sci 2008;26(9):885-95.
19. Gómez M., Gómez-Lopez M, Lago C, Sampaio J. Efects of game location and inal outcome on game related statistics in each zone of the pitch in professional football. Eur J Sport Sci 2012;12(5):393-98.
20. Hughes M, Franks I. Notational Analysis of Sport: Systems for better coaching and performance in sport. London: Routledge; 2004.
21. Armatas Y, Yiannakos A, Sileloglou P. Relationship between time and goal scoring in soccer games: Analysis of three world cups. Int J Perform Anal Sport 2007;7:48-58.
22. Mohr M, Krustrup P, Bangsbo J. Match performance of high-standard soccer players with special reference to development of fatigue. J Sports Sci 2003;21:519-28.
23. Sarmento H, Anguera M, Pereira A, Marques A, Campaniço J, Leitão J. Patterns of Play in the Counterattack of Elite Football Teams - A Mixed Method Approach. Int J Perform Anal Sport 2014;14:411-27.
24. Kannekens R, Elferink-Gemser M, Visscher C. Positioning and deciding: key fac-tors for talent development in soccer. Scan J Med and Sci Spor 2011;21(6):846-52.
25. Folgado H, Lemmink K, Frencken W, Sampaio J. Length, width and centroid distance as measures of teams tactical performance in youth football. Eur J Sport Sci 2014;14(1):S487-S492.
26. Garganta J. Tactical modelling in Soccer: a critical view. In: Hughes M, Tavares F, editors. Proceeding of IV World Congress of Notational Analysis of Sport. Faculdade de Desporto da Universidade do Porto; 2001.
27. Costa I, Garganta J, Greco P, Mesquita I, Seabra A. Inluence of Relative Age Efects and Quality of Tactical Behaviour in the Performance of Youth Football Players. Int J Perform Anal Sport 2010;10(2):82-97.
28. Bangsbo J, Peitersen B. Defensive Soccer Tactics: How to Stop Players and Teams from Scoring. Champaign: Human Kinetics; 2002.
29. Kirkendall D, Dowd W, DiCicco T. Patterns of successful attacks: a com-parison of men’s and women’s games in World Cups. Revista de Fútbol y Ciencia 2002;1(1):29-36.