273
Re
vie
w
Art
icl
es
Risk of death in elderly persons based on the frailty phenotype and
the frailty index: a review study
Alexandre Alves Pereira1 Flávia Silva Arbex Borim1 Anita Liberalesso Neri1
1 Universidade Estadual de Campinas, Faculdade de Ciências Médicas, Programa de Pós-Graduação em
Gerontologia. Campinas, SP, Brasil.
Correspondence Alexandre Alves Pereira
E-mail: [email protected]
Abstract
Objective: to systematize studies evaluating the relationship between frailty and mortality in community-dwelling elderly persons. Method: Frailty was defined according to the frailty phenotype proposed by Fried et al. and the frailty index described by Rockwood et al. The study included epidemiologic population-based studies, cohort surveys, systematic reviews and meta-analyses published in English between 2006 and March 2016 based on the use of the terms: “frail elderly” and “mortality”. Only study samples that exclusively comprised adults 65 years old or older who lived in the community were included. Studies investigating hospitalized and institutionalized elderly persons, and those examining the relationship between frailty and mortality through a disease-specific target were excluded. Results: a total of 244 studies were identified, of which 17 met the inclusion criteria. Thirteen studies used the frailty phenotype and four studies used the frailty index. Conclusion: both assessment measures found that frail elderly persons have a higher risk of death than robust elderly persons.
Keywords: Frail Elderly. Mortality. Review.
Rev. Bras. Geriatr. Gerontol., Rio de Janeiro, 2017; 20(2): 273-285
274
INtRoductIoN
Frailty is defined as a biological state of increased vulnerability to internal and environmental stressors, due to the loss of functional reserves associated with aging1,2. Although it is a relatively recent concept,
it has been widely discussed in Geriatrics and Gerontology in an attempt to obtain consensus on an operational definition, which may be useful for making valid predictions regarding the condition of the elderly population and the implementation of specific health care programs for this growing age category. The focus is on defining the phenomenon and establishing simple and valid measures to allow the early identification of the syndrome and the use of effective prevention and rehabilitation measures3-6.
The first discussions about the concept of frailty occurred in the 1980s and associated the condition with the decline of physiological functions, disability, the presence of multiple diseases and death, but did not necessarily relate it to aging7,8.
In 1991, Winograd e et al.9 published the results
of a cohort study involving 985 elderly people, investigating the relationship between adverse health outcomes and the presence of the so-called geriatric syndromes (disability, incontinence, postural instability, iatrogenesis and social isolation). The authors classified the elderly without functional loss as non-frail; those with chronic disabling diseases, depression, falls, immobility, incontinence, malnutrition, polypharmacy or sensory losses as frail, and the terminally ill or those with dementia as severely disabled. A survival analysis applied to the sample showed that those with the highest risk of death were the severely disabled and the frail.
Today, the models of frailty most used in the literature are accumulated deficit10,11 and the frailty
phenotype12,13. The phenotype model defines
frailty as a clinical syndrome resulting from the functional decline of the physiological systems associated with aging. The main changes underlying the syndrome are neuromuscular disorders, mainly sarcopenia; dysfunction of the immune system and neuroendocrine dysregulation.
The frailty phenotype developed by Fried et al.12
is operationalized by five criteria: a) unintentional weight loss; greater than 4.5 kg or over 5% of body weight in the last year; b) self-reported fatigue; c)
reduction of hand grip strength, measured with a dynamometer and adjusted for gender and body mass index (BMI); d) low level of physical activity measured by weekly energy expenditure in kcal (based on self-reports of domestic activities and physical exercises performed), adjusted according to gender; e) low gait speed indicated by the time in seconds that the elderly person takes to travel a distance of 4.5 m in a straight line with usual gait, adjusted for gender and height. Elderly persons with three or more components of the phenotype are considered frail, and those with one or two components are classified as pre-frail12.
The accumulated deficit model is not based on a specific set of signs and symptoms present in old age, but on the cumulative effect of age-related disorders. To characterize frailty, an index was created that represents the sum of the individual deficits present at the moment of the evaluation divided by the number of deficits considered in the protocol. The frailty index is based on the quantification of changes observed in a variety of physiological, psychological and functional conditions among the elderly, and in the search for relationships between these and adverse outcomes. The levels of frailty are expressed on a continuous scale ranging from zero to one11,13-15.
Today, the concept of frailty is consensual among researchers2. However, the same cannot be said for
the evaluation criteria4. In recent years researchers
have investigated the accuracy of frailty measures for the prediction of adverse health events. The validity and reliability of frailty measures is one of the aspects still being debated in literature. Malmstrom et al.16
compared four models, FRAIL17, SOF18, the frailty
phenotype12 and the frailty index14. The parameters
were disabilities for instrumental and basic activities of daily living (IADL and BADL) and mortality, both measured over 3 and 9 years. The FRAIL, SOF, frailty phenotype and frailty index models were more effective in predicting the incidence of disability at 3 and 9 years; while the FRAIL models and the frailty index were better predictors of mortality at 9 years. In the Korean Longitudinal Study of Aging (KLoSHA)19 three measures of frailty were
compared: the KLoSHA model developed for the study, the SOF18 and the frailty phenotype. The SOF
Frailty and mortality in older adults
275 at 15.6%. The KLoSHA model was more effective
at predicting mortality and disability than the frailty phenotype; and the KLoSHA model and the phenotype were better predictors of hospitalization than the SOF. In the systematic review study carried out by Sternberg et al.20, the main outcomes related
to frailty described in literature are mortality (13.8%), functional disability in activities of daily living (7.4%) and institutionalization (6.2%). The frailty phenotype and frailty index measures exhibited moderate correlation (r=0.65)14.
Frailty assessment measures are important tools for distinguishing individuals who are most vulnerable to adverse health events. From this perspective, the present study aimed to present the results of a literature review on the relationship between frailty and mortality in elderly residents living in the community based on the operational models of the frailty phenotype and the frailty index.
MethodS
A bibliographic review was carried out to identify articles published in the English language indexed with the descriptors "frail elderly" and "mortality". The PubMed and Scielo databases were consulted. The period of data collection and analysis was from April to July 2016. All abstracts were read, and when necessary, the full articles were identified from the descriptors. The inclusion criteria were: articles published from 2006 to March 2016; complete articles;
population-based studies; longitudinal studies; systematic reviews and meta-analyzes; studies with elderly individuals aged 65 years or older resident in the community. Studies that included institutionalized and hospitalized elderly persons, as well as those with the objective of evaluating the relationship between frailty and mortality for specific diseases (example: kidney failure, heart disease) were excluded. The PRISMA Guidelines (Preferred Reporting Items for Systematic Reviews and Meta-Analyses) were followed for this review study.
ReSuLtS
A total of 244 articles were initially identified, of which 17 were evaluated as they fulfilled the inclusion criteria (Figure 1). Sixteen articles corresponded to population-based longitudinal studies18,21-35. Of
these studies, one was a review and meta-analysis36.
Thirteen studies used the frailty phenotype as an operational model18,21-26,30-34,36 and four used the
frailty index27-29,35. In studies that used the frailty
phenotype the samples ranged from 654 to 6724 individuals. Two studies included only women18,23,
two included only men21,25 and the others had samples
composed of both genders. Two studies based on the phenotype stratified the samples by gender26,34 and
two stratified them by age18,21. The sample sizes for
the studies that used the frailty index ranged from 1016 to 4082 individuals. One of the studies was composed only of men35 and the others contained
men and women (Table 1).
Re
v. B
ras
. G
eri
at
r. G
ero
nt
ol.,
Rio
de
Jane
iro
, 2
01
7; 2
0(2
): 2
73
-2
85
27
6
Table 1. Characteristics of 17 studies published between 2006 and 2016 relating to the relationship between frailty and mortality in community-dwelling elderly persons using the frailty index and frailty phenotype measures. São Paulo, 2016.
Author (year)/ country
Study Sample
(deaths)
Gender Age Follow-up period Frailty measure
Relative risk (95% CI) Control variables
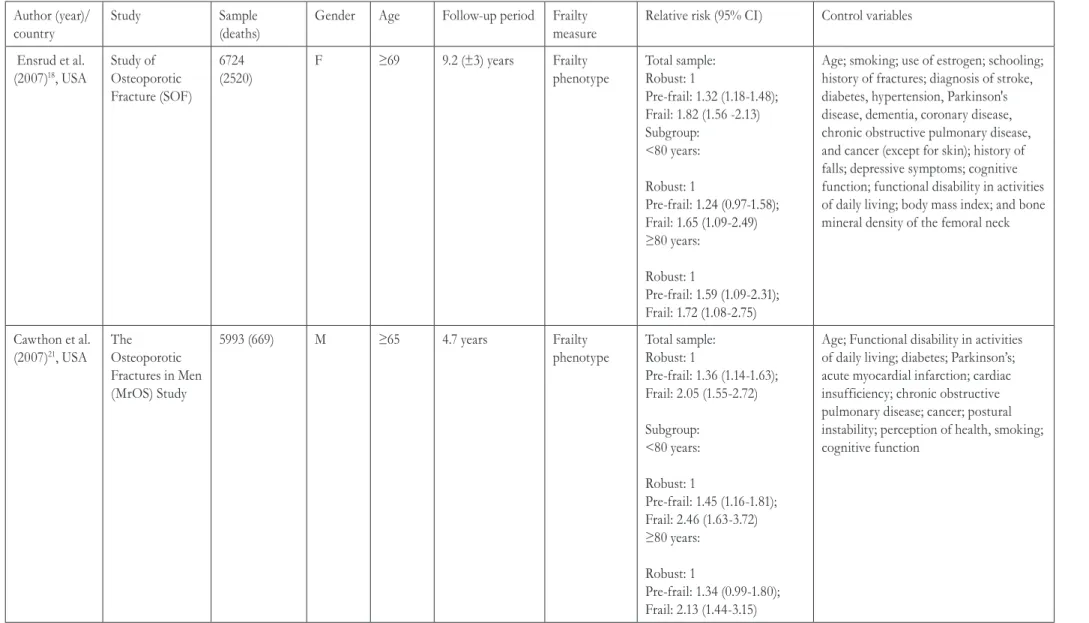
Ensrud et al. (2007)18, USA
Study of Osteoporotic Fracture (SOF)
6724 (2520)
F ≥69 9.2 (±3) years Frailty
phenotype
Total sample: Robust: 1
Pre-frail: 1.32 (1.18-1.48); Frail: 1.82 (1.56 -2.13) Subgroup:
<80 years:
Robust: 1
Pre-frail: 1.24 (0.97-1.58);
Frail: 1.65 (1.09-2.49)
≥80 years:
Robust: 1
Pre-frail: 1.59 (1.09-2.31);
Frail: 1.72 (1.08-2.75)
Age; smoking; use of estrogen; schooling; history of fractures; diagnosis of stroke, diabetes, hypertension, Parkinson's disease, dementia, coronary disease, chronic obstructive pulmonary disease, and cancer (except for skin); history of falls; depressive symptoms; cognitive function; functional disability in activities of daily living; body mass index; and bone mineral density of the femoral neck
Cawthon et al. (2007)21, USA
The Osteoporotic Fractures in Men (MrOS) Study
5993 (669) M ≥65 4.7 years Frailty
phenotype
Total sample: Robust: 1
Pre-frail: 1.36 (1.14-1.63); Frail: 2.05 (1.55-2.72)
Subgroup: <80 years:
Robust: 1
Pre-frail: 1.45 (1.16-1.81); Frail: 2.46 (1.63-3.72) ≥80 years:
Robust: 1
Pre-frail: 1.34 (0.99-1.80); Frail: 2.13 (1.44-3.15)
Age; Functional disability in activities of daily living; diabetes; Parkinson’s; acute myocardial infarction; cardiac insufficiency; chronic obstructive pulmonary disease; cancer; postural instability; perception of health, smoking; cognitive function
Fra
ilty
an
d
m
ort
al
ity
in
old
er
ad
ult
s
27
7
Author (year)/ country
Study Sample
(deaths)
Gender Age Follow-up period Frailty measure
Relative risk (95% CI) Control variables
Avila-Funes et al. (2008)22,
France
The Three-City Study
6078 (316) M/F ≥65 4 years Frailty
phenotype
Robust: 1
Pre-frail: 1.14 (0.98-1.31); Frail: 1.36 (1.01-1.81)
Gender; schooling; income, smoking; alcoholism; number of chronic diseases; perception of health; CES-D (Center for Epidemiologic Studies-Depression scale) score; MMSE score; disability in basic and instrumental activities of daily living and mobility
Ensrud et al. (2008)23, USA
Study of Osteoporotic Fracture (SOF)
6701 (2751) F ≥69 9.6 years Frailty
phenotype
Robust: 1
Pre-frail: 1.54 (1.40-1.69); Frail: 2.75 (2.46-3.07)
Age
Graham et al. (2009)24, USA
Hispanic Established Populations Epidemiologic Studies
1996 (892) M/F ≥65 10 years Frailty
phenotype
Robust: 1
Pre-frail: 1.25 (1.0-7-1.46); Frail: 1.81 (1.41-2.31)
Age; Gender; marital status; body mass index; smoking; heart attack; stroke; hypertension; cancer; hip fracture; disability in basic and instrumental activities of daily living; cognitive function; depressive symptoms and perception of health
Ensrud et al. (2009)25, USA
The Osteoporotic Fractures in Men (MrOS) Study
3132 (204) M ≥67 3.2 (±0.5) years Frailty
phenotype
Robust: 1
Pre-frail: 1.77 (1.17–2.68); Frail: 3.51 (2.21–5.57)
Age
Berges et al. (2009)26, USA
Hispanic Established Populations Epidemiologic Studies
1996 (892) M/F ≥65 10 years Frailty
phenotype
Men:
Robust: 1
Pre-frail: 1.46 (1.17-1.83); Frail: 3.04 (2.16-4.28)
Women: Robust: 1
Pre-frail: 1.29 (1.05-1.60); Frail: 1.92 (1.39-2.65)
Age; Gender; marital status; body mass index; smoking; heart attack; stroke; hypertension; cancer; hip fracture; diabetes
Re
v. B
ras
. G
eri
at
r. G
ero
nt
ol.,
Rio
de
Jane
iro
, 2
01
7; 2
0(2
): 2
73
-2
85
27
8
Author (year)/ country
Study Sample
(deaths)
Gender Age Follow-up period Frailty measure
Relative risk (95% CI) Control variables
García-Gonzalez et al. (2009)27,
Mexico
The Mexican Health and Aging Study
4082 (279) M/F ≥65 710 (±111) days Frailty Index FI = 0-0.07: 1
FI = 0.07-0.14: 0.93 (0.58-1.50)
FI = 0.14-0.21: 1.56 (1.00-2.44)
FI = 0.21-0.35: 2.20 (1.42-3.41)
FI >0.35: 6.45 (4.10-10.14)
Age; Gender
Lucicesare et al. (2010)28,
Italy
The Conselice Study of Brain Ageing
1016 M/F ≥65 4 years Frailty Index
Frail (FI≥0.25): 5.26 (1.05-26.42)
Age; Gender; Conselice Study of Brain Aging Score
Song et al. (2010)29,
Canada
Canadian National Population Health Survey
2740 (1208) M/F ≥65 10 years Frailty Index FI≤0.08: 1
FI≥0.25: 1.57 (1.41-1.74) Age; Gender
Masel et al. (2010)30, USA
Hispanic Established Populations Epidemiologic Studies
1008 (176) M/F ≥74 2 years Frailty
phenotype
Robust: 1
Pre-frail: 0.74 (0.42-1.32); Frail: 2.72 (1.45-5.08)
Age; Gender; schooling; marital status; income; chronic diseases; smoking; body mass index
Jacobs et al. (2011)31, Israel
Jerusalem Longitudinal cohort study
840 (194) M/F ≥85 5 years Frailty
phenotype
Robust: 1
Pre-frail: 1.01 (0.64-1.59); Frail: 1.67 (0.96-2.09)
Gender; schooling; MMSE score; smoking; diabetes; hypertension; cardiac disease; poor perception of health; disability in basic activities of daily living
Cano et al. (2012)32, USA
Hispanic Established Populations Epidemiologic Studies
1815 (690) M/F ≥67 10 years Frailty
phenotype
Robust: 1
Pre-frail: 1.39 (1.17-1.64); Frail: 1.97 (1.53-2.55)
Age; gender; schooling; marital status; diabetes; myocardial infarction; stroke; cancer; hip fraction; hypertension; arthritis
Fra
ilty
an
d
m
ort
al
ity
in
old
er
ad
ult
s
27
9
Author (year)/ country
Study Sample
(deaths)
Gender Age Follow-up period Frailty measure
Relative risk (95% CI) Control variables
Abizanda et al. (2013)33,
Spain
FRADEA 993 (105) M/F >70 5 years Frailty
phenotype
Robust: 1
Pre-frail: 3.4 (1.0–12.8); Frail: 5.5 (1.5-20.2)
Age; Gender; Barthel index; Chalson index
Kumala et al. (2014)34,
Finland
Geriatric Multidisciplinary Strategy for the Good Care of the Elderly
654 (173) M/F ≥75 4 years Frailty
phenotype
Total sample:
Robust: 1
Pre-frail: 1.3 (0.8-2.0); Frail: 2.7 (1.6-4.5)
Subgroup: Men Robust: 1
Pre-frail: 1.4 (0.7-3.0); Frail: 2.4 (1.0-5.9)
Women: Robust: 1
Pre-frail: 1.1 (0.6-1.8); Frail: 2.8 (1.5-5.3)
Age; groups (intervention v control); schooling; smoking; comorbidity index; functional capacity (Barthel index); number of medications
Chang et al. (2015)36,
Taiwan
Meta-analysis 35538 (7994) M/F ≥65 6.5 (±3.05) years Frailty phenotype
Robust: 1
Pre-frail: 1.33 (1.26-1.41); Frail: 2.00 (1.72-2.31)
Armstrong et al. (2015)35,
USA
The Honolulu-Asia Aging Study
3801 (3455) M ≥71 5 years Frailty Index FI≤0.05: 1
FI=0.05-0.15: 1.61 (1.36-1.91) FI=0.15-0.25: 3.24 (2.69-3.91) FI=0.25-0.35: 4.68 (3.80-5.76) FI=0.35-0.50: 5.81 (4.76-7.09) FI>0.50: 6.38 (5.29-7.69)
Age
Rev. Bras. Geriatr. Gerontol., Rio de Janeiro, 2017; 20(2): 273-285
280
dIScuSSIoN
Most of the studies selected for this review used the Fried frailty phenotype measure as an operational criterion. This confirms the survey conducted by Bouillon et al.13, who carried out a review study of
articles indexed in Medline under the term frailty, published between 1948 and 2011. Of a universe of 448 articles identified by the authors, studies related to the derivation of evidence of reliability and validity for frailty measurements were selected. In a universe of 150 articles that fulfilled this criterion, 69% used the frailty phenotype model of Fried et al.12, 12% used
the frailty index11 and 19% adopted the remaining
25 instruments. The two frailty measures were the only ones that had their criteria validated in more than three samples, in addition to the participants of the original studies.
Frail elderly persons had worse survival rates than the robust elderly. According to Shamlyian et al.37, the increase in relative risk for mortality
in the frail elderly is 50% based on the frailty phenotype, and 15% according to the cumulative deficit model. The risk rises according to the number of criteria of the frailty phenotype and the number of accumulated deficits. However, in some studies that used the frailty phenotype, no relationship was found between the pre-frailty condition and mortality22,31,34. Different environmental contexts
can influence health variability and outcomes in the elderly population.
In a study by Avila-Funes et al.22 there was a higher
prevalence of older women, with a greater number of chronic diseases, more depressive symptoms, worse health perception and lower MMSE scores among elderly persons classified as frail than among pre-frail and robust elderly individuals. The accumulated mortality in the four-year period was 11.5% for the frail, 5.5% for the pre-frail and 4.4% for the robust. In univariate analysis, the frail had a higher risk of death than robust individuals. However, when the analysis model was adjusted by sociodemographic variables, health conditions and functional capacity, the frailty phenotype measure lost statistical significance in the prediction of a risk of mortality (OR=1.14, 95% CI=0.98-1.31). There was no relationship between the pre-frailty and mortality condition in both models.
In the study by Kulmala et al.34 multivariate analysis
showed that the mortality risk estimate was positive only for the frail.
Similar results were found in the Jerusalem Longitudinal Cohort Study. Jacobs et al.31 evaluated
the impact of frailty and cognitive decline on the survival of 840 community dwelling individuals aged 85 years and over. The frail corresponded to 19.5% of the total sample, pre-frail individuals to 56%, and robust individuals to 24.5%. In five years, there were 194 deaths (23.4%). Mortality rates among the frail, pre-frail and robust elderly were 44.5%, 20.4%, and 13.6%, respectively. According to the Kaplan-Meier analysis, the survival curve was lower for the frail, regardless of cognitive status. In the gender-adjusted model, the risk for mortality was higher for both the frail (RR=4.52) and pre-frail (RR=1.63) than for the robust elderly. The risk for mortality remained only for the frail when socio-demographic variables, Mini Mental State Exam (MMSE) score, smoking, health conditions and functionality were added to the model.
Cano et al.32 evaluated a cohort sample of 1815
elderly people, aiming to investigate the relationship between frailty, cognitive decline and mortality. Three adjustment models were used in Cox regression analysis. In the first model, the elderly with cognitive decline had a 1.26 higher risk of death than those with preserved cognitive function, after adjusting for sociodemographic variables and health conditions. The next model showed that the frail and pre-frail had a higher risk for mortality than robust individuals (RR=2.03 and RR=1.40, respectively) after controlling for socio-demographic variables and health conditions. In the third model, in which cognitive decline and frailty were grouped, being frail and pre-frail remained a risk factor for mortality although the magnitude of the effect was lower (RR=1.97 and RR=1,39, respectively). No statistically significant associations were found between cognitive decline and frailty.
Frailty and mortality in older adults
281 were observed in the longitudinal study Hispanic
Established Populations Epidemiologic Studies (EPESE). According to the baseline classification of the study, in the robust elderly the survival rate was 73%, while 61% of pre-frail and 27% of frail individuals survived the 10-year follow-up period. In multivariate regression analysis, both pre-frail and frail individuals had a higher risk of death than robust individuals24.
Remaining with the EPESE, researchers investigated the effect of quality of life on the association between frailty phenotype and survival of the elderly. The study consisted of 1008 subjects, of whom 176 died within two years of baseline measurement. Compared to being robust, being frail increased the risk of mortality 2.7 times. When the items that make up the physical domain of the Medical Outcomes Study (MOS) Short Form-36 (SF-36) were added to the analysis model, the risk for mortality was reduced from 2.7 to 1.6. This difference was not found when the mental health components of the scale were added30.
In the meta-analysis of Chang and Lin36 both
frailty and pre-frailty were risk factors for mortality. The risk increased substantially as the elderly moved from the robust to the pre-frail category. The study by Fried et al.12 showed that the elderly classified as
frail by the indicators of the frailty phenotype had a greater number of chronic conditions, including cardiovascular diseases, pulmonary disease and diabetes, than robust individuals. Garcia-Garcia et al.38 observed a strong association between frailty
and cardiovascular diseases (coronary disease, stroke and peripheral arterial disease). These data suggest that frailty and comorbidities may have associated etiologies, exposing the individual to a condition of greater vulnerability to adverse health events.
Some of the studies selected for this review investigated the relationship between frailty and mortality, considering the gender variable. In the Study of Osteoporotic Fractures (SOF)18, 6724
elderly women were evaluated to investigate the predictive capacity of the frailty phenotype in relation to negative health events (recurrent falls, fractures and mortality). Mortality data was obtained through four-month consultations and confirmed by death certificates for approximately nine years. During this period there were 2520 deaths. Cox regression
analysis showed that the elderly women classified as pre-frail and frail had a 1.3 and 1.8 times greater risk of mortality, respectively, than women classified as robust.
Subsequently, the SOF23 researchers compared the frailty phenotype with the SOF index, which characterizes frailty by the presence of two or more of the following: unintentional weight loss equal to or greater than 5% of body weight in the previous year; inability to stand up from a chair five times without using arms for support, and fatigue assessed by a depression screening scale, indicated by the statement that on three or more days in the previous week the elderly had difficulty with or failed to perform their usual tasks. Compared to the non-frail elderly, women defined as frail by the phenotype had a 2.37 times greater risk of mortality, while pre-frail women had a 1.44 greater risk. Both models were sensitive for the detection of vulnerability to adverse health events.
In the Osteoporotic Fractures in Men Study, one of the objectives of Cawthon et al.21 was to validate
the frailty phenotype measurement for the prediction of mortality in a sample composed of American men aged 65 years and over. At baseline, 56% of the participants were classified as robust; 40% as pre-frail and 4% as frail. In multivariate analysis, the risk of death of frail elderly persons was twice as high as in robust individuals. Pre-frail individuals had a 36% higher risk of death than robust elderly men. In comparative analysis with the SOF index, the use of the indicators of the frailty phenotype resulted in a three times greater risk of death for frail men than non-frail men25.
In the Geriatric Multidisciplinary Strategy for the Good Care of the Elderly(GeMS)34 the objectives
Rev. Bras. Geriatr. Gerontol., Rio de Janeiro, 2017; 20(2): 273-285
282
survival analysis, cumulative mortality was higher at baseline for both men and women classified as frail than for pre-frail or robust individuals. Among pre-frail men, cumulative mortality was higher than among pre-frail women.
Also in the GeMS study34, regression analysis
showed that being frail at baseline increased the risk for mortality, both in the model adjusted for age and when the other control variables were included (sociodemographic, intervention versus control, smoking, comorbidities, number of medications, and functional capacity in basic and instrumental activities of daily living). The association was stronger for women, even after adjusting for the control variables. In pre-frail and frail men, the highest risk of death was observed only in the age-adjusted model. Two years later, the participants were submitted to a second evaluation stage. The authors observed that the change from robust to frail (RR=8.1, 95% CI 2.0-32.5), and from pre-frail to pre-frail (RR=3.6, 95% CI 1.4-9.1) resulted in an increased risk of mortality. In stratification by sex, the highest risk of death was observed in men who were robust at baseline and changed to frail within two years (RR=8.0; 95% CI 1.3-48.2); and for pre-frail men and women who changed to frail (Men: RR=6,1; 95% CI 1.6-23.7; Women: RR=4.2; 95% IC 1.3-13.1)34. In the study by Berges et al.26,
both frail men and frail women had a higher risk of death. However, this association was more robust in men than in women. Data from the survey by Chang and Lin36 suggest that the risk of death is higher for
men, both frail and pre-frail.
Only two studies based on the frailty phenotype stratified the samples by age, using the age of 80 as the cut-off point for analysis. The results showed that frail and pre-frail elderly in both age categories had a higher risk of death than robust individuals18,21.
For Chang and Lin36 further studies will be needed
to determine a cutoff point for age that separates elderly persons with a higher and lower risk of death.
Four studies evaluated the power of the frailty index to predict mortality. García-González et al.27
studied 34 variables related to signs, symptoms, diseases and disabilities in the construction of the index. The mean frailty index was 0.16±0.11 with a range from 0 to 0.65. In the period of 710 days there were 279 deaths among the 4082 elderly people
involved in the study. The risk for mortality was 2.2 times higher for elderly persons with scores between 0.21 and 0.35, and 6.4 times higher for those with scores above 0.35, compared to elderly persons with lower scores in the frailty index. For men, the risk of death was higher among those who scored above 0.21. For women, the risk was higher among those who scored above 0.35. The increase in age corresponded to a 5% increase in the risk of death.
Lucicesare et al.28 compared the validity of the
frailty index described by Rockwood et al.14 and the
score used in The Conselice Study of Brain Aging (CSBA), which consists of seven variables (physical activity, instrumental activities of daily living, sensory deficits, gait and balance, calf circumference, and perception of health). A total of 43 variables were used to make up the frailty index, with a cutoff point >0.25. In the multivariate regression analysis the frailty index of Rockwood et al.14 was a more robust
predictor of mortality than the frailty score used in the CSBA, irrespective of gender and age.
The study by Song et al.29 also used the accumulated
deficit model as an operational measure of frailty. The authors evaluated the prevalence of frailty and the validity of the measure in the prediction of negative health events. The survey involved 2740 elderly Canadians who were monitored for 10 years. The mean values of the frailty index were 0.004 (±0.003) for robust elderly persons (FI<0.08), 0.156 (±0.004) for the pre-frail (0.08-0.24), and 0.310 (±0.008) for
elderly persons classified as frail (≥0.25)]. The mean
value of the frailty index was higher among elderly persons who died (0.195±0.135) than in the survivors (0.119±0.102). The probability of survival of the frail elderly was 27% versus 70% of those considered robust at the baseline of the study. The analysis of the area under the curve (AUC) in the time period showed high specificity of this measure for the prediction of mortality in 10 years.
Frailty and mortality in older adults
283 of the final stage was 90.9 years. The accumulated
mortality in 20 years was 90.9% over the total sample. Higher frailty index values resulted in a lower survival rate. Over the five-year period the relative risk for mortality in the group composed of the frailest elderly persons was six times higher than among robust elderly individuals. Age also accounted for the increased risk for mortality in this sample. Older people aged 80 years of age and with a frailty index between 0.35 and 0.50 were associated with a risk of death three times greater than those aged 70 years with scores <0.0535.
In this bibliographic review no complementary searches were carried out on the selected articles with the aim of tracking references that could add to the scientific evidence gathered. Only English studies were selected. Data collection was based on PRISMA guidelines for bibliographic review studies. However, the present study was limited to presenting the quantitative data of the selected studies39,40.
Most of the studies were conducted in developed countries, and it is known that the indicators of frailty can vary due to the environmental context. There is therefore a need for studies involving elderly people in developing countries with the objective of validating operational models of frailty.
coNcLuSIoN
Frailty assessment measures provide important clinical information on the survival of elderly residents in the community. Both the measures of frailty assessed in the present study are able to predict mortality. Older people are at a higher risk of death than younger people. The risk of death is higher for men than for women. This result illustrates the so-called paradox of morbidity and mortality, in which, despite presenting worse health conditions,
women have better survival rates than men. There is evidence of a need for a gender-based approach to health conditions and death in aging.
The phenotype model defines frailty as a clinical syndrome indicated by specific signs and symptoms. It distinguishes between the frailty of illnesses and disabilities, and has demonstrated reproducibility in different environmental contexts. The use of phenotypic models may help with the comparison of different cohorts, as well as the identification of correlates of frailty. It is important to understand the relationship between biological, clinical and environmental factors in the etiology of frailty.
The frailty index model is based on the accumulation of deficits that result in frailty. The number of deficits, however, do not constitute a clinical syndrome. The measure is sensitive for the identification of individuals who are most vulnerable to negative outcomes, as it uses a gradual scale of risk stratification. However, there is still no consensus on the cutoff point for classifying frailty based on this model. The data from studies show that higher scores on the frailty index are associated with negative health outcomes. However, further studies are needed to investigate the interaction of deficits in different environmental contexts. It is well known that some items that make up the index have a causal relationship with death, such as cardiovascular diseases and cancer. It is necessary to identify the weight of each variable in relation to the frailty indicated by the index and mortality.
Measures to assess frailty can assist in the development of actions of intervention. Changes in frailty status should also be considered when planning care for the elderly, as these changes may indicate a rapid decline in health status and greater vulnerability to adverse events.
ReFeReNceS
1. Walston JD, Hadley EV, Ferrucci L, Guralnik JM, Newman AB, Studenski SA, et al. Research agenda for Frailty in older adults: toward a better understanding of physiology and etiology: summary from the American Geriatrics Society/National Institute on Aging Research Conference on Frailty in older adults. J Am Geriatr Soc. 2006;54(6):991-1001.
2. Morley JE, Vellas B, Van Kan A, Anker SD, Bauer JM. Frailty consensus: a call for action. J Am Med Dir Assoc. 2013;14:392-7.
Rev. Bras. Geriatr. Gerontol., Rio de Janeiro, 2017; 20(2): 273-285
284
4. Rodriguez-Mañas L, Féart C, Mann G, Viña J, Chatterji S. Searching for an operational definition of frailty: a Delphi method based consensus statement. The frailty operational definition consensus
conference project. J Gerontol Ser A Biol Sci Med Sci. 2013;68(1):62-7.
5. Kelaiditi E, Van Kan A, Cesari M. Frailty: a role of nutrition and exercise. Curr Opin Clin Nutr Metab Care. 2014;17(1):32-9.
6. Turner G, Clegg A. Best practice guidelines for the management of frailty: a British Geriatrics Society, Age UK and Royal College of General Practitioners report. Age Ageing. 2014;43:744-77.
7. Woodhouse KW, Wynne H, Baillie S, James OFW, Rawlins MD. Who are the frail elderly? Q J Med. 1988;68(255):505-6.
8. Markle-Reid M, Browne G. Conceptualizations of frailty in relation to older adults. J Adv Nurs. 2003;44(1):58-68.
9. Winograd CH, Gerety MB, Chung M, Goldstein MK, Dominguez Jr F, Vallone R. Screening for frailty: criteria and predictors of outcomes. J Am Geriatr Soc. 1991; 39(8):778-84.
10. Rockwood K, Fox RA, Stolle P, Robertson D, Beattie L. Frailty in elderly people: an evolving concept. Can Med Assoc J. 1994;150(4):489-95.
11. Mitnitski AB, Mogilner AJ, Rockwood K.
Accumulation of deficits as a proxy measure of aging. Sci World J. 2001;1(8):323-36.
12. Fried LP, Tangen C, Walston J, Newman AB, Hirsch C, Gottdiener J, et al. Frailty in older adults: evidence for a phenotype. J Gerontol Ser A Biol Sci Med Sci. 2001;56(3):146-56.
13. Bouillon K, Kivimaki M, Hamer M, Sabia S, Fransson EI, Singh-Manaoux A, et al. Measures of frailty in population based studies: an overview. BMC Geriatr. 2013;13:64.
14. Rockwood K, Andrew M, Mitnitski A. Comparison of two approaches to measuring frailty in elderly people. J Gerontol Ser A Biol Sci Med Sci. 2007;62(7):738-43. 15. Searle SD, Mitnitski AB, Gahbauer EA, Gill TM,
Rockwood K. A standard procedure for creating a frailty index. BMC Geriatr. 2008; 8:1-10.
16. Malmstrom TK, Miller DK, Morley JE. A comparison of four frailty models. J Am Geriatr Soc. 2014;62:721-6. 17. Morley JE, Malmstrom TK, Miller DK. A simple
frailty questionnaire (FRAIL) predicts outcomes in middle aged African Americans. J Nutr Health Aging. 2012;16(7):601-8.
18. Ensrud KE, Ewing SK, Taylor BC, Fink HA, Stone KL, Cauley JA, et al. Frailty and risk of falls, fracture, and mortality in older women: the study of osteoporotic fractures. J Gerontol Ser A Biol Sci Med Sci. 2007;62(7):744-51.
19. Jung HW, Kim SW, Ahn S, Lim JY, Han JW, KiM TH, et al. Prevalence and outcomes of frailty in Korean elderly population: comparison of a multidimensional frailty index with two phenotype models. PLoS ONE. 2014;9(2):1-8.
20. Sternberg SA, Schwartz AW, Karunananthan S, Bergman H, Clarfield AM. The identification of frailty: a systematic literature review. J Am Geriatr Soc. 2011;59(11):2129-38.
21. Cawthon PM, Marshall LM, Michael Y, Dam TT, Ensrud KE, Barrett-Connor E, et al. Frailty in older men: prevalence, progression, and relationship with mortality. J Am Geriatr Soc. 2007;55(8):1216-23. 22. Ávila-Funes JA, Helmer C, Amieva H,
Barberger-Gateau P, Le Goff M, Ritchie K, et al. Frailty among community-dwelling elderly people in France: the Three-City Study. J Gerontol Ser A Biol Sci Med Sci. 2008;63(10):1089-96.
23. Ensrud KE, Ewing SK, Taylor BC, Fink HA, Cawthon PM, Stone KL, et al. Comparison of 2 frailty indexes for prediction of falls, disability, fractures, and death in older women. Arch Intern Med. 2008;168(4):382-9. 24. Graham JE, Snih SA, Berges IM, Ray LA, Markides
KS, Ottenbacher KJ. Frailty and 10-year mortality in community-living Mexican American older adults. Gerontology. 2009;55(6):644-51.
25. Ensrud KE, Ewing SK, Cawthon PM, Fink HA, Taylor BC, Cauley JA, et al. A comparison of frailty indexes for the prediction of falls, disability, fractures, and mortality in older men. J Am Geriatr Soc. 2009;57(3):492-98.
26. Berges IM, Graham JE, Glenn VO, Markides KS, Ottenbacher KJ. Sex differences in mortality among older frail Mexican Americans. J Womens Health. 2009;18(10):1647-51.
27. García-González JJ, García-Peña C, Franco-Marina F, Gutiérrez-Robledo LM. A frailty index to predict the mortality risk in a population of senior Mexican adults. BMC Geriatr. 2009;9:1-8.
28. Lucicesare A, Hubbard RE, Fallah N, Forti P, Searle SD, Mitnitski A, et al. Comparison of two frailty measures in the Conselice Study of Brain Ageing. J Nutr Health Aging. 2010;14(4):278-81.
Frailty and mortality in older adults
285
Received: June 09, 2016 Reviewed: January 14, 2017 Accepted: March 30, 2017
30. Masel MC, Ostir GV, Ottenbacher KJ. Frailty, mortality, and health-related quality of life in older Mexican Americans. J Am Geriatr Soc. 2010;58(11):2149-53. 31. Jacobs JM, Cohen A, Ein-Mor E, Maaravi Y, Stessman
J. Frailty, cognitive impairment and mortality among the oldest old. J Nutr Health Aging. 2011;15(8):678-82. 32. Cano C, Samper-Ternent R, Al Snih S, Markides K,
Ottenbacher KJ. Frailty and cognitive impairment as predictors of mortality in older Mexican Americans. J Nutr Health Aging. 2012;16(2):142-7.
33. Abizanda P, Romero L, Sánchez-Jurado PM, Martínez-Reig M, Gómez-Arnedo L, Alfonso SA. Frailty and mortality, disability and mobility loss in a Spanish cohort of older adults: the FRADEA study. Maturitas. 2013;74(1):54-60.
34. Kulmala J, Nykänen I, Hartikainen S. Frailty as a predictor of all-cause mortality in older men and women. Geriatr Gerontol Int. 2014;14(4):899-905. 35. Armstrong JJ, Mitnitski A, Launer LJ, White LR, Rockwood K. Frailty in the Honolulu-Asia Aging Study: deficit accumulation in a male cohort followed to 90% mortality. J Gerontol Ser A Biol Sci Med Sci. 2015;70(1):125-31.
36. Chang SF, Lin PL. Frailty phenotype and mortality prediction: a systematic review and meta-analysis of prospective cohort studies. Int J Nurs Stud. 2015; 52:1362-74.
37. Shamlyian T, Talley KM, Ramakrishnan R, Kane R. Association of frailty with survival: a systematic literature review. Ageing Res Rev. 2013; 12(2):719-36. 38. Garcia-Garcia FJ, Avila GG, Alfaro-Acha A, Amor
Andres MS, De Los Angeles De La Torre Lanza M, Escribano Aparicio MV, et al. The prevalence of frailty syndrome in an older population from Spain. The Toledo Study for Healthy Aging. J Nutr Health Aging. 2011;15(10):852-56.
39. Walston JD, Bandeen-Roche K. Frailty: a tale of two concepts. BMC Med. 2015;13:1-8.