161
Original Articles
Lack of accessibility in public transport and inadequacy of sidewalks:
effects on the social participation of elderly persons with functional
limitations
Michelle Didone dos Santos1 Marcela Fernandes Silva1 Leonardo Antunes Velloza1 José Eduardo Pompeu1
1 Hospital das Clinicas da Faculdade de Medicina da Universidade de São Paulo (HCFMUSP), Programa
de Aprimoramento de Fisioterapia em Geriatria e Gerontologia. São Paulo, SP, Brasil.
Correspondence
Michelle Didone dos Santos E-mail: [email protected]
Abstract
Objective: To analyze the association between the decline in the mobility of community dwelling elderly persons in São Paulo, Brazil and their capacity to use public transportation, and its impact on their quality of life and social participation. Method: A cross-sectional study was conducted of 32 community dwelling elderly persons, of both genders (59% female), with an average age of 75.5 years (±9.2). The participants were evaluated by functional mobility, risk of falls, fear of falls and independence in activities of daily living. In addition, the perception of the elderly persons of their mobility on public transport and its impact on their social participation was evaluated. The elderly persons were divided into two groups: with mobility impairment and without mobility impairment. The groups were compared using the Fisher's Exact, Chi-Squared and Mann-Whitney tests, and the unpaired Student's t-test. An alpha level of 0.05 was adopted as a level of statistical significance. Result: Elderly persons with greater mobility impairment exhibited greater difficulty accessing public transport and a greater number of falls during their use of the same. Elderly persons who reported difficulty accessing public transport suffered greater impact on their social participation and quality of life. Conclusion: Elderly persons with greater mobility impairment had a greater number of complaints related to public transport. Additionally, they suffered a greater impact on their social participation, characterized by limitations in their capacity for independent movement around the city, limiting their social activities.
162
INTRODUCTION
The increased population aging of recent decades1,2 has challenged cities to transform in order to guarantee the independence and autonomy of the elderly, as well ensuring they enjoy an active and productive life3-5.
A key factor if this population is to maintain independence and autonomy and delay the emergence of disabilities is their ability to move around the city6. The mobility of the elderly can be defined as their ability to move from one place to another independently and safely7.
This mobility may be limited by personal factors associated with the physiological process of aging, or environmental factors. Personal factors include the impairment of muscle strength and flexibility, increased rigidity of the periarticular and intramuscular connective tissues, the decline of the tolerance of the body to exercise, decreased nerve conduction and reduced visual, auditory and vestibular acuity7,8. Among environmental factors, the main barriers are associated with the inadequacies of public transportation accessibility and irregularities in the sidewalks and roads used by the elderly. The safe and independent movement of the elderly around the city depends on a suitable physical environment that facilitates accessibility1,9. While subways and trains are rapid modes of transport, it is often necessary to walk long distances to reach stations, as well as to go up and down stairs and walk along long corridors until reaching the desired platform. Buses, on the other hand, are a slower form of travel, and are often hindered by city traffic. However, access is usually easier via locations closer to the residence of the user, which reduces the need to travel long distances. In addition, the bus has the flexibility of rapid integration in special terminals10.
Mobility and accessibility are also related to quality of life, as the elderly may have difficulties performing instrumental activities of daily living (IADL) such as shopping or banking, if external environments do not facilitate such activities11. They also discourage social interaction, as the possibility of moving through the city determines the participation of the elderly in such interaction12.
In order for the population to age in a more active manner, there is a need either for environments that support the elderly, without physical barriers that discourage them from leaving home, and a system of public transportation and streets and avenues that meets the specific needs of this group10,11,13,14, or a treatment program that will help them overcome these barriers.
After extensive research in existing literature, the authors of the present study did not locate studies on the relationship between mobility deficiencies among the elderly and their ability to use public transportation. There is therefore a gap in the literature on the impact of personal and environmental limitations related to mobility and the conditions of accessibility to public transport on the social participation of these individuals. Most studies are linked to civil engineering and transport engineering issues, and address only the satisfaction of the public transport user. Issues related to the health sector are scarce, and it is important that research is carried out that provides information and knowledge about this relationship4,5.
The objective of the present study was therefore to analyze the association between the declining mobility of elderly persons and their ability to use public transport, and its impact on the quality of life and social participation of such individuals.
METHODS
163 The inclusion criteria applied to the study
participants were: a) elderly people aged 60 and over of both genders (male and female); b) elderly people who used one or more of the main modes of public transport (bus, subway or train). The exclusion criteria were the inability to perform the tests or to answer the study questionnaires due to motor or cognitive impairment.
After agreeing to participate and signing a Free and Informed Consent Form (FICF), the elderly persons were evaluated individually. Each evaluation lasted from 40 to 60 minutes. The evaluation consisted of the registering of sociodemographic characteristics, cognitive tracking and mood disorders through the MMSE and the Geriatric Depression Scale (GDS-15), respectively. Functional mobility was evaluated by the Short Physical Performance Battery (SPPB) and Mini Balance Evaluation Systems Test (Mini-BESTest). Manual grip strength was performed by a handgrip dynamometer. Self-reported difficulties in daily and social living activities were evaluated through the Questionário Brasileiro de Avaliação
Funcional Multidimensional (the Brazilian Questionnaire
of Multidimensional Functional Assessment) (BOMFAQ) and the Participation Scale, respectively. Fear of falling was assessed through the Falls Efficacy Scale–International (FES-I) instrument. Finally, perception of the accessibility conditions of public transport and their impact on social participation was evaluated through two questionnaires created by the authors of the present study.
The MMSE15 is a cognitive tracking instrument that evaluates temporal orientation, spatial orientation, three word registration, attention and calculation, three word recall, language and visual constructive ability. The score can vary from a minimum of zero points, which indicates the highest degree of cognitive impairment of an individual, to a maximum total of 30 points, which corresponds to the highest cognitive capacity. The cut-off points used were based on schooling: 20 points for illiterate individuals; 1-4 years of schooling: 25 points; 5-8 years: 26 points; 9-11 years: 28 points; >11 years: 29 points15.
The SPPB16 has been used as an effective instrument to evaluate the physical performance of the lower limbs (LL). The SPPB adapted for the
Brazilian population17 is composed of three tests that evaluate in sequence, standing static balance, gait speed and the muscular strength of the LL. A differentiated score of 0 to 4 was given for each test, according to the performance time of each task17, with 0-3 points considered: inability or very poor performance; 4-6 points: low performance; 7-9 points: moderate performance; 10-12 points: good performance16.
The Manual Grip Strength Test, which is broadly correlated to the overall muscular strength level of the elderly, was evaluated through the use of a pressure dynamometer in the dominant hand, with maximum manual grip strength recorded over three attempts with a one-minute Interval between attempts. The best score among the three trials was used as a measure18. The values were adjusted according to gender and body mass index (BMI) as described by Marucci and Barbosa18: men - BMI of 0 to 23, cutoff point (CP) <27.00kgf; BMI between 23 and 28, CP 28.67kgf; BMI between 28 and 30, CP 29.50kgf; BMI greater than 30, CP<28.67kgf; women - BMI between 0 and 23, CP<16.33kgf; BMI between 23 and 28, CP<16.67kgf; BMI between 28 and 30, CP<17.33kgf; BMI greater than 30, CP<16.67kgf.
The Mini-BESTest19 adapted and validated for the Brazilian population20, allows the rapid and reliable tracking of balance disorders. It has 14 items, each of which is given a score of from zero to two. The maximum score is 32, which suggests no balance disorders, and the minimum is zero points, which is suggestive of a balance deficit20. In the present study, cutoff scores of less than or equal to 21 points among the elderly were considered as deficits of postural response (worse performance) and those who obtained more than 21 points were considered as not having postural response deficits (better performance)21.
164
study only for the purpose of characterizing the sample and control of possible bias of the influence of depressive symptoms on the perception of mobility in public transport.
The objective of the Questionário Brasileiro de
Avaliação Funcional Multidimensional (the Brazilian
Questionnaire on Multidimensional Functional Assessment) (BOMFAQ)24 is to evaluate the difficulties related by the subject in performing 15 activities of daily living. Activities that presented some difficulty received one point regardless of the degree of difficulty described, with a score of 15 indicative of the greatest possible functional impairment.
The Falls Efficacy Scale-International (FES-I)25 consists of evaluating the fear of new falls described by the subject during a number of daily and social living activities, and may present a decline in mobility by self-limitation. There are 16 tasks with different levels of complexity in which the elderly can report feeling not at all concerned (1 point), a little concerned (2 points), very concerned (3 points) or extremely concerned (4 points) about the risk of falling during the activities. Therefore, a score greater than or equal to 23 points would be associated with episodes of sporadic falls and a score greater than or equal to 31 points would be associated with recurrent falls25.
The Participation Scale26 quantitatively compares the impact of physical incapacities and immobility on the social participation of the elderly. This scale was based on the concepts of the International Classification of Functioning (ICF) of Activity and Participation and consists of 18 closed (yes or no) self-reported questions relating to participation in different social tasks, based on comparison "with someone equal to you in everything except your condition or disability," such as "do you participate in recreational and social activities as often as your peers?" "do you visit other people in the community as often as your peers?". If relevant, prior to the question, the subject was asked to not consider going to hospitals or medical consultations as social participation. When the answers were negative, the question was asked "to what extent does this pose a problem for you?". The peer relationship was established with respect to gender, age group and level of schooling. The same scale was also used based
on comparison with the elderly persons themselves, but aged ten years younger. Responses were scored according to the level of importance to the subject, where the higher the score, the greater the impact and its relevance to social participation26.
The urban mobility questionnaire used to evaluate the perception of the elderly regarding mobility in public transport was created by the authors of the study, based on the "Global Guide: Age Friendly Cities"11. It contained structured questions about the availability of transport timetables, safety regarding locomotion within the modes of transport, and the access route to the same, the kindness of drivers and other passengers, among other issues considered important for the development of the study.
The questionnaire on quality of life associated with public transport was also prepared by the authors of the study. It contains five easy-to-understand structured questions related to activities that the elderly persons do not attend because of the difficulty in getting around via public transportation.
For comparative data analysis, Fisher's exact and the Chi-squared tests were used for categorical data and the Mann-Whitney test and the non-paired Student's t-test were used for numerical data, according to the normality test. A level of 5% (p<0.05) was considered for statistical significance.
The present study was performed in accordance with the regulatory directives and guidelines on research involving human beings (resolution 466/12 of the National Health Council), and data collection only began following approval by the Ethics Committee for the Analysis of Research Projects of the Hospital das Clínicas of the Faculdade de Medicina da Universidade de São Paulo (the Clinical Hospital of the Medical School of the University of São Paulo) on 20/08/2015 under CAAE number 47.788.915.4.0000.0068.
RESULTS
165 BMI of 25.8 (±4.5), most of the elderly persons
were married (n=20; 62%) and scored a mean of 27.2 points (± 2.2) in the MMSE and 3.6 Points (±2.7) in GDS-15 (Table 1 and 2). There was also a preponderance of elderly people living in the western region (n=12; 37%) of the city of São Paulo, and half of the sample used the bus (n=16; 50%) as their main mode of public transportation. Table
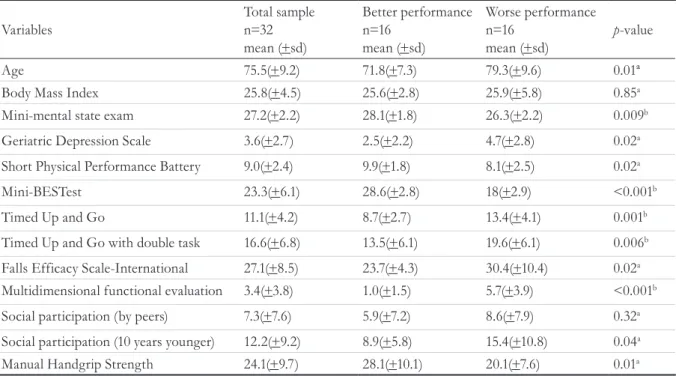
1 and Table 2 show that there was a significant difference in relation to age (p=0.01), schooling (p=0.04), marital status (p=0.02), type of public transport used (p=0.005), and MMSE (p=0.009) and GDS-15 (p=0.02) scores between elderly persons who obtained Mini-BESTest scores above (better performance) and below (worse performance) the cutoff point.
Table1. Sociodemographic characterization and evaluation of mobility of total sample of elderly persons and
comparison with Mini-BESTest performance. São Paulo, 2016.
Variables
Total sample n=32 mean (+sd)
Better performance n=16
mean (+sd)
Worse performance n=16
mean (+sd)
p-value
Age 75.5(+9.2) 71.8(+7.3) 79.3(+9.6) 0.01ª
Body Mass Index 25.8(+4.5) 25.6(+2.8) 25.9(+5.8) 0.85a
Mini-mental state exam 27.2(+2.2) 28.1(+1.8) 26.3(+2.2) 0.009b
Geriatric Depression Scale 3.6(+2.7) 2.5(+2.2) 4.7(+2.8) 0.02a
Short Physical Performance Battery 9.0(+2.4) 9.9(+1.8) 8.1(+2.5) 0.02a
Mini-BESTest 23.3(+6.1) 28.6(+2.8) 18(+2.9) <0.001b
Timed Up and Go 11.1(+4.2) 8.7(+2.7) 13.4(+4.1) 0.001b
Timed Up and Go with double task 16.6(+6.8) 13.5(+6.1) 19.6(+6.1) 0.006b
Falls Efficacy Scale-International 27.1(+8.5) 23.7(+4.3) 30.4(+10.4) 0.02a
Multidimensional functional evaluation 3.4(+3.8) 1.0(+1.5) 5.7(+3.9) <0.001b
Social participation (by peers) 7.3(+7.6) 5.9(+7.2) 8.6(+7.9) 0.32a
Social participation (10 years younger) 12.2(+9.2) 8.9(+5.8) 15.4(+10.8) 0.04a
Manual Handgrip Strength 24.1(+9.7) 28.1(+10.1) 20.1(+7.6) 0.01a
166
Table 1 shows a significant difference between the best and worst performing groups in terms of elderly mobility in the variables of all the instruments used (SPPB, Mini-BESTest, Timed Up and Go (TUG), TUG dual task, FES-I, BOMFAQ, social participation in comparison with elderly persons ten years younger and manual grip strength), except the social participation scale by peer comparison.
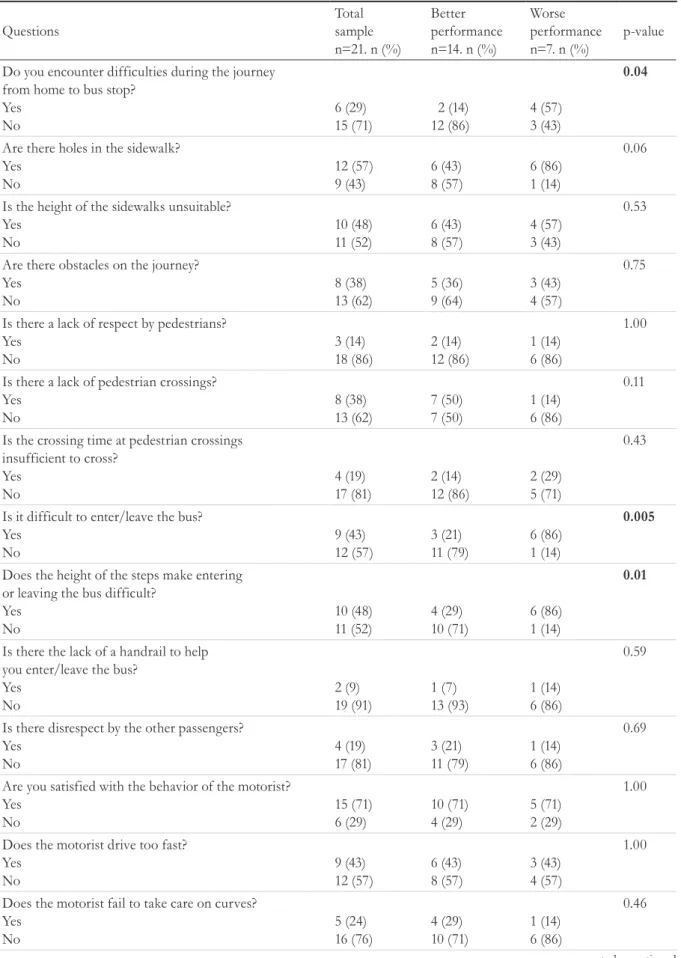
In terms of the perception of urban mobility of the elderly persons, who use the bus as their main mode of transport (n=21), table 3 shows that only six (29%) reported difficulty in walking to their transportation from their respective residences, with holes in the sidewalk (n=12; 57%) and the inadequate height of the same (n=10; 48%) the most frequently reported difficulties. Nine (43%) of the 21 elderly persons
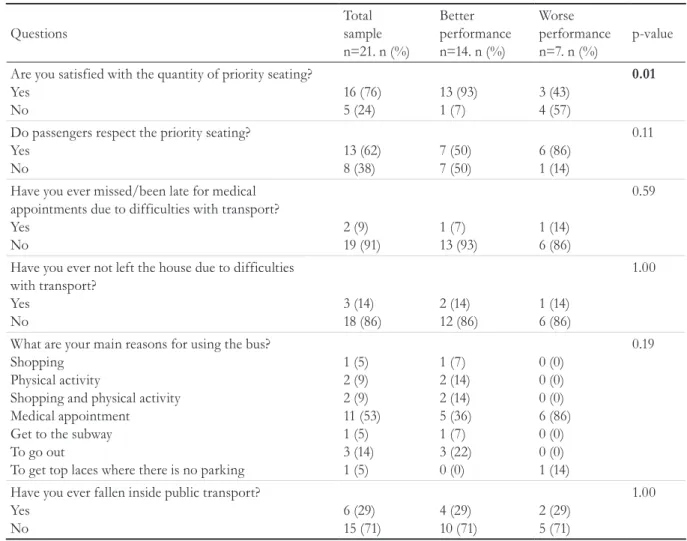
reported having difficulty getting on and off the bus, while ten (48%) elderly individuals said that the main obstacle to accessing the bus was the height of the step, and six (29%) claimed to have fallen within the modes of transport. The main reasons for leaving home and using the bus was to attend medical appointments (n=11, 53%) and to go out (n=3; 14%), with 19 (91%) never having missed or been late for an appointment due to transportation difficulties. A total of 18 (n=86%) did not often abandon going out. Table 2 also shows that there was a significant difference between the best and worst performing groups in the following questions: difficulty in travelling from home to the bus stop (p=0.04), difficulty entering and exiting the bus (p=0.005), step height as a difficulty factor (p=0.01) and degree of satisfaction with priority seating (p=0.01).
Table 2. Sociodemographic characterization and evaluation of mobility of total sample of elderly persons and comparison with Mini-BESTest performance. São Paulo, 2016.
Total sample n=32 n (%)
Better performance n=16 n (%)
Worse performance
n=16 n (%) p-value
Gender Female
Male
19 (59) 13 (41)
8 (50) 8 (50)
11 (69) 5 (31)
0.47a
Schooling (years) 1-4
5-8 9-11 More than 11
6 (19) 6 (19) 10 (31) 10 (31)
0 (0) 4 (25) 7 (44) 5 (31)
6 (38) 2 (12) 3 (19) 5 (31)
0.04b
Marital status Single Married Widowed Divorced
6(19) 20 (62) 5 (16) 1 (3)
6 (38) 9 (56) 1(6) 0 (0)
0 (0) 11 (69) 4 (25) 1 (6)
0.02b
Region of residence South
North East West Central
4 (12) 6 (19) 5 (16) 12 (37) 5 (16)
2(12) 3 (19) 1 (7) 8 (50) 2 (12)
2 (12) 3 (19) 4 (25) 4 (25) 3 (19)
0.50b
Transport used Bus
Subway Bus and subway Subway and train
16 (50) 10 (31) 5 (16) 1 (3)
9 (57) 1 (6) 5 (31) 1 (6)
7 (44) 9 (56) 0 (0) 0 (0)
0.005b
a: p-value referring to Fischer’s test in comparison between elderly persons with better and worse performance; b: p-value referring to Chi-squared test in comparison between elderly persons with better and worse performance; * The division of the better/worse performing groups
167
to be continued Table 3. Perception of urban mobility of elderly persons using the bus as their main mode of transport and comparison with Mini-BESTest performance. São Paulo, 2016.
Questions
Total sample n=21. n (%)
Better performance n=14. n (%)
Worse performance n=7. n (%)
p-value
Do you encounter difficulties during the journey from home to bus stop?
Yes No 6 (29) 15 (71) 2 (14) 12 (86) 4 (57) 3 (43) 0.04
Are there holes in the sidewalk? Yes No 12 (57) 9 (43) 6 (43) 8 (57) 6 (86) 1 (14) 0.06
Is the height of the sidewalks unsuitable? Yes No 10 (48) 11 (52) 6 (43) 8 (57) 4 (57) 3 (43) 0.53
Are there obstacles on the journey? Yes No 8 (38) 13 (62) 5 (36) 9 (64) 3 (43) 4 (57) 0.75
Is there a lack of respect by pedestrians? Yes No 3 (14) 18 (86) 2 (14) 12 (86) 1 (14) 6 (86) 1.00
Is there a lack of pedestrian crossings? Yes No 8 (38) 13 (62) 7 (50) 7 (50) 1 (14) 6 (86) 0.11
Is the crossing time at pedestrian crossings insufficient to cross?
Yes No 4 (19) 17 (81) 2 (14) 12 (86) 2 (29) 5 (71) 0.43
Is it difficult to enter/leave the bus? Yes No 9 (43) 12 (57) 3 (21) 11 (79) 6 (86) 1 (14) 0.005
Does the height of the steps make entering or leaving the bus difficult?
Yes No 10 (48) 11 (52) 4 (29) 10 (71) 6 (86) 1 (14) 0.01
Is there the lack of a handrail to help you enter/leave the bus?
Yes No 2 (9) 19 (91) 1 (7) 13 (93) 1 (14) 6 (86) 0.59
Is there disrespect by the other passengers? Yes No 4 (19) 17 (81) 3 (21) 11 (79) 1 (14) 6 (86) 0.69
Are you satisfied with the behavior of the motorist? Yes No 15 (71) 6 (29) 10 (71) 4 (29) 5 (71) 2 (29) 1.00
Does the motorist drive too fast? Yes No 9 (43) 12 (57) 6 (43) 8 (57) 3 (43) 4 (57) 1.00
168
Continued from Table 3
Table 4 shows that 50% (n=8) of the elderly persons who use the subway as their main mode of transport have difficulty walking the route from their respective residences to the station, with the most frequent complaint being holes in the sidewalks (n=12, 75%). Five (31%) of the elderly persons reported that they had fallen within the station once or more, and said that the reason they use the subway most is to go to medical appointments (n=12; 75%). There was a significant difference between the better and worse performing groups in the items "lack of a handrail" as a difficulty factor when entering/exiting the train (p=0.04), and falls within the modes of transportation (p=0.01).
Even with all the difficulties encountered, the elderly persons evaluated rarely do not use public transportation because they do not have someone
to accompany them (n=30; 94%). As shown in table 5, however, there is a significant difference between the better and worse performing groups, where the worse performing group would be socially more active if these difficulties were resolved (p=0.02) and would have a better quality of life, participating in more activities that do not currently participate in (p=0.006).
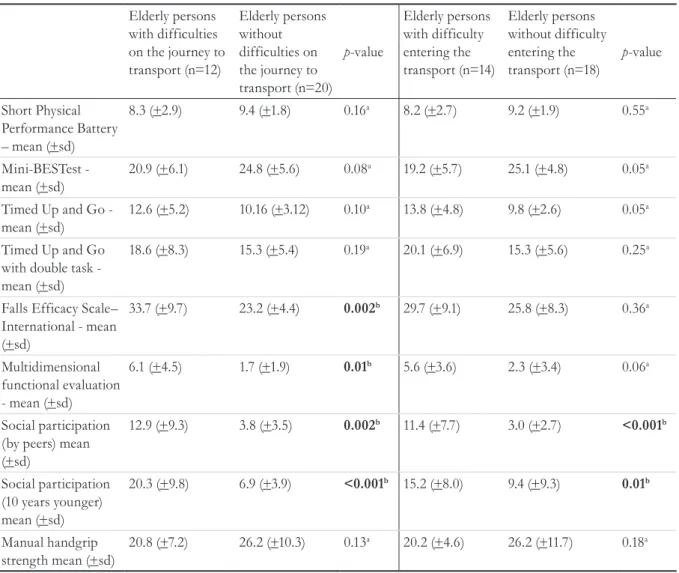
Based on the comparison of the mobility of the elderly who described having or not having difficulty in the journey to the means of public transport, table 5 reveals a significant difference in the FES-I, BOMFAQ and participation scale scores. When comparing the mobility of the elderly who reported having difficulty entering public transport, there was a significant difference only in the scores of the social participation scale (table 6).
Questions
Total sample n=21. n (%)
Better performance n=14. n (%)
Worse performance n=7. n (%)
p-value
Are you satisfied with the quantity of priority seating? Yes
No
16 (76) 5 (24)
13 (93) 1 (7)
3 (43) 4 (57)
0.01
Do passengers respect the priority seating? Yes
No
13 (62) 8 (38)
7 (50) 7 (50)
6 (86) 1 (14)
0.11
Have you ever missed/been late for medical appointments due to difficulties with transport? Yes
No
2 (9) 19 (91)
1 (7) 13 (93)
1 (14) 6 (86)
0.59
Have you ever not left the house due to difficulties with transport?
Yes No
3 (14) 18 (86)
2 (14) 12 (86)
1 (14) 6 (86)
1.00
What are your main reasons for using the bus? Shopping
Physical activity
Shopping and physical activity Medical appointment
Get to the subway To go out
To get top laces where there is no parking
1 (5) 2 (9) 2 (9) 11 (53) 1 (5) 3 (14) 1 (5)
1 (7) 2 (14) 2 (14) 5 (36) 1 (7) 3 (22) 0 (0)
0 (0) 0 (0) 0 (0) 6 (86) 0 (0) 0 (0) 1 (14)
0.19
Have you ever fallen inside public transport? Yes
No
6 (29) 15 (71)
4 (29) 10 (71)
2 (29) 5 (71)
1.00
a: p-value referring to Chi-squared test in comparison between elderly persons with better and worse performance; * The division of the better/worse performing groups was carried out based on the Mini-BESTest cut-off point, where better performance >21 points and worse
169 Table 4. Perception of urban mobility of elderly persons using the metro as their main mode of transport and
comparison with Mini-BESTest performance. São Paulo, 2016.
Questions
Total sample n=16. n (%)
Better performance n=7. n (%)
Worse performance n=9. n (%)
p-value
Do you encounter difficulties during the journey from home to station? Yes No 8 (50) 8 (50) 3 (43) 4 (57) 5 (56) 4 (44) 0.61
Are there holes in the sidewalk? Yes No 12 (75) 4 (25) 4 (57) 3 (43) 8 (89) 1 (11) 0.14
Is the height of the sidewalks unsuitable? Yes No 7 (44) 9 (56) 2 (29) 5 (71) 5 (56) 4 (44) 0.28
Are there obstacles on the journey? Yes No 7 (44) 9 (56) 2 (29) 5 (71) 5 (56) 4 (44) 0.28
Is there a lack of respect by pedestrians? Yes No 1 (6) 15 (94) 1 (14) 6 (86) 0 (0) 9 (100) 0.24
Is there a lack of pedestrian crossings? Yes No 1 (6) 15 (94) 1 (14) 6 (86) 0 (0) 9 (100) 0.24
Is the crossing time at pedestrian crossings insufficient to cross?
Yes No 3 (19) 13 (81) 1 (14) 6 (86) 2 (22) 7 (78) 0.68
Do you find it difficult to enter/leave the subway? Yes No 5 (31) 11 (69) 1 (14) 6 (86) 4 (44) 5 (56) 0.19
Is the distance between the train and the platform unsuitable? Yes No 1 (6) 15 (94) 0 (0) 7 (100) 1 (11) 8 (89) 0.36
Does lack of handrail make entering/leaving subway difficult Yes No 4 (25) 12 (75) 0 (0) 7 (100) 4 (44) 5 (56) 0.04
Is there disrespect by the other passengers? Yes No 3 (19) 13 (81) 2 (29) 5 (71) 1 (11) 8 (89) 0.37
Is the door opening/closing time insufficient? Yes No 2 (12) 14 (88) 0 (0) 7 (100) 2 (22) 7 (78) 0.18
Are you satisfied with the quantity of priority seating? Yes No 15 (94) 1 (6) 7 (100) 0 (0) 8 (89) 1 (11) 0.36
Do passengers respect the priority seating? Yes No 13 (81) 3 (19) 5 (71) 2 (29) 8 (89) 1 (11) 0.37
170
Continued from Table 4
Questions
Total sample n=16. n (%)
Better performance n=7. n (%)
Worse performance n=9. n (%)
p-value
Have you ever missed/been late for medical appointments due to difficulties with transport? Yes
No
1 (6) 15 (94)
0 (0) 7 (100)
1 (11) 8 (89)
0.36
Have you ever not left the house due to difficulties with transport?
Yes No
2 (12) 14 (88)
0 (0) 7 (100)
2 (22) 7 (78)
0.18
What are your main reasons for using the metro? Shopping
Physical activity
Shopping and physical activity Medical appointment
1 (6) 1 (6) 2 (13) 12 (75)
1 (14) 1 (14) 1 (14) 4 (58)
0 (0) 0 (0) 1 (11) 8 (89)
0.37
Have you ever fallen inside public transport? Yes
No
5 (31) 11 (69)
0 (0) 7 (100)
5 (56) 4 (44)
0.01
a: p-value referring to Chi-squared test in comparison between elderly persons with better and worse performance; * The division of the better/worse performing groups was carried out based on the Mini-BESTest cut-off point, where better performance >21 points and worse
performance ≤21 points.
Table 5. Perception of quality of life associated with public transport and comparison based on Mini-BESTest performance. São Paulo, 2016.
Questions Total sample
n=32 n(%)
Better performance n=16 n(%)
Worse performance n=16 n(%)
p-valuea
Have you ever not used public transport due to not having a companion with you?
Yes No
2 (6) 30 (94)
0 (0) 16 (100)
2 (12) 14 (88)
0.14
Would you be more socially active if your difficulties with public transport were resolved? Yes
No
12 (37) 20 (63)
3 (19) 13 (81)
9 (56) 7 (44)
0.02
Would you have a greater quality of life if you participated in more events that you have not taken part in due to difficulties with public transport?
Yes No
9 (28) 23 (72)
1 (6) 15 (94)
8 (50) 8 (50)
0.006
a: p-value referring to Chi-squared test in comparison between elderly persons with better and worse performance; * The division of the better/worse performing groups was carried out based on the Mini-BESTest cut-off point, where better performance >21 points and worse
171
DISCUSSION
The aim of the present study was to analyze the decline of the mobility of the elderly, their perception regarding the use of public transport and its impact on quality of life and social participation. Through the evaluations performed it is possible to perceive that the four aspects mentioned are interconnected. Several studies2,4,12,27 suggest that the ability to move around the city, as well as guaranteeing autonomy and a better quality of life for the elderly, is an important prevention factor for dependency and institutionalization.
In the present study, the elderly persons who performed poorly in the mobility assessment had
a significantly greater mean age than those who performed better. This reinforces that an aging population brings a greater chance of increasing the number of chronic degenerative diseases that can lead to different degrees of functional, social and cognitive limitations. This finding agrees with literature, which shows that the probability of elderly people aged over 75 years presenting some form of impairment in mobility increases by 47% each year5,27.
Previous studies1,27 have also shown that some sociodemographic characteristics (the female gender and low level of schooling) lead to a greater possibility of functional disability over time, compromising independence and quality of life, which agrees with the findings of the present study.
Table 6. Comparison of mobility of elderly persons that described having or not having difficulty on their journey to and when entering the mode of public transport they most use. São Paulo, 2016.
Elderly persons with difficulties on the journey to transport (n=12)
Elderly persons without difficulties on the journey to transport (n=20)
p-value
Elderly persons with difficulty entering the transport (n=14)
Elderly persons without difficulty entering the transport (n=18)
p-value
Short Physical Performance Battery – mean (+sd)
8.3 (+2.9) 9.4 (+1.8) 0.16a 8.2 (+2.7) 9.2 (+1.9) 0.55a
Mini-BESTest - mean (+sd)
20.9 (+6.1) 24.8 (+5.6) 0.08a 19.2 (+5.7) 25.1 (+4.8) 0.05a
Timed Up and Go - mean (+sd)
12.6 (+5.2) 10.16 (+3.12) 0.10a 13.8 (+4.8) 9.8 (+2.6) 0.05a
Timed Up and Go with double task - mean (+sd)
18.6 (+8.3) 15.3 (+5.4) 0.19a 20.1 (+6.9) 15.3 (+5.6) 0.25a
Falls Efficacy Scale– International - mean (+sd)
33.7 (+9.7) 23.2 (+4.4) 0.002b 29.7 (+9.1) 25.8 (+8.3) 0.36a
Multidimensional functional evaluation - mean (+sd)
6.1 (+4.5) 1.7 (+1.9) 0.01b 5.6 (+3.6) 2.3 (+3.4) 0.06a
Social participation (by peers) mean (+sd)
12.9 (+9.3) 3.8 (+3.5) 0.002b 11.4 (+7.7) 3.0 (+2.7) <0.001b
Social participation (10 years younger) mean (+sd)
20.3 (+9.8) 6.9 (+3.9) <0.001b 15.2 (+8.0) 9.4 (+9.3) 0.01b
Manual handgrip strength mean (+sd)
20.8 (+7.2) 26.2 (+10.3) 0.13a 20.2 (+4.6) 26.2 (+11.7) 0.18a
172
Due to the rapid advancement of population aging in Brazil, reporting the positive and negative aspects of the quality of sidewalks and streets, access to public transport and the transport itself is important, as reducing barriers and identifying alternatives is of great importance, along with strategies based on the individual, to guarantee access for the elderly1,28.
The opinion of almost all the elderly persons in the present study was positive. This can be associated with the fact that they are, for the most part, independent for the performance of activities of daily living, as in the group which performed more poorly in the mobility evaluation, the negative aspects were greater, restricting their ability to use public transport. The main problems reported by the elderly persons from both groups were: holes in the sidewalks, inadequate sidewalk height and height of bus steps. In contrast, Barreto1 found mostly negative answers, with the few positive points virtually nullified by the negative points, such as it is not an advantage to have buses to different locations if there are no seats at bus stops, and the priority seats are not respected. In a study by Bryanton, Weeks and Less29 of only elderly women, several reasons for not using public transport were reported, such as a lack of accessibility, long waiting time and difficulty with routes.
Means of transportation are necessary for the elderly persons to have access to health services and social and leisure activities, as they directly depend on such transport30. In the present study, there was a strong predominance of elderly people who use public transportation only to access health services, a finding which corroborates with the study by Barreto1, which raises two hypotheses: from a positive perspective, this population has a much greater degree of self-care and, negatively, there may be an increase in chronic-degenerative diseases, which causes them to seek healthcare services more frequently. Gajardo et al.5, in addition to observing a large number of elderly people who used transport only for healthcare purposes, reported that the majority of the sample asked their respective doctors to schedule consultations between 10.00 and 11.00 am, avoiding peak hours and facilitating access to means of transport.
Bryanton, Weeks and Lees29, observed that social requirements have become an extravagance for this population. The finding in this study is similar: in
general, the majority of older people with a worse performance in terms of mobility reported that they would be socially more active and would have a better quality of life if their difficulties with public transport were resolved. When the mobility of the elderly persons who described having difficulty in terms of access to transportation was considered, they obtained higher scores on the social participation scale, suggesting that such participation is impaired. This is due to the fact that using public transport helps to maintain connections with family and friends, as well as participation in other social events, and that barriers to access to these means of transport causes elderly people with reduced mobility or who already have some difficulties to abandon the use of these means of locomotion, due to the risks they will be exposed to1,27,31. Choi and Dinitto28 described that transportation that is an obstacle to visiting friends and family can contribute significantly to the increase of depressive symptoms.
In addition, it is important to highlight that elderly persons with poor mobility suffered a higher number of falls than the group that performed better in terms of mobility. While we cannot disregard the existence of factors that are intrinsic to the aging process, environmental factors, reported by the elderly and previously discussed, also contribute decisively to the occurrence of falls32. However, in the study by Gajardo et al.5, none of the interviewees suffered falls, but complained of insecurity about environmental factors and fear of falling.
Public health actions are therefore necessary to make streets and public transport more accessible to the elderly, leading to improvements in individual health and well-being. A city that is friendly to the elderly adapts its structures and services, providing where available free or subsidized transport that is reliable and frequent, ample route coverage, vehicles for the elderly, specialized services, priority seats, kindness and care from drivers, safety and comfort, good conditions at stops, community transport and information on transport options, all of which are fundamental characteristics for a city to be considered as friendly to the elderly.11 Not all, however, are to be found in the city of São Paulo.
173 to create specific intervention strategies that
address the real limitations of the elderly within the urban environment, which, due to a lack of knowledge of these difficulties and/or the inability of professionals to deal with elderly persons, has led to the development of strategies based only on the difficulties encountered in a controlled environment, when it is known that it is crucial to have a broad gerontological view to deal with this population from different perspectives30. In addition, it demonstrates the importance of thinking about public health policies to prevent or postpone the new demographic and epidemiological transition from generating undesirable economic effects in Brazil33.
The present study presents some limitations, such as the small sample size of both groups and the evaluation of perception, through reports (subjective evaluation) of the difficulties related to public transport, or in other words, the difficulties were not evaluated in an ecological way (by direct observation of their occurrence). With this, an extension of the research is suggested, by evaluating a greater number of elderly persons and carrying out studies
that evaluate the different chronic-degenerative conditions that could potentially influence mobility, as well as comparative studies between the ecological evaluation of mobility within public transport and the reports of the elderly.
CONCLUSION
With the results of this study it was possible to observe that the elderly persons who presented a greater degree of difficulty during mobility evaluations had a greater number of complaints related to access to public transport and the impact on their social participation than elderly persons with better mobility, suggesting that irregular sidewalks and inaccessible public transport are just some of the characteristics of the built environment that can create barriers to the external mobility of elderly people who already have some degree of reduced mobility, impacting on their ablity to interact independently with the city and reducing activities and well-being. The objectives of the study were therefore achieved.
REFERENCES
1. Barreto KML. Envelhecimento, mobilidade urbana e saúde: um estudo da população idosa (tese). Recife: Fundação Oswaldo Cruz; 2012.
2. Minayo MCS. O envelhecimento da população brasileira e os desafios para o setor saúde. Cad Saúde Pública. 2012;28(2):208-9.
3. Sherlock PL, Mckee M, Ebrahim S, Gorman M, Greengross S, Prince M, et al. Population ageing and health. Lancet. 2012;379(9823):1295-6.
4. Tavares DMS, Pelizaro PB, Pegorari MS, Paiva MM, Marchiori GF. Incapacidade funcional e fatores associados em idosos de área urbana: um estudo de base populacional. Rev Bras Cineantropom Desempenho Hum. 2016;18(5):499-508.
5. Gajardo J, Navarrete E, López C, Rodriguez J, Rojas A, Troncoso S. Percepciones de personas mayores sobre su desempeño en el uso de transporte público em Santiago de Chile. Rev Chil Ter Ocup. 2012;12(1):88-102.
6. Blanco PHM, Castilho MM, Blanco THM, Cortez LERC. Mobilidade urbana no contexto do idoso. Rev Cesumar Ciênc Hum Soc Aplic 2014;19(1):143-55.
7. Cesar CC, Mambrini JVM, Ferreira FR, Costa MFL. Capacidade funcional de idosos: análise das questões de mobilidade, atividades básicas e instrumentais da vida diária via teoria de resposta ao item. Cad Saúde Pública. 2015;31(5):931-45.
8. Silva NA, Pedraza DF, Menezes TN. Desempenho funcional e sua associação com variáveis
antropométricas e de composição corporal em idosos. Ciênc Saúde Coletiva. 2015;20(12):3723-32.
9. Freire Junior RC, Areas GPT, Areas FZS, Barbosa LG. Estudo da acessibilidade de idosos ao centro da cidade de Caratinga, MG. Rev Bras Geriatr Gerontol. 2013;16(3):541-58.
10. Lerner J, Ceneviva C. Avaliação comparativa das modalidades de transporte público urbano [Internet]. Brasília, DF: Associação Nacional das Empresas de Transportes Urbanos; 2009 [acesso em 25 jan. 2017]. Disponível em: http://www.ntu.org.br/novo/upload/ Publicacao/Pub635109537433018893.pdf
174
12. Clarke P, Gallagher NA. Optimizing mobility in later life: the role of the urban built environment for older adults aging in place. J Urban Health. 2013;90(6):997-1009.
13. Organização Mundial de Saúde. Classificação internacional de funcionalidade, incapacidade e saúde. Lisboa: OMS; 2004.
14. Castaneda L, Bergmann A, Bahia L. A classificação internacional de funcionalidade, incapacidade e saúde: uma revisão sistemática de estudos observacionais. Rev Bras Epidemiol. 2014;17(2)437-51.
15. Brucki SMD, Nitrini R, Caramelli P, Bertolucci PHF, Okamoto IH. Sugestões para o uso do mini-exame do estado mental no Brasil. Arq Neuropsiquiatr. 2003;61(3B):777-81.
16. Guralnik JM, Simonsick EM, Ferrucci L, Glynn RJ, Berkman LF, Blazer DG, et al. A Short physical performance battery assessing lower extremity function: association with self reported disability and prediction of mortality and nursing home admission. J Gerontol. 1994;49(2):85-94.
17. Nakano MM. Versão Brasileira da Short Physical Performance Battery-SPPB: adaptação cultural e estudo de confiabilidade [tese]. São Paulo: UNICAMP, Faculdade de Educação; 2007.
18. Marucci M, Barbosa A. Estado nutricional e capacidade física. In: Lebrão ML, Duarte YAO, organizadores. SABE – Saúde, Bem-estar e Envelhecimento. Projeto SABE no município de São Paulo: uma abordagem inicial. Brasília, DF: Organização PanAmericana da Saúde; 2003. p. 93-118
19. Franchignoni F, Horak FB, Godi M, Nardone A, Giordano A. Using psychometric techniques to improve the balance evaluation systems test: The Mini-BESTest. J Rehabil Med. 2010;42(4):316-24.
20. Maia AC. Tradução e adaptação para o português – Brasil do Balance Evaluation systems test e do Mini-BESTest e análise de suas propriedades psicométricas em idosos e indivíduos com doença de Parkinson [dissertação]. Minas Gerais: Universidade Federal de Minas Gerais; 2012.
21. Duncan RP, Leddy AL, Cavanaugh JT, Dibble LE, Ellis TD, Ford MP, et al. Comparative utility of the BESTest, mini-BESTest, and brief-BESTest for predicting falls n individuals with Parkinson disease: a cohort study. Phys Ther. 2013;93(4):542-50.
22. Sheikh JI, Yesavage JA. Geriatric depression scale (GDS): recent evidence and development of a shorter version. Clin Gerontol. 1986;5:165-73.
23. Paradela EMP, Lourenço RA, Veras RP. Validação da escala de depressão geriátrica em um ambulatório geral. Rev Saúde Pública. 2005;39(6):918-23.
24. Blay S, Ramos LR, Mari JJ. Validity of a Brazilian version of the Older Americans Resources and Services (OARS) mental healthscreening questionnaire. J Am Geriatr Soc. 1988;36(8):687-92.
25. Camargos FFO, Dias RC, Dias JMD, Freire MTF. Adaptação Transcultural e avaliação das propriedades psicométricas da Falls EficacyScale – International em idosos brasileiros (FES-I). Rev Bras Fisioter. 2010;14(3)237-43.
26. Van WB. The Participation Scale: measuring a key concept in public health. Disabil Rehabil 2006;28(4):193-203.
27. Clarke P, Ailshire J, Lantz P. Urban built environments and trajectories of mobility disability: findings from a national sample of community-dwelling American adults (1986-2001). Soc Sci Med. 2009;69(6):964-70.
28. Choi N, Dinitto DM. Depressive symptoms among older adults who do not drive: association with mobility resources and perceived transportation barriers. Gerontologist. 2015:1-12.
29. Bryanton O, Lees W, Lees J. Supporting older women in the transition to driving cessation. Act Adapt Aging. 2010;34(3):181-95.
30. Webber SC, Porter MM, Menec VH. Mobility in older adults: a comprehensive framework. Gerontologist. 2010;50(4):443-50.
31. Giacomin KC, Firmo JOA. Velhice, incapacidade e cuidado na saúde pública. Ciênc Saúde Coletiva. 2015;20(12):3631-40.
32. GasparottoLPR, Falsarella GR, Coimbra AMV. As quedas no cenário da velhice: conceitos básicos e atualidades da pesquisa em saúde. Rev Bras Geriatr Gerontol. 2014;17(1):201-9.
33. Pereira RHM, Carvalho CHR, Souza PHGF, Camarano AA. Envelhecimento populacional, gratuidades no transporte público e seus efeitos sobre as tarifas na região metropolitana de São Paulo. Rev Bras Est Pop. 2015;32(1):101-20.