Balanced Cardiovascular Disease Mortality from
1980 to 1999 - Brazil
Gláucia Maria Moraes Oliveira, Nelson Albuquerque Souza e Silva, Carlos Henrique Klein
Universidade Federal do Rio de Janeiro, Escola Nacional de Saúde Pública e Secretaria de Estado de Saúde do Rio de Janeiro - Rio de Janeiro, RJ - Brazil
O
BJECTIVETo compare trends in mortality rates from cardiovascular diseases (CVD), ischemic heart diseases (IHD) and cerebrovascular diseases (CBVD) in the States of Rio de Janeiro (RJ), São Paulo (SP) and Rio Grande do Sul (RS) and respective capitals, from 1980 to 1999.
M
ETHODSData regarding CVD deaths were obtained from Datasus, and those regarding populations were obtained from IBGE. Crude and sex and age-adjusted mortality rates were calculated using the direct method (standard population: State of Rio de Janeiro’s population twenty years of age or older in 2000). Because of the relevant increase in mortality from ill-defined causes in the city and State of RJ as of 1990, the deaths were balan-ced prior to adjustments. The trends were analyzed using linear regressions.
R
ESULTSAnnual declines of balanced and adjusted mortality ranged from -11.3 CVD deaths/100,000 inhabitants in the city and State of RJ to -7.4 in the city of SP. IHD mortality rates were similar in the State and city of RJ and in Porto Alegre, and lower in the city of SP (-2.5 deaths/100,000 inhabitants). CBVD mortality rates ranged from -6.0 to -2.8 deaths/100,000 inhabitants in the State of RJ and in Porto Alegre, respectively.
Mailing Address:Gláucia Maria Moraes Oliveira • Rua Fadel Fadel, 112/1204 - 22430-170 - Rio de Janeiro, RJ - Brazil
E-mail: [email protected] Received: 04/26/05 • Accepted: 06/14/05
C
ONCLUSIONA decline in balanced and adjusted CVD, IHD and CBVD mortality rates was observed from 1980 to 1999 in the three States and capitals. In the State and city of RJ declines in IHD were clear as of 1990, whereas declines in CBVD occurred throughout the period studied.
K
EYWORDSAs of the late 1960’s and early 1970’s, a decline in cardiovascular disease (CVD) mortality started to be observed in industrialized countries, especially in the United States, Canada and Western European countries. Despite the decrease trend in these mortality rates, CVD are the major causes of death in developed or developing countries1,2, and also in Brazil3,4. Thus, in 1998, CVD
accounted for 26.5% of deaths in Brazil5.
In Brazil, this decrease trend in CVD mortality rates was verified in studies conducted in the State and city of São Paulo6,7, and later in capitals like Salvador8 and Goiânia9. A
better control of risk factors, especially of high blood pressure, and new diagnostic techniques, in addition to advances in therapy, were considered the main responsible factors for the reduction in these mortality rates10-14.
In the Southeastern region, in 1996, CVD accounted for 30.8% of deaths, followed by external causes (13.5%)
and neoplasias (12.4%)5. Among CVD, we point out
cerebrovascular diseases (CBVD) and ischemic heart diseases (IHD) which accounted for more than 60% of CVD death rates in Brazil in 19984. In the State of Rio
Grande do Sul, as well as in its capital, Porto Alegre, CVD were also the major causes of mortality in 30% to 35% of deaths in the past thirty years15.
Souza et al16 study on the trend of CVD death risk in
the five Brazilian regions, from 1979 to 1996, corroborated most of the findings described above. These authors demonstrated a decrease trend in CVD mortality in the Southern, Southeastern and Northern regions in all age ranges and for both sexes.
Mansur et al3 further studied CVD, IHD and CBVD
mortalities from 1980 to 1998 in eleven capitals of the five great regions, and observed a decrease in the majority of the capitals. Rio de Janeiro and Porto Alegre showed reductions in CVD, IHC and CBVD death risk. However, São Paulo had a slight increase in IHD for both sexes in the age range from 30 to 39 years among men, and 40 to 59 years among women. The authors pointed out the significant decreases in CVD, IHD and CBVD in Rio de Janeiro.
Although these authors mention high mortality rates from ill-defined causes in the Northeastern, Northern and Central-Western regions16, they do not mention the
increasing mortality rate from this group of causes in Rio de Janeiro as of 1990 and its influence on the trends observed in mortality rates from defined causes.
The development of a health information system composed of a reliable database for analysis is key to managerial decision making targeted at defining priorities, strategies and actions toward population health improvement17.
The main objective of this study is to outline the progression of mortality from CVD and its components – IHD and CBVD, in the State of Rio de Janeiro (RJ), and to compare this progression to that observed in the States of Rio Grande do Sul (RS) and São Paulo (SP), using the historical case series from 1980 to 1999, by means of a uniform methodology of data analysis.
M
ETHODS
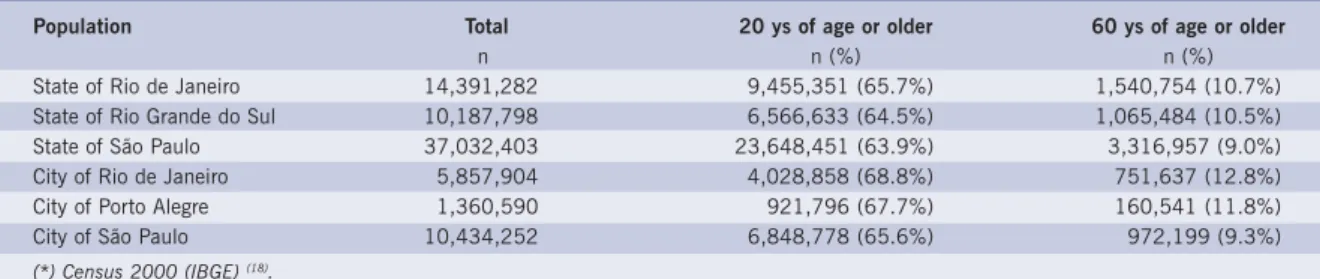
This is an ecologic study of historical series, with data from 1980 to 1999, which was the last year with data available at the time of the study. Cardiovascular disease mortality was analyzed in the States of Rio de Janeiro, São Paulo and Rio Grande do Sul, as well as in the respective capitals, among the adult population twenty years of age or older. Table I shows the total, adult and elderly populations in the locations studied in the year 2000.
Data regarding the populations used to calculate mortality rates were obtained from the Instituto Brasileiro
de Geografia e Estatística (IBGE) – Brazilian Institute of
Geography and Statistics – based on censuses 1970, 1980, 1991 and 2000, and on the 1996 population count18, using Lagrange method to calculate populations
on July, 1st, for intercensus years from 1980 to 199919.
Data regarding annual frequencies of CVD deaths from 1980 to 1999 were obtained from Datasus System, Ministry of Health20. The codes from the International
Classification of Diseases, 9th Revision Conference, 197521 (ICD 9) were used for deaths occurring from 1980
to 1995, as follows: IHD – 410 to 414, CBVD – 430 to 438, and CVD – 390 to 459. For deaths from 1996 to 1999 the codes for IHD – I20 to I25, CBVD - I60 to 69, and CVD – I10 to I82.9 from the International Classification of Diseases, 10th Revision Conference22,
1995 (ICD 10) were used.
The population was stratified according to sex and age groups (20-29; 30-39; 40-49; 50-59; 60-69; 70-79, and 80 or older), and crude and adjusted (for sex and age) mortality rates were then calculated using the direct method. The State of Rio de Janeiro’s population twenty years of age or older in the year 2000, based on the census 2000, was used as the standard population for the adjustment. The justification for this procedure was the different sex and age distributions observed in the locations studied (Table I).
Table I - Populations of the States and respective capitals in the year 2000(*)
Population Total 20 ys of age or older 60 ys of age or older
n n (%) n (%)
State of Rio de Janeiro 14,391,282 9,455,351 (65.7%) 1,540,754 (10.7%)
State of Rio Grande do Sul 10,187,798 6,566,633 (64.5%) 1,065,484 (10.5%)
State of São Paulo 37,032,403 23,648,451 (63.9%) 3,316,957 (9.0%)
City of Rio de Janeiro 5,857,904 4,028,858 (68.8%) 751,637 (12.8%)
City of Porto Alegre 1,360,590 921,796 (67.7%) 160,541 (11.8%)
City of São Paulo 10,434,252 6,848,778 (65.6%) 972,199 (9.3%)
(*) Census 2000 (IBGE) (18).
Table II - Crude mortality rates among adults twenty years of age or older from CVD, IHD, CBVD, ill-defined causes, and all causes per 100,000 inhabitants in the States and respective capitals
in the two decades of the historical series
Cause Decade States Capitals
RJ SP RS Rio S. Paulo P. Alegre
IHD 1980-1989 165.2 126.5 133.9 192.2 135.2 169.0
1990-1999 128.6 113.8 130.3 150.8 134.0 151.0
CBVD 1980-1989 188.6 128.9 138.5 190.2 114.9 124.1
1990-1999 150.7 104.3 127.4 149.5 98.8 118.7
CVD 1980-1989 493.4 377.7 386.6 522.0 361.2 405.3
1990-1999 412.3 337.6 366.1 434.7 347.5 380.6
Ill-Defined 1980-1989 45.3 50.9 83.4 26.0 11.0 18.5
Causes 1990-1999 110.5 50.2 44.2 110.6 10.5 11.4
All 1980-1989 1098.8 907.5 937.9 1138.9 861.4 961.3
Causes 1990-1999 1157.2 956.2 988.7 1237.2 957.2 1053.0
Table II shows crude mortality rates from CVD, IHD, CBVD, ill-defined causes and all causes in the States and respective capitals. Decreases in crude rates of CVD, CBVD and IHD were observed in the three States and their capitals. The State and city of Rio de Janeiro had the highest crude rates in the first decade, and by the end of the second decade they had all the rates higher than those of the other two States and respective capitals, except for IHD.
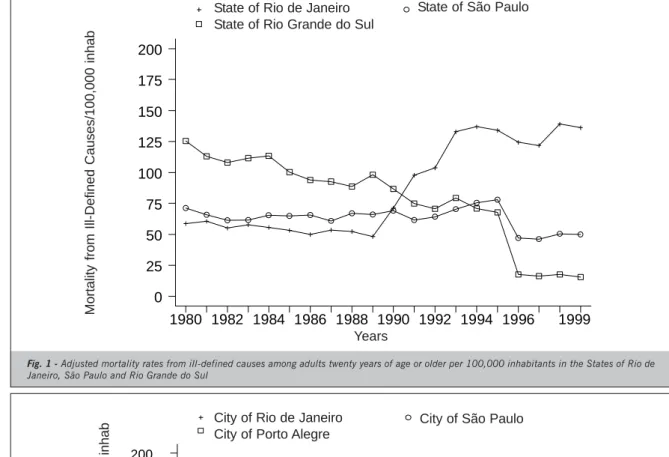
Deaths from ill-defined causes had different distri-butions in the States and cities studied. In the State and city of São Paulo mortality rates remained constant. In Rio Grande do Sul and Porto Alegre crude mortality rates from ill-defined causes decreased at more than 50% from the 1980’s to the 1990’s. However, this mortality rate had a more than twofold increase in the State of Rio de Janeiro and a four-fold increase in the city of Rio de Janeiro from the first to the second decade. Furthermore, the levels of mortality rates from ill-defined causes had a considerable variation among the States and cities. The State and city of Rio de Janeiro had the highest rates, especially in the 1990’s, in which the city of Rio de Janeiro’s rates are ten-fold higher than those of the other two capitals (Fig. 1 and 2).
We can observe that while mortality rates from ill-defined causes were stable in the State of São Paulo they had a progressive decrease in the State of Rio Grande do Sul and in Porto Alegre, and an increase in the city and State of Rio de Janeiro as of 1990. In Porto Alegre, the stability of these rates was only affected by an increase The adjustment by standardization was performed
after this balance; therefore, the resulting mortality rates were now called “balanced and adjusted” rates.
The balanced and adjusted mortality rates were used for the analysis of mortality trends. The rates were estimated using linear regression models, considering the balanced and adjusted CVD, IHD and CBVD mortality rates observed as dependent variables Y, and the calendar years of the study as independent variables X. Mean rates of the period studied correspond to the mean point between the years 1989 and 1990.
The models were represented as follows: Y = a + bX,
where Y is the estimated balanced and adjusted rate; a
is the mean rate in the period; b is the mean annual variation (slope of the line) and X is the year (year 0 = 1980, and year 19 = 1999).
The proportions of total variances explained by the models are expressed in r2 (variation from 0 to 1). The
annual variation percentages were calculated from the b/ a ratios.
The STATA software23 was used to adjust rates and
other quantitative procedures.
R
ESULTS
The city of Rio de Janeiro, as shown in Table I, has an age profile with a higher percentage of elderly than those of São Paulo and Porto Alegre. The same was observed in the comparison among the States.
^
M
o
rt
al
id
ad
e por
Ca
us
as M
a
l D
e
fi
ni
da
s/
10
0 m
il hab.
Anos
Mun.do Rio de Janeiro Mun.de São Paulo Mun.de Porto Alegre
1980 1982 1984 1986 1988 1990 1992 1994 1996 1999 0
25 50 75 100 125 150 175 200
City of Rio de Janeiro City of Porto Alegre
City of São Paulo
in the last few years of the 1980’s, to drop again in the beginning of the 1990’s.
Table III shows the values of balanced and adjusted mortality rates estimated by linear regression models. The linear models were able to explain satisfactorily the total variance (r2 = 0.77 to 0.95).
We observed that estimated annual declines in balanced and adjusted mortality rates, both in the capitals and in the States of Rio de Janeiro, São Paulo and Rio Grande do Sul, ranged from -11.3 CVD deaths per 100,000 inhabitants in the city and State of Rio de Janeiro
Fig. 2 - Adjusted mortality rates from ill-defined causes among adults twenty years of age or older per 100,000 inhabitants in the cities of Porto Alegre, Rio de Janeiro, and São Paulo
Mo
rt
al
idad
e
por
Ca
u
s
as
M
a
l Defi
nidas
/100 mi
l hab
.
Anos
Est.do Rio de Janeiro Est.de São Paulo Est.do Rio Grande do Sul
1980 1982 1984 1986 1988 1990 1992 1994 1996 1999 0
25 50 75 100 125 150 175 200
Fig. 1 - Adjusted mortality rates from ill-defined causes among adults twenty years of age or older per 100,000 inhabitants in the States of Rio de Janeiro, São Paulo and Rio Grande do Sul
State of Rio de Janeiro State of Rio Grande do Sul
State of São Paulo
to -7.4 deaths per 100,000 inhabitants in the city of São Paulo. For IHD the declines were similar in the State of Rio de Janeiro and its capital, as well as in Porto Alegre, and the lowest decline occurred in the city of São Paulo (-2.5 deaths per 100,000 inhabitants). For CBVD the variation observed is from -6.0 deaths per 100,000 inhabitants in the State of Rio de Janeiro to -2.8 deaths per 100,000 inhabitants in Porto Alegre (Table III).
The annual variation percentage of estimated mortality rates showed a decrease in CVD, and even in its components – IHD and CBVD. CBVD predominated in
Years
Mort
ality from Ill-Defined Causes/100,000 inhab
Years
Mort
M
o
rt
al
idade po
r
D
IC
/100 m
il h
a
b
Anos
Est.do Rio de Janeiro Est.de São Paulo Est.do Rio Grande do Sul
1980 1982 1984 1986 1988 1990 1992 1994 1996 1999 0
50 100 150 200 250 300
State of Rio de Janeiro State of Rio Grande do Sul
State of São Paulo
the State (217.4/100,000 inhabitants) and city of Rio de Janeiro (192.9/100,000 inhabitants) in relation to the other States and capitals. The same was observed for IHD to a lesser extent.
Figures 3 to 6 show balanced and adjusted IHD and CBVD mortality rates in the States and capitals.
The State and city of Rio de Janeiro had the highest CVD mortality rates in the period, followed by the State and city of São Paulo. The State of Rio Grande do Sul and its capital Porto Alegre had the lowest rates. The State of Rio de Janeiro had the highest balanced and adjusted IHD mortality rates until 1990, getting closer to the other States by the end of the historical series (Fig. 3). Balanced and adjusted IHD mortality rates were similar in the capitals.
The State of Rio de Janeiro had the highest balanced and adjusted CBVD mortality rates throughout the period
studied. However, the decline trend in these rates was slightly more significant in the States of São Paulo and Rio Grande do Sul (Table III and Fig. 5). These two States, São Paulo and Rio Grande do Sul, had very similar CBVD mortality rates. The same pattern in the States is observed in the comparison between the capitals (Fig. 6). Although the rates for the city of Rio de Janeiro had been higher, its decline trend was also higher and by the end of the period balanced and adjusted CBVD mortality rates get closer.
D
ISCUSSION
In the past twenty years several studies have shown decline trends in CVD mortality, initially in the United States, Canada and Australia in the early 1960’s, followed by England, Germany and Denmark in the first half of the 1970’s, and France, Italy and Sweden in the second half of the 1970’s2,24,25.
Fig. 3 - Balanced and adjusted CVD mortality rates among adults twenty years of age or older per 100,000 inhabitants in the States of Rio de
Janeiro, São Paulo and Rio Grande do Sul(*) (*) standard: population of the State of Rio de Janeiro in 2000
Table III - Annual balanced and adjusted mortality rate statistics estimated for CVD, IHD and CBVD in the States of Rio de Janeiro, Rio Grande do Sul and São Paulo and respective capitals per 100,000
inhabitants among adults twenty year of age or older from 1980 to 1999
Causes Statistics(*) States Capitals
RJ SP RS Rio S. Paulo P. Alegre
IHD Mean(M) 183.4 168.8 166.2 192.2 185.2 188.2
Ann. Dif. (AD) -4.3 -3.3 -2.6 -4.6 -2.5 -4.5
AD/M -2.3% -2.0% -1.6% -2.4% -1.3% -2.4%
r2 0.85 0.95 0.81 0.82 0.83 0.77
CBVD Mean(M) 217.4 167.3 173.6 192.9 148.2 142.7
Ann. Dif. (AD) -6.0 -5.1 -4.3 -5.9 -4.0 -2.8
AD/M -2.8 % -3.0% -2.4 % -3.0 % -2.7% -2.0%
r2 0.94 0.94 0.91 0.95 0.90 0.81
CVD Mean(M) 572.3 506.5 484.1 538.2 486.4 460.4
Ann. Dif. (AD) -11.3 -10.1 -9.8 -11.3 -7.4 -9.5
AD/M -2.0 % -2.0% -2.0% -2.1 -1.5 % -2.1%
r2 0.91 0.92 0.88 0.92 0.87 0.88
(*)Values obtained with linear regression of balanced and adjusted values over the years, where M corresponds to the middle of the period and AD to the slope of the line. M and AD in scale of deaths per 100,000 inhabitants (balanced by adding the corresponding proportion of ill-defined deaths and adjusted for gender and age group using the direct method, using the population of the State of Rio de Janeiro in the year 2000 as a standard)
Years
DIC mort
ality / 100,000 inhabit
ant
In Brazil several studies of CVD mortality regarding data as of the 1970’s have been published3,5,6-9,13,16,26.
Laurenti et al27,in 1981, signaled the increase in CVD,
which represented the major basic causes of death (16.7%) among adults from 15 to 74 years of age in the city of São Paulo. They also concluded that information obtained from death documents (DD) had a reasonably safe correlation with data obtained from case analysis (75.3% sensitivity and 95.8% specificity). In another study, these authors drew the attention to the predominance of CBVD over IHD in several Brazilian capitals, with CBVD death rates similar to those observed in Japan, even for the male gender28.
Chor et al26 compared mortality in Brazil to those
observed in the United States, England and Cuba in 1988, and verified that approximately 50% of IHD deaths among men occurred before the age of 65 in Brazil versus 25%
in those countries. Nevertheless, it is necessary to consider that the Brazilian population is younger than that of those countries, as the authors have pointed out. Acute myocardial infarction (AMI) mortality rate in Brazil was comparable to that found in the Eastern European countries until the 1990’s, whose mortality rates were among the highest in the world. The same occurred for CBVD death risk, which was even higher in Brazil, compared to the United States, and also similar to the rates found in Eastern Europe26.
According to Lolio et al29, there was an increase trend
in IHD mortality rates among adults older than twenty years of age in the city of São Paulo from 1950 to 1976, followed by a decrease from then on. This trend was higher among women and younger individuals29. From 1970 to
1983 an average 28% reduction was observed for IHD and 16% for CBVD in the age range from 40 to 69 years.
M
or
ta
lidad
e
po
r D
IC
/
100
m
il
h
ab
Anos
Mun.do Rio de Janeiro Mun.de São Paulo Mun.de Porto Alegre
1980 1982 1984 1986 1988 1990 1992 1994 1996 1999 0
50 100 150 200 250 300
City of Rio de Janeiro City of Porto Alegre
City of São Paulo
Fig. 4 - Balanced and adjusted IHD mortality rates among adults twenty years of age or older per 100,000 inhabitants in the cities of Rio de Janeiro,
São Paulo and Porto Alegre(*) (*) standard: population of the State of Rio de Janeiro in 2000
M
o
rt
a
lid
ad
e por
D
C
B
V
/1
00
m
il h
a
b
Anos
Est.do Rio de Janeiro Est.de São Paulo Est.do Rio Grande do Sul
1980 1982 1984 1986 1988 1990 1992 1994 1996 1999 0
50 100 150 200 250 300
State of Rio de Janeiro State of Rio Grande do Sul
State of São Paulo
Fig. 5 - Balanced and adjusted CBVD mortality rates among adults twenty years of age or older per 100,000 inhabitants in the States of Rio de
Janeiro, São Paulo and Rio Grande do Sul(*) (*) standard: population of the State of Rio de Janeiro in 2000
Years
DIC mort
ality/100,000 inhabit
ant
s
Years
CBVD mort
ality/100,000 inhabit
ant
However, these rates were still high when compared to those of the 27 industrialized countries, after standardization with age adjustment for both genders13.
From 1979 to 1989, IHD and CVD were studied in the capitals of Brazilian metropolitan regions. Different declines were observed in the several capitals30. However, the
authors showed increases in CVD mortality rates in Rio de Janeiro, +1.4% among men and +0.8% among women. IHD mortality rates also increased in Rio de Janeiro, +2.3% among men and +2.5% among women. We should observe that Rio de Janeiro was the only capital studied that had an increase trend of CVD and IHD in this period.
In our study, the city and State of Rio de Janeiro had the highest CVD and CBVD mortality rates in the period. However, the decline trend of these rates, both in the State and in the city, was more prominent in Rio than in the other States and capitals, and by the end of the period the rates were equivalent among capitals. Also, the State of Rio de Janeiro had the highest balanced and adjusted IHD mortality rates until 1990, getting closer to the other States by the end of the historical case series. However, balanced and adjusted IHD mortality rates were similar in the capitals. Careful observation of balanced and adjusted CVD (Table II) and IHD (Table II, Fig. 3 and 4) mortality rates shows that both in the State and in the city of Rio de Janeiro these rates remained stable from 1980 to 1989, to start declining in the following decade. On the other hand balanced and adjusted CBVD mortality rates had a decline in Rio de Janeiro, State and city, as of the first few years of the historical case series of data available for our study (Fig. 5 and 6). Therefore, it is possible to assume that the increase in CVD and IHD rates occurred in the 1970’s, with a stabilization in the following decade and a decline in the 1990’s.
Lolio & Laurenti31, studying CBVD mortality among
adults older than 20 years of age in the city of São Paulo from 1950 to 1981 observed an increase in mortality in
the 1950’s and 1960’s in the group of individuals above 20 years of age, followed by a decline between 1970 and 1981, which was more significant in the age groups above sixty years of age for both genders. This decline was confirmed in the present study in the city and State of São Paulo with mean annual variation percentages of -2.7% and -3.0%, respectively.
Mansur et al3 observed decline trends in CVD, IHD
and CBVD mortality rates for both genders in Brazil from 1979 to 1996. Reductions observed per 100,000 inhabitants were: IHD – almost twofold higher among men, 2.94 versus 1.67 deaths/year among women; CBVD – approximately three deaths/year; CVD – eight deaths/ year, the two latter for both genders. The decline in IHD mortality rates occurred only as of 1985, with a progressive decrease until 1995, unlike in the United States, where the rates started declining in 1960 and remained declining ever since. However, according to these authors, CBVD mortality rates among men and women in Brazil have always been lower than those recorded in the countries participating in the MONICA study8. The same cannot be said for the State of Rio de
Janeiro according to our study.
We draw the attention to the quality of information on mortality, which can be evaluated by mortality from ill-defined causes. We point out the increase in mortality from ill-defined causes in the State and city of Rio de Janeiro as of 1990, which incidentally made us work with balanced mortality rates from the defined causes studied (CVD, IHD and CBVD) adjusted by sex and age to compare States and cities. This increase observed in the State and city of Rio de Janeiro may be related to the January 29, 1990 Regulation, which determined that “if all attempts to determine the basic cause of death have been exhausted, and if a violent death (accident, homicide or suicide) is not suspected, undetermined cause shall be declared in part 1 of the death declaration”32. This
M
or
ta
lidad
e
po
r D
C
B
V
/1
00 m
il h
ab
Anos
Mun.do Rio de Janeiro Mun.de São Paulo Mun.de Porto Alegre
1980 1982 1984 1986 1988 1990 1992 1994 1996 1999 0
50 100 150 200 250 300
Fig. 6 - Balanced and adjusted CBVD mortality rates among adults twenty years of age or older per 100,000 inhabitants in the cities of Rio de
Janeiro, São Paulo and Porto Alegre(*) (*) standard: population of the State of Rio de Janeiro in 2000
City of Rio de Janeiro City of Porto Alegre
City of São Paulo
Years
CBVD mort
ality/100,000 inhabit
ant
regulation is probably one of the factors that influenced the filling out of documents of death of undetermined causes in the State of Rio de Janeiro.
It is also possible that even with the procedure we performed to balance the “losses” of CVD deaths and its components, IHD and CBVD, the true “strength” of mortality from these groups of causes is still underestimated especially in Rio de Janeiro. In the present study we considered that the proportions of CVD deaths among those declared as from undetermined cause, and therefore ill-defined, were the same as those observed for CVD among all deaths with a defined cause by age group and gender. However, we also observed that CVD were the only large group of causes that had a significant decrease in crude mortality among adults twenty years of age or older when the 1990’s were compared to the 1980’s in the city of Rio de Janeiro (- 87.5 per 100,000 inhabitants). Maybe not coincidentally, mortality from ill-defined causes was the one that grew the most in the city of Rio de Janeiro in the comparison of the same decades among adults twenty years of age or older, at a similar level (+84.6 per 100,000 inhabitants) to that of the decrease of CVD. Therefore, maybe an even larger number of ill-defined deaths should have been incorporated to those of CVD and its components – IHD and CBVD- as a balance, so that the decrease trends of these groups of causes would not be so sharp in Rio de Janeiro, especially when compared to those experienced by São Paulo, Rio Grande do Sul and respective capitals. This issue deserves further investigations to clarify the true causes of ill-defined deaths in the past, and measures to prevent its occurrence in the future.
There is an attempt to attribute this reduction observed in the other studies to the control of known cardiovascular risk factors (high blood pressure, smoking, obesity, diabetes mellitus, dyslipidemias, sedentary lifestyle, and
others). In Rio de Janeiro the prevalence of high blood pressure observed, for instance, in the Ilha do Governador study, was 38% among the adult population, and blood pressure levels were controlled in only 10% of individuals with hypertension, whereas smoking ranged from approximately 30% among the high-income population to 50% among males in the low socioeconomic level33.
The City of Rio de Janeiro High Blood Pressure Control Program34, that has already reached almost three hundred
thousand patients recorded in more than ten years of existence, controls only 19% of the target population of patients with high blood pressure. Diabetes, which affects approximately 8.7% of women and 5.8% of men older than thirty years of age, has also poor control rates, especially among the population in the lower socioeconomic level, where two thirds are not aware of
their condition35. Hypercholesterolemia affects
approximately one third of the adult population36. Also,
these risk factors are known to occur more frequently among the low-income and low-education population37.
We can broaden the explanation for the progressive and slight reduction of CVD mortality in the past two decades in the States of RJ, SP and RS with the improvement of life conditions of the populations, with more cities being served by water and sewerage systems and a subsequent reduction in IHD.
An intense educational process for the middle class has to be developed to show the importance of the correct knowledge of the cause of death for managerial decision-making in health. Concurrently, pathology services, mainly in public hospitals, need to be reactivated or re-equipped to be able to play their key role in the characterization of the causes of deaths. This explanation is key because we can also assume that there are deaths declared as from myocardial infarction or stroke that have actually been wrongly declared due to lack of corroboration.
R
EFERENCES
1. American Heart Association. Heart and Stroke Facts, 1998. Dallas: AHA, 1998.
2. Uemura K & Pisa Z. Recent trends in cardiovascular disease mortality in 27 industrialized countries. Wld Hlth Statist Quart 1985; 38:142-62.
3. Mansur AP, Favarado D, Souza MFM, Avakian SD, Aldrighi JM, César LAM et al. Tendência da mortalidade por doenças circulatórias no Brasil de 1979 a 1996. Arq Bras Cardiol 2001; 76:497-503.
4. Ministério da Saúde. Guia de Vigilância Epidemiológica. 4a ed.
Brasília, 1998.
5. Ministério da Saúde. Guia de Vigilância Epidemiológica. 3a ed.
Brasília, 1996.
6. Lotufo PA, Lolio CA. Tendência da mortalidade por doença isquêmica do coração no Estado de São Paulo: 1970 a 1989. Arq Bras Cardiol 1993; 61:149-53.
7. Lolio CA, Souza JMP, Laurenti R. Decline in cardiovascular disease mortality in the city of S.Paulo, Brazil, 1970 to 1983. Rev Saúde Pública 1986; 20:454-64.
8. Passos LC, Lopes AA, Lessa I, Sanches A, Santos-Jesus R. Tendência da mortalidade por infarto do miocárdio (1981 a 1996) na cidade de Salvador, Brasil. Arq Bras Cardiol 2000; 74:329-31.
9. Moraes SA, Rezende MHV, Freitas ICM. Tendência da mortalidade por doença isquêmica do coração no município de Goiânia - Brasil na série histórica entre 1980 e 1994. Arq Bras Cardiol 2000; 74:493-7.
10. Walter WJ. Changing U.S. Lifestyle and declining vascular mortality. A retrospective. N Engl J Med 1983; 308:649-51.
11. Kuuslasmaa K, Tunstall-Pedoe H, Dobson A, Fortmann S, Sans S Tolonen H. Estimation of contribution of changes in classic risk factors to trens in coronary-event rates across the WHO MONICA Project populations. Lancet 2000; 355:675-87.
12. Collins R, Peto R, MacMahon S, Hebert P, Fiebach NH, Eberlein KA et al. Blood pressure, stroke, and coronary heart disease Part 1. Prolonged differences in blood pressure: prospective observational studies corrected for the regression dilution bias. Lancet1990; 335:827-38.
13. Eluf-Neto J, Lotufo PA, Lólio CA. Tratamento da hipertensão e declínio da mortalidade por acidentes vasculares cerebrais. Rev Saúde Pública de São Paulo 1990; 24:332-6.
15. Secretaria de Saúde do Rio Grande do Sul [homepage na Internet] [acesso em dezembro de 2001]. Informações de Saúde. Morbidade e informações epidemiológicas. Disponível em <http:// www.saude.rs.gov.br>
16. Souza MFM, Timerman A, Serrano Jr CV, Santos RD, Mansur AP. Tendência do risco de morte por doenças circulatórias nas cinco regiões do Brasil no período de 1979 a 1996. Arq Bras Cardiol 2001; 77:562-68.
17. Moraes IHS, Santos SRFR. Informações em saúde: os desafios continuam. Ciências & Saúde Coletiva 1998; III(1): 37-51 18. Instituto Brasileiro de Geografia e Estatística [homepage na Internet].
Censo 2000. [acesso em dezembro de 2001] Disponível em: http:/ /www.ibge.gov.br
19. Cláudio DM, Martins JM. Cálculo numérico populacional. São Paulo: Atlas, 1989.
20. Ministério da Saúde [homepage na Internet]. Secretaria Executiva. DATASUS. [acesso em dezembro de 2001]. Informações de Saúde. Morbidade e informações epidemiológicas. Disponível em: http:// www.datasus.gov.br
21. Organização Mundial de Saúde - Manual da Classificação Internacional de Doenças, Lesões e Causas de Óbitos, 9a Revisão,
1975, São Paulo, Centro da OMS para Classificação das Doenças em Português, 1978.
22. Organização Mundial de Saúde. Classificação estatística internacional de doenças e problemas relacionados à saúde: Classificação Internacional de Doenças -10 a Revisão. São Paulo:
Edusp, 1995:1.
23. Statistics/Data Analysis -STATA Corporation: STATA, Version 7, University of Texas, USA, 2000, CD-ROM.
24. Thom TJ. International mortality from heart disease: rates and trends. Int J Epidemiol 1989; 18(supp.1):S20-S28.
25. Havlik RJ, Feinleib M, eds. Proceeding of the Conference on the Decline in Coronary Heart Disease Mortality. Bethesda, National Institute of Health 1979 (NIH publ 79-1610)
26. Chor D, Fonseca MJ, Andrade CR. Doenças Cardiovasculares.
Comentários sobre a Mortalidade Precoce no Brasil.Arq Bras Cardiol 1995; 64:15-9.
27. Laurenti R, Gotlieb SL, Souza JMP, Fonseca LAM, Jorge MHPM. Características da mortalidade por doença isquêmica do coração em adultos de 15 a 74 anos no município de São Paulo. Arq Bras Cardiol 1981;36:85-9.
28. Laurenti R. Epidemiologia das doenças cardiovasculares no Brasil. Arq Bras Cardiol 1982; 38:243-8.
29. Lolio CA, Laurenti R. Mortalidade por doença isquêmica do coração no município de São Paulo. Evolução de 1950 a 1981 e mudanças recentes na tendência. Arq Bras Cardiol1986; 46:153-6.
30. Lolio CA, Lotufo PA, Lira AC, Zanetta DM, Massad E. Tendência da Mortalidade por Doença Isquêmica do Coração nas Capitais de Regiões Metropolitanas do Brasil, 1979-89.Arq Bras Cardiol1995; 64:195-9.
31. Lolio CA, Laurenti R. Tendência da mortalidade por doença cerebrovascular em adultos maiores de 20 anos no município de São Paulo (Brasil), 1950 a 1981.Rev Saúde Pública S Paulo1986; 20:243-6.
32. Portaria número 550 de 23 de Janeiro de 1990, publicada no Diário Oficial de 29 de janeiro de 1990.
33. Klein CH, Silva NAS, Nogueira AR, Campos LHS, Bloch KV.Hipertensão arterial na Ilha do Governador-Rio de Janeiro-Brasil II. Cad. Saúde Pública (reports in Public Health) 1995; 11:389-94.
34. Ramos ACMF, Seixas TC, Rocha CRM, Monteiro GT, Farias AMR. Avaliação Transversal do Controle da Hipertensão Arterial Sistêmica em Programa de Larga Escala. JBM2001; 81:63-70.
35. Franco L. Diabetes in Brazil: a review of recent survey data. Ethnicity and Disease 1992; 2:158-65.
36. Souza LJ, Chalita FEB, Reis AFF, Teixeira CL, Giocavate Neto C Bastos DA et al. Obesidade e fatores de risco cardiovascular em Campos-RJ. Arq Bras Cardiol 2002; 79(supl III):70.