AR
TICLE
1 Departamento de Epidemilogía Clínica, Instituto Nacional de Geriatría. Periférico Sur No. 2767, Colonia San Jerónimo Lídice. 10200 Delegación Magdalena Contreras Distrito Federal México. marcela.agudelo.botero@ gmail.com
2 Departamento de Estudios de Población, El Colegio de La Frontera Norte.
Avoidable mortality in the states adjacent
to the Mexico-United States border; 1999-2001 and 2009-2011
Abstract The scope of this article is to measure the effect of avoidable mortality in changes in life expectancy in the states adjacent to both sides of the US-Mexico border between 1999-2001 and 2009-2011. The data used were the records of mortality and population censuses from official sources in each country. Standardized mortality rates were estimated and the expected years of life lost were calculated. Both in 1999-2001 and in 2009-2011 the states belonging to the south-ern border of the United States had lower rates of avoidable mortality rates than those observed in the northern states of Mexico. In the border region avoidable deaths have seen an averagein-crease of 0.19 years of life for America and a loss of 0.47 years of life for Mexico. The states of the US-Mexico border have common features in their health profiles that make it necessary to address some problemson a global basis and consider the particularities of each, in order to reduce gaps and enhance social equity through strategies involv-ing independent national actions and othersby cross-border coordination.
Key words Mortality, Life expectancy, Border, Mexico, United States
Marcela Agudelo Botero 1
Raúl Sergio González Ramírez 2
B
ot
e
Introduction
The United Stated (U.S.)-Mexico border is char-acterized by a wide variety of economic, politi-cal, social, cultural and demographic conditions, which have particular aspects in each country1-3.
This border has a strategic importance and unique dynamics and interrelationships due to the permanent flow of people, goods, and ser-vices4. However, despite the geographical
prox-imity, the social gaps on both sides of the bor-der are evident, mainly because they are two countries with different development degrees, which affect the demographic behavior of each population4,5. Moreover, these same differences
are highlighted when comparing their respec-tive bordering territories; so that in the case of the southern U.S. border, the level indicators as-sociated with the quality and economics are be-low the national average, while in the northern Mexican border these values are higher than the country’s average1-6. Although social disparities
among the border states are becoming smaller in terms of environmental sanitation, employment and schooling, the Mexican side still needs to make progress on poverty indicators, maternal mortality, infant mortality and life expectan-cy7,8. Some figures presented in 2012 by the Pan
American Health Organization (PAHO)8 show
that in 2009 the Gross Domestic Product (GDP) per capita was US$ 50.871 in California (United States) while in Baja California (Mexico) was sig-nificantly lower (US$ 7.501). In 2010, the poverty rate ranged from 21.1% to 39.4% for the north-ern Mexican border, and from 15.8% to 20.4% for the southern U.S. border. In that same year, the maximum life expectancy for the same Mexi-can region was 77.1 years and for the U.S. border region was 81 years.
In Mexico, the infant mortality (per 1 000 live births) and maternal mortality (per 100,000 live births) was from 10.6-13.4 to 30.1-62.9, respec-tively. In other words, they were well above that recorded in the U.S. where these values ranged from 5.1-6.3 (infant deaths) to 8.1-22.2 (mater-nal deaths)8. Meanwhile, the southern U.S.
bor-der faces a serious problem of insufficient cov-erage and access to health services due to a high percentage of the population has no health insur-ance and the lack of doctors in the first care level, which results in a notorious mobility of Ameri-can people in order to search medical attention on the Mexican side.
Issues related to the health of the border pop-ulation are a subject of special interest for the
two countries. Therefore, multiple joint actions have been conducted to understand and improve the health conditions of the population living in this region. Specifically, in March 2001, the Unit-ed States-Mexico Border Health Commission (BHC) established the Healthy Border program (HB) 2010 as an initiative focused on disease prevention and health promotion, whose objec-tives are: 1.) Improve the quality and increase the years of healthy life; and 2.) Eliminate disparities in access to health. Some of the goals set out in this program include the following: Access to Health Care; Cancer; Diabetes Mellitus; Environ-mental Health; HIV/AIDS; Immunization and Infectious Diseases; Injury Prevention; Maternal, Infant and Child Health; Mental Health; Oral Health; and Respiratory Diseases9.
Most health indicators for the U.S.-Mexico border have been restricted to the use of basic indicators, such as percentages and rates to esti-mate the level of mortality, even though these are insufficient to measure the aspects related to the magnitude and impact of mortality in life expec-tancy10. However, thanks to the continuous
im-provement of the quality of mortality records is possible to calculate composite indices that show the relative importance of causes of death leading to the premature loss of life years11,12.
This type of analysis can be conducted using the following two indicators: avoidable mortal-ity (AM), and the years of life lost (YLL). The first concentrates on those premature deaths that should have not occurred in the presence of timely and effective health care13-16, regardless of
the geographical area under study. Meanwhile, YLL measures the contribution of each cause of death and age group to the change observed in life expectancy, and they correspond to the dif-ference between the maximum attainable life expectancy and the one actually achieved by a group of individuals17.
The objective of this work is to measure the effect of AM in life expectancy changes in the U.S.-Mexico Border States between 1999-2001 and 2009-2011.
Methods
A cross-sectional descriptive study was carried out. Mortality and population data from the
Na-tional Institute of Statistics and Geography
(IN-EGI)18,19 were used for Mexico|. Regarding the
Preven-e C
ole
tiv
a,
20(4):1063-1073,
2015
tion (CDC) of the National Center for Health
Sta-tistics (NCHS)20, and the population data were
obtained from the United States Census Bureau (USCB)21. The triennial deaths from 1999-2001
to 2009-2011 were considered. Statistical data were pooled into periods of three years in order to soften possible fluctuations in the records due to various causes of death. Information was di-vided by five-year age groups (from 0 to 74 years old), causes of AM, and states.
On the other hand, the causes proposed by Nolte and McKee22, who classified the AM
de-pending on the relative effectiveness of various medical interventions or the health care that could prevent death in predefined ages, were used. The classification includes 33 death caus-es redistributed into ten major groups of causcaus-es with their respective age range (Chart 1). Note that in the case of deaths from ischemic heart dis-eases, only 50% of them was considered because the evidence indicates that only half of such deaths are avoidable by medical care. Most caus-es of AM contemplatcaus-es the population under 75 years old, except for intestinal infections (1-14), pertussis (0-14), measles (1-14), malignant neo-plasms of cervix and non-specified uterus parts (0-44), leukemia (0-44), diabetes (0-49) and all the respiratory diseases (except for pneumonia and influenza) (1 -14)22.
Causes of death were selected considering the underlying cause of death according to the International Statistical Classification of Diseases
and Related Health Problems 10th Revision
(ICD-10)23.
Central death rates were calculated per 100 000 people, taking as reference the U.S. popula-tion of 201021, using the following method:
Where,
SMR: standardized mortality rate mx: age-specific mortality rate for age x Px: population age group x to the standard population
X: age group mx = dx/px Where,
dx: deaths in the age group x for the popula-tion of the A area
px: population age group x
Then, years of life lost (YLL)17 were calculated.
This index represents the difference between the maximum years that a person can live between two ages, and those that a person actually live, i.e.
SMR = ,Σx (ΣmxPX) xPX
the years not lived. It is based on mortality tables, as outlined below:
(1) lx: number of survivors at the exact age x; (2) nLx: number of person–years lived divided by the ages x, and x+n;
(3) and ex: life expectancy at age x17,18; and an
indirect, the temporary life expectancy divided by two ages x and x+i (iex), which is defined as the average number of years that survivors will live at age x divided by x and x+i, and is calculated as:
Where,
is the number of person-years lived from the exact age x) and ω is the inferior limit of the last open age group.
Data processing for the decomposition of the change in life expectancy was done using the free software Epidat, version 3.124.
Results
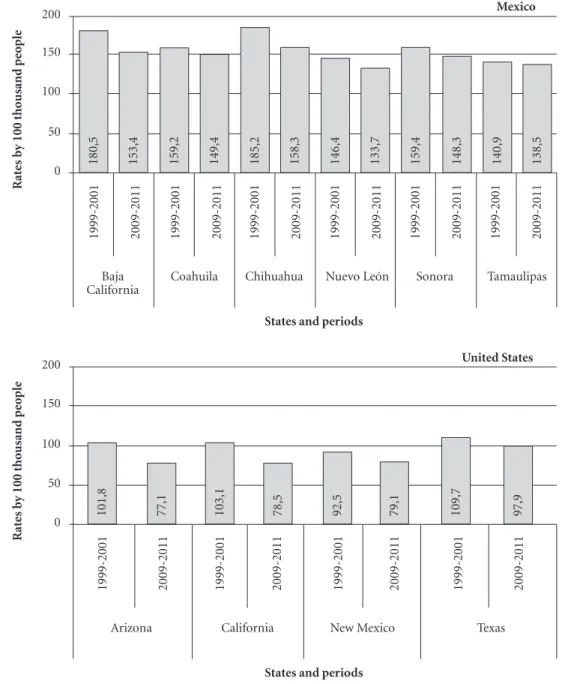
The proportion of avoidable deaths to the to-tal number of deaths in the Northern Mexican border in the 1999-2001 and 2009-2011 periods was of 31.0% and 26.7%, respectively. On the southern border of the United States was 25.2% (1999-2001) and 24.7% (2009-2011). The adjust-ed mortality rate per 100 000 population showadjust-ed a decrease from 104.8 to 84.9 (- 19%) in the U.S. border states, and 160.5 to 145.9 in the Mexican border states (- 9.1%).
The adjusted mortality rate due to avoidable causes declined into all states in the analyzed pe-riods. We found that, for both triennial periods, the U.S. Border States had AM rates lower than those observed in the Mexican Border States. For 2009-2011, Arizona was the state with the lowest AM rate, and Chihuahua had the highest AM rate (Figure 1).
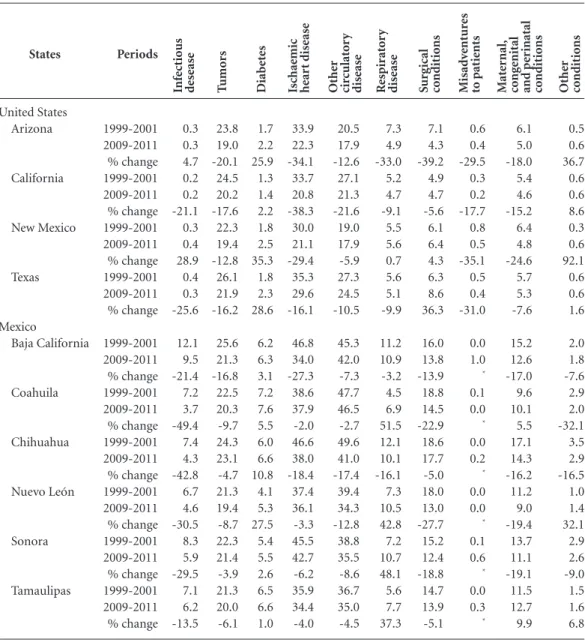
The analysis of cause of avoidable death showed data evidencing the variety of mortality profiles among adjacent states, which is present-ed briefly in Table 1.
First, it was found that the mortality rate from infectious diseases was significantly high-er in the Mexican states than in the U.S. states, although for the latter, the increased rates were found for Arizona and New Mexico.
Cancer mortality rate was similar for neigh-boring states, and a decreasing rate was observed in all states. This reduction was higher in the U.S. border region. Meanwhile, diabetes and ischemic
iex=
Tx - Tx+i
lx
u=x
B
ot
e
heart diseases highlighted in the Mexican mor-tality profile, with rates exceeding the values ob-tained for the U.S. However, the mortality rate for diabetes increased on average 23% for the U.S. and 8% for Mexico. Moreover, death rates due ischemic heart diseases declined significantly on both sides of the Border States.
Regarding other circulatory diseases, higher rates were observed in Mexico as compared to the
U.S. These differences are evident when analyzing the state of Coahuila, where a mortality rate 2.5 times higher than the one of Arizona and New Mexico (46.5 versus 17.9 per 100 000 people) for 2009-2011 was recorded. Additionally, respirato-ry diseases showed significant increases in their rates (more than 30%) in Coahuila (+ 51.5%), Sonora (+ 48.1%), Nuevo León (+ 42.8%) and Tamaulipas (+ 37.3%).
Chart 1. Classification of causes of death considered amenable.
Mortality causes
Infectious disease Intestinal infections Tuberculosis
Other infections (diphteria, tetanus, septicaemia, poliomyelitis) Whooping cough
Measles Tumors
Malignant neoplasm of colon and rectum Malignant neoplasm of skin
Malignant neoplasm of breast Malignant neoplasm of cervix uteri
Malignant neoplasm of cervix uteri and body of uterus Malignant neoplasm of testis
Hodgkin’s disease Leukaemia Diabetes
Ischaemic heart disease: 50% of deaths Other circulatory disease
Chronic rheumatic heart disease Hypertensive disease
Cerebrovascular disease Respiratory disease
All respiratory diseases (except pneumonia and influenza) Influenza
Pneumonia Surgical conditions
Peptic ulcer Appendicitis Abdominal hernia
Cholelithiasis y cholecystitis Nephritis y nephrosis Benign prostatic hiperplasia Misadventures to patients
Maternal, congenital and perinatal conditions Maternal death
Congenital cardiovascular anomalies
Perinatal deaths, all causes, excluding stillbirths Other conditions
Diseases of the thyroid Epilepsy
Age groups
0-14 0-74 0-74 0-14 1-14
0-74 0-74 0-74 0-74 0-44 0-74 0-74 0-44 0-49 0-74
0-74 0-74 0-74
1-14 0-74 0-74
0-74 0-74 0-74 0-74 0-74 0-74 0-74
0-74 0-74 0-74
0-74 0-74
International Classification of Diseases (ICD)
10th revision
A00-A09 A15-A19 A36, A35, A80 A37
B05
C18-C21 C44 C50 C53 C54,C55 C62 C81 C91-C95 E10-E14 I20-I25
I05-I09 I10-I13, I15 I60-I69
J00-J09, J20-J99 J10-J11 J12-J18
K25-K27 K35-K38 K40-K46 K80-K81
N00-N07, N19-N19, N25-N27 N40
Y60-Y69, 783-Y84
O00-099 Q20-Q28 P00-P96, A33
E00-E07 G40-G41
e C
ole
tiv
a,
20(4):1063-1073,
2015
In the group of avoidable deaths due to sur-gical conditions, the southern U.S. border States had relatively lower rates of mortality compared to the northern Mexican border states. However, while nearly all states shown reduced mortality rates due to this cause, New Mexico and Texas shown increased mortality rates. As for adverse medical events, mortality rates were low for both
sides of the border, although it should be noted that the number of reported cases is very small, making it impossible to see a clear trend for this cause of death.
Deaths from maternal, perinatal and congen-ital conditions descended on all the states of the U.S. southern border; in the case of the Northern Mexican border, both Coahuila and Tamaulipas
Mexico
R
at
es b
y 100 thousand p
eo
ple
0 50 100 150 200
1999-2001 2009-2011 1999-2001 2009-2011 1999-2001 2009-2011 1999-2001 2009-2011 1999-2001 2009-2011 1999-2001 2009-2011
Baja California
Coahuila Chihuahua Nuevo León Sonora Tamaulipas
States and periods
180,5 153,4 159,2 149,4 185,2 158,3 146,4 133,7 159,4 148,3 140,9 138,5
Figure 1. Adjusted mortality rates by avoidable causes on the United States-Mexico border 1999-2001 and 2009-2011.
Source: INEGI (Mexico). CDC/US Census Bureau (United States). Own elaboration.
United States
R
at
es b
y 100 thousand p
eo
ple
0 50 100 150 200
1999-2001 2009-2011 1999-2001 2009-2011 1999-2001 2009-2011 1999-2001 2009-2011
Arizona California New Mexico Texas
States and periods
B
ot
e
shown increased rates. The mortality rate for this cause was higher in Mexico than in the United States. Thus, Chihuahua (mortality rate of 14.3 per 100 000 people) and California (mortality rate of 4.6 per 100 000 people) shown the high-est values. Finally, avoidable deaths due to other causes, such as epilepsy and thyroid disease, were lower in all states, except those states that belong to Mexico.
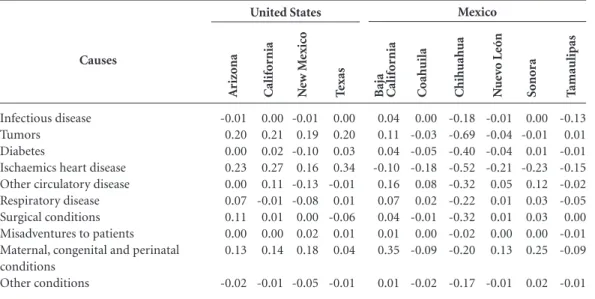
On average, from 1999-2001 to 2009-2011, avoidable causes represented a gain of 0.19 years of life for the southern U.S. states and a loss of
States United States Arizona California New Mexico Texas Mexico Baja California Coahuila Chihuahua Nuevo León Sonora Tamaulipas Periods 1999-2001 2009-2011 % change 1999-2001 2009-2011 % change 1999-2001 2009-2011 % change 1999-2001 2009-2011 % change 1999-2001 2009-2011 % change 1999-2001 2009-2011 % change 1999-2001 2009-2011 % change 1999-2001 2009-2011 % change 1999-2001 2009-2011 % change 1999-2001 2009-2011 % change
Table 1. Adjusted mortality rates by avoidable causes on the United States-Mexico border 1999-2001 and 2009-2011.
* The number of cases is too low, so that a change in rates cannot be stablish. Source: INEGI (Mexico). CDC/US Census Bureau (United States). Own elaboration.
0.3 0.3 4.7 0.2 0.2 -21.1 0.3 0.4 28.9 0.4 0.3 -25.6 12.1 9.5 -21.4 7.2 3.7 -49.4 7.4 4.3 -42.8 6.7 4.6 -30.5 8.3 5.9 -29.5 7.1 6.2 -13.5 Inf ect ious d ese ase 23.8 19.0 -20.1 24.5 20.2 -17.6 22.3 19.4 -12.8 26.1 21.9 -16.2 25.6 21.3 -16.8 22.5 20.3 -9.7 24.3 23.1 -4.7 21.3 19.4 -8.7 22.3 21.4 -3.9 21.3 20.0 -6.1 T umo rs 1.7 2.2 25.9 1.3 1.4 2.2 1.8 2.5 35.3 1.8 2.3 28.6 6.2 6.3 3.1 7.2 7.6 5.5 6.0 6.6 10.8 4.1 5.3 27.5 5.4 5.5 2.6 6.5 6.6 1.0 Diab et es 33.9 22.3 -34.1 33.7 20.8 -38.3 30.0 21.1 -29.4 35.3 29.6 -16.1 46.8 34.0 -27.3 38.6 37.9 -2.0 46.6 38.0 -18.4 37.4 36.1 -3.3 45.5 42.7 -6.2 35.9 34.4 -4.0 Isc hae mic he ar t dise ase 20.5 17.9 -12.6 27.1 21.3 -21.6 19.0 17.9 -5.9 27.3 24.5 -10.5 45.3 42.0 -7.3 47.7 46.5 -2.7 49.6 41.0 -17.4 39.4 34.3 -12.8 38.8 35.5 -8.6 36.7 35.0 -4.5 Othe r cir culat o ry dise ase 7.3 4.9 -33.0 5.2 4.7 -9.1 5.5 5.6 0.7 5.6 5.1 -9.9 11.2 10.9 -3.2 4.5 6.9 51.5 12.1 10.1 -16.1 7.3 10.5 42.8 7.2 10.7 48.1 5.6 7.7 37.3 R espir at o ry dise ase 7.1 4.3 -39.2 4.9 4.7 -5.6 6.1 6.4 4.3 6.3 8.6 36.3 16.0 13.8 -13.9 18.8 14.5 -22.9 18.6 17.7 -5.0 18.0 13.0 -27.7 15.2 12.4 -18.8 14.7 13.9 -5.1 S ur g ical co ndit io ns 0.6 0.4 -29.5 0.3 0.2 -17.7 0.8 0.5 -35.1 0.5 0.4 -31.0 0.0 1.0 * 0.1 0.0 * 0.0 0.2 * 0.0 0.0 * 0.1 0.6 * 0.0 0.3 * M isad ve ntur es to pat ie nts 6.1 5.0 -18.0 5.4 4.6 -15.2 6.4 4.8 -24.6 5.7 5.3 -7.6 15.2 12.6 -17.0 9.6 10.1 5.5 17.1 14.3 -16.2 11.2 9.0 -19.4 13.7 11.1 -19.1 11.5 12.7 9.9 M at er nal, co ng enital and p er inatal co ndit io ns 0.5 0.6 36.7 0.6 0.6 8.6 0.3 0.6 92.1 0.6 0.6 1.6 2.0 1.8 -7.6 2.9 2.0 -32.1 3.5 2.9 -16.5 1.0 1.4 32.1 2.9 2.6 -9.0 1.5 1.6 6.8 Othe r co ndit io ns
0.49 years of life for the northern Mexican states. In those same periods, the United States had a positive balance in the years of life expectancy, al-though with different intensity: Arizona (+ 0.70), California (+ 0.74), New Mexico (+ 0.16) and Texas (+ 0.56). In contrast, Mexico had signifi-cant fluctuations among states: Baja California (+ 0.72), Coahuila (-0.29), Chihuahua (-3.04), Nuevo León (-0.13), Sonora (+ 0.22) and Tam-aulipas (-0.44) (Figure 2).
e C
ole
tiv
a,
20(4):1063-1073,
2015
-0.38 years in this indicator. In the U.S. border region, years of life decreased due to the follow-ing causes: diabetes (-0.09); surgical conditions (-0.05); adverse medical events (-0.04); and in-fectious diseases (-0.02). In contrast, years of life increased due to the following causes: other cir-culatory diseases (+ 1.00); congenital and perina-tal maternal conditions (+ 0.80), and respiratory diseases (+ 0.47); and others various conditions (+ 0.10). In Mexico, the state of Chihuahua showed a life expectancy highly reduced by more than three years on its inhabitants, i.e., a reduc-tion higher than that in the other adjacent Border States. The years of life were adversely impacted by all causes in this state. In the country, eight of the ten groups of avoidable deaths had decreased life years (from highest to lowest): other circu-latory diseases (-1.39); maternal, congenital and perinatal conditions (-0.65); surgical conditions (-0.45); infectious diseases (-0.29); ischemic heart diseases (-0.24); diabetes (-0.19); other conditions (-0.13) and tumors (-0.03) (Table 2).
Discussion
The U.S.-Mexico Border States show a very dif-ferent picture of mortality, as mentioned in pre-vious research25-27. This territorial heterogeneity
has been explained by many factors such as the specific socio-economic and social structure that determines how people get sick and die28-31; the
organization and performance of each country’s health systems13-16; the influence of national and
local policies32-35, the individual and
communi-ty response to health events; the distribution of the prevalence, the incidence and mortality of the diseases30; and ambient environment36.
Re-garding the U.S., the slow progress in reducing deaths in general is a matter of growing interest, especially since this phenomenon has coincided with an increase of people without social security and the stagnation in reducing deaths by isch-emic heart diseases and other circulatory diseas-es (mainly strokdiseas-es)8,22,37. During 2008-2009, the
population without the right to private health Figure 2. Life expectancy change by avoidable causes on the United States-Mexico border
1999-2001 and 2009-2011.
Source: INEGI (Mexico). CDC/US Census Bureau (United States). Own elaboration. Tamaulipas
Sonora
Nuevo León
Chihuahua
Coahuila
Baja California
Texas
New Mexico
California
Arizona
M
exic
o
-3,5
U
nit
ed S
tat
es
-3,5 -2,5 -2,0 -1,5 -1,0 -0,5 0,0 0,5 1,0 1,5
Loss Gain
Years of life
-0,04 -0,02 -0,38
-0,08 -0,10 -3,04
-0,38 -0,32
-0,23 -0,45
0,20 0,45 0,01
0,73 0,75 0,54
0,64 0,82 0,00
B
ot
e
services in the southern U.S. border states ranged from 19% in California to 26% in Texas (higher than the national average: 17%). In contrast, in Mexico’s northern border people without social security represented 20% (Nuevo León) and 28% (Baja California) (less than the overall average of the country: 34%) in 20098.
Although a decrease in rates of avoidable deaths has been observed, the level of this reduc-tion is different on both sides of the border, cre-ating inequalities more marked. About this point, the findings of this study are consistent, but not directly comparable, with other studies reporting slightly decreased AM. This AM decreased by 4% in the U.S. from 1997-1998 to 2002-200322, and it
decreased by 5% from 1995-1999 to 2000-2004 in Mexico27. This same pattern has occurred in
countries such as Spain38, Canada39 and
Colom-bia35.
The U.S.-Mexico border states have common features in their health profiles8 that make it
nec-essary to address some problems on a global basis and others by considering their own peculiarities in order to reduce the gaps and enhance social equity through strategies that involve indepen-dent national actions and others that involve cross-border coordination7,8. These efforts should
be aimed at preventing and reducing AM to meet or exceed the levels observed in states with better performance in health indicators. Such actions
shall include the promotion of healthy lifestyles that encourage people to reduce the alcohol and tobacco consumption, increase physical activity on a regular basis, as well as monitoring condi-tions associated with the metabolic syndrome8.
The structure of AM in the study region is a combination of mixed epidemiological regimes, where communicable and non-communicable diseases coexist25-27,40. Most causes of death
an-alyzed are characterized by being chronic, long lasting causes and a burden of permanent dis-ability and dependence41,42, which leads to rethink
the role of quality medical care, the adherence and controlled management of these conditions.
The impact of health problems on the pop-ulation of the ten U.S.-Mexico Border States has not been sufficiently comparatively analyzed due to the limited sources of systematic and standardized information, among other things, and also their quality and coverage. However, U.S.-Mexico’s mortality data are considered of good quality, according to previous assessments, and appropriate for the death analysis by causes, as performed in this article43-45.
Finally, this research provides key evidence for planning and prioritizing health interven-tions, but it is insufficient to explain the com-plexity of factors that influence the health – dis-ease – death process of the population of the U.S.-Mexico Border States. Accordingly, we
sug-T amaulipas Causes Infectious disease Tumors Diabetes
Ischaemics heart disease Other circulatory disease Respiratory disease Surgical conditions Misadventures to patients Maternal, congenital and perinatal conditions
Other conditions
Table 2. Life expectancy change by groups of avoidable causes on the United States-Mexico border, 1999-2001 and 2009-2011.
Source: INEGI (Mexico). CDC/US Census Bureau (United States). Own elaboration. -0.01 0.20 0.00 0.23 0.00 0.07 0.11 0.00 0.13 -0.02 A riz o na 0.00 0.21 0.02 0.27 0.11 -0.01 0.01 0.00 0.14 -0.01 C alif o rnia -0.01 0.19 -0.10 0.16 -0.13 -0.08 0.00 0.02 0.18 -0.05 N ew M exic o 0.00 0.20 0.03 0.34 -0.01 0.01 -0.06 0.01 0.04 -0.01 T exas -0.13 0.01 -0.01 -0.15 -0.02 -0.05 0.00 -0.01 -0.09 -0.01 Baj a C alif o rnia 0.04 0.11 0.04 -0.10 0.16 0.07 0.04 0.01 0.35 0.01 C o ah uila 0.00 -0.03 -0.05 -0.18 0.08 0.02 -0.01 0.00 -0.09 -0.02 C hih uah ua -0.18 -0.69 -0.40 -0.52 -0.32 -0.22 -0.32 -0.02 -0.20 -0.17 N ue vo León -0.01 -0.04 -0.04 -0.21 0.05 0.01 0.01 0.00 0.13 -0.01 S on or a 0.00 -0.01 0.01 -0.23 0.12 0.03 0.03 0.00 0.25 0.02
e C
ole
tiv
a,
20(4):1063-1073,
2015
gest to incorporate other individual, social, cul-tural and economic variables in future analyses in order to measure the contribution of each of them for health indicators, as well as the poli-cies influence and the organization of the health systems profiles. Another key aspect shall be the use of sex and age disaggregated data in order to identify the most vulnerable subgroups and to focus actions depending on the specific charac-teristics of each them.
Collaborations
B
ot
e
References
Ybañez E. La estructura por edad y sexo en los principa-les municipios y condados de la frontera entre México y Estados Unidos. Frontera Norte 2008; 21(42):31-52. Ybañez E. Algunas características demográficas de la población de la frontera México-Estados Unidos. Fron-tera Norte 2000; 12(24):159-156.
González R. Aspectos sociodemográficos de la Fronte-ra Norte. In: Rangel, G, Hernández M, coordinadores. Condiciones de salud en la Frontera Norte de México. Ti-juana: El Colegio de La Frontera Norte; 2009. p. 17-38. Guillén T. Frontera norte: los contrastes de la calidad de vida. Revista Mexicana de Política Exterior 2007; 81:9-32.
Corona R. Tendencias demográficas en la Frontera Norte. In: Ordóñez, G, Reyes M, coordinadores. Los retos de la política social en la Frontera Norte de Méxi-co. Tijuana: El Colegio de La Frontera Norte; 2006. p. 41-60.
Ham R. Etnicidad y estructuras de la población en la frontera de Estados Unidos con México. Frontera Norte 1991; 3(5):119-140.
Lara F. Calidad de vida en la región fronteriza Méxi-co-EE.UU.: Estado actual y tendencias emergentes. In: Wilson CE, Lee E, editores. Resumen Ejecutivo. Reporte del estado de la frontera. Un análisis integral de la fronte-ra México-Estados Unidos. Washington: Mexico Institu-te, Woodrow Wilson International Center for Scholars; 2013. p. 20-22.
Organización Panamericana de la Salud (OPS). Salud en las Américas: edición de 2012. Panorama regional y perfiles de país. Washington: OPS; 2012.
Comisión de Salud Fronteriza México-Estados Unidos. Frontera Saludable 2010. Una agenda para mejorar la salud en la frontera México-Estados Unidos. Resumen Ejecutivo. 2010 [acceso 2014 ago 04] Disponible en: http://www.borderhealth.org/files/res_819.pdf Organización Panamericana de la Salud (OPS). Indica-dores de Salud: Elementos Básicos para el Análisis de la Situación de Salud. Boletín Epidemiológico OPS 2001; 22(4):1-5.
Arriaga E. Los años de vida perdidos: Su utilización para medir el nivel y cambio de la mortalidad. Notas de Población 1996; 24:7-38.
Arriaga E. Comentarios sobre algunos índices para medir el nivel y el cambio de la mortalidad. Estudios Demográficos y Urbanos 1996; 11:5-30.
Nolte E, Scholz R, Shkolnikov V, McKee M. The contri-bution of medical care to changing life expectancy in Germany and Poland. Soc Sci Med 2002; 55(11):1905-1921.
Nolte E, McKee M. Does health care save lives? Avoidable mortality revisited. London: The Nuffield Trust; 2004. Rutstein DD, Berenberg W, Chalmers TC, Child CG 3rd, Fishman AP, Perrin EB. Measuring the Quality of medical Care-A Clinical Method. N Engl J Med 1976; 294(11):582-588.
Vlădescu C, Ciutan M, Mihăilă V. The role of avoidable mortality in health assessment. Journal of Health Ma-nagement 2010; 14(3):4-10.
1.
2.
3.
4.
5.
6.
7.
8.
9.
10.
11.
12.
13.
14. 15.
16.
Consellería de Sanidade e Servicio Galego de Saúde. Epidat 4: Ayuda de demografía. 2014 [acceso 2013 jun 07] Disponible en: http://www.sergas.es/gal/documen- tacionTecnica/docs/SaudePublica/Apli/Epidat4/Ayu-da/Demograf%C3%ADa.pdf
Instituto Nacional de Estadística y Geografía. Registros Administrativos Mortalidad. 2014 [acceso 2014 ago 12] Disponible en: http://www3.inegi.org.mx/sistemas/mi-crodatos/encuestas.aspx?c=33398&s=est
Instituto Nacional de Estadística y Geografía. Censos y Conteos. 2014 [acceso 2014 agosto 12] Disponible en: http://www.inegi.org.mx/est/contenidos/proyectos/ ccpv/
Centers for Disease Control and Prevention. WON-DER Online Databases. 2013 [acceso 2013 ago 24] Dis-ponible en: http://wonder.cdc.gov/.
United States Census Bureau. American Fact Finder. 2013 [acceso 2014 ago 12] Disponible en: http://fact- finder2.census.gov/faces/tableservices/jsf/pages/pro- ductview.xhtml?pid=PEP_2013_PEPAGESEX&prod-Type=table
Nolte E, McKee M. In amenable mortality. Deaths avoidable through health care. Progress in the US lags that of three European countries. Health Aff 2012; 31(9):2114-2122.
Organización Mundial de la Salud (OMS). Clasificación Internacional de Enfermedades, 10ª Revisión, Segunda Edición (CIE-10). Ginebra: OMS; 2004.
Xunta de Galicia. Dirección Xeral de Innovación e Xes-tión da Saúde Pública/Organización Panamericana de la Salud. Epidat 3.1. 2013 [acceso 2013 nov 14] Dispo-nible en: http://www.sergas.es/MostrarContidos_N3_ T01.aspx?IdPaxina=62715
Molina CA, López MV. Mortalidad evitable. El caso de la Frontera Norte de México, 1980-1990. Cad Saude Publica 1995; 11(35):395-407.
López AM, Uribe FJ. Principales casusas de muerte evitable en el estado de Coahuila: implicaciones para los servicios de salud. Ciencias de la Salud de la UAdeC 2012; 3(2):13-19.
Franco F, Lozano R, Villa B, Soliz P. La Mortalidad en México, 2000-2004. Muertes evitables: magnitud, dis-tribución y tendencias. México: Dirección General de Información en Salud; 2006.
Franzini L, Spears W. Contributions of social context to inequalities in years of life lost to heart disease in Texas, USA”. Soc Sci Med 2003; 57(10):1847-1861.
Rodríguez J. Desigualdades socioeconómicas entre de-partamentos y su asociación con indicadores de mor-talidad en Colombia en 2000. Rev Panam Salud Publica 2007; 21(2/3):111-124.
Gattini C, Sanderson C, Castillo-Salgado C. Variación de los indicadores de mortalidad evitable entre comu-nas chilecomu-nas como aproximación a las desigualdades de salud. Rev Panam Salud Publica 2002; 12(6):454-461. Godínez V, Burns R. Desarrollo Regional y Salud. In: Cordera R, Murayama C, coordinadores. Los determi-nantes sociales de la salud en México. México: Fondo de Cultura Económica; 2012. p. 168-243.
17.
18.
19.
20.
21.
22.
23.
24.
25.
26.
27.
28.
29.
30.
e C
ole
tiv
a,
20(4):1063-1073,
2015
Ortega H. Problemas prioritarios de salud en la fron-tera México-Estados Unidos. Salud Publica Mex 1991; 33(4):356-359.
Canales A, Martínez J, Reboiras L, Rivera F. Migración y salud en zonas fronterizas: informe comparativo sobre cinco fronteras seleccionadas. Santiago de Chile: CELA-DE; 2010.
Gómez RD, Nolasco A, Pereyra P, Arias S, Rodríguez FL, Aguirre C. Diseño y análisis comparativo de un inven-tario de indicadores de mortalidad evitable adaptado a las condiciones sanitarias de Colombia. Rev Panam Salud Pública 2009; 26(5):385-397.
Gómez RD. La mortalidad evitable como indicador de desempeño de la política sanitaria. Colombia. 1985-2001. Medellín: Universidad de Antioquia; 2008. Provencio E. Medio ambiente, hábitat y salud. In: Cor-dera R, Murayama C, coordinadores. Los determinantes sociales de la salud en México. México: Fondo de Cultu-ra Económica; 2012. p. 321-349.
Hoyert DL. 75 Years of Mortality in the United States, 1935-2010. NCHS Data Brief 2012; 88:1-8.
Vergara M, Benach J, Martínez J, Buxó Pujolràs M, Yutaka Y. La mortalidad evitable y no evitable: distri-bución geográfica en áreas pequeñas de España (1990– 2001). Gac Sanit. 2009; 23(1):16-22.
Douglas GM, Mao Y. Avoidable Mortality in the Uni-ted States and Canada, 1980-1996. Am J Public Health 2002; 92(9):1481-1484.
Organización Panamericana de la Salud (OPS). Perfiles de mortalidad de las comunidades hermanas fronteri-zas México-Estados Unidos. Edición 2000. Washington: OPS; 2000.
Córdova JA, Barriguete JA, Lara A, Barquera S, Rosas M, Hernández M, de León-May ME, Aguilar-Salinas CA. Las enfermedades crónicas no transmisibles en México: sinopsis epidemiológica y prevención integral. Salud Publica Mex 2008; 50(5):419-427.
Lozano R, Murray CJL, Frenk J, Bobadilla JL, Fernán-dez S. El peso de la enfermedad en México: un doble reto. DF: Fundación Mexicana para la Salud; 1994. Lozano R. ¿Es posible seguir mejorando los registros de las defunciones en México? Gac Med Mex 2008; 144(6):525-534.
División de Estadística de las Naciones Unidas. Cove-rage of Birth and Death Registration. 2014 [acceso 2014 ene 8] Disponible en: http://unstats.un.org/unsd/de-mographic/CRVS/CR_coverage.htm.
Mathers CD, Ma Fat D, Inoue M, Rao C, López AD. Counting the dead and what they died from: an assess-ment of the global status of cause of death data. Bulletin of the World Health Organization 2005; 83(3):171-177.
Article submitted 17/03/2014 Approved 19/10/2014
Final version submitted 21/09/2014 32.
33.
34.
35.
36.
37. 38.
39.
40.
41.
42.
43.
44.