R
e v i e wA
Rt i c l e3 3 2 Arq Bras Oftalmol. 2017;80(5):332-7 http://dx.doi.org/10.5935/0004-2749.20170082
A need for standardization in visual acuity measurement
Medida da acuidade visual e necessidade de padronização
Hina Patel1, natHan Congdon2,3, glenn StrauSS1, CHarleS lanSingH1,4,5
Submitted for publication: June 5, 2017 Accepted for publication: August 8, 2017 1 HelpMeSee, New York (NY), USA. 2 Queens University Belfast, Belfast, UK. 3 Orbis International, New York (NY), USA.
4 Instituto Mexicano de Oftalmologia Queretaro, Queretaro, México.
5 University of Tennessee Health Science Center, Hamilton Eye Institute, Memphis (TN), USA.
Funding: This study was supported by HelpMeSee.
Disclosure of potential conflicts of interest: None of the authors have any potential conflict of interest to disclose.
Corresponding author: Hina Patel. 20W 36th Street, Floor 4 - New York - NY - 10018-8005 - USA - Email: [email protected]
ABSTRACT
Standardization of terminologies and methods is increasingly important in all fields including ophthalmology, especially currently when research and new technology are rapidly driving improvements in medicine. This review highlights the range of notations used by vision care professionals around the world for vision measurement, and the challenges resulting from this practice. The global community is urged to move toward a uniform standard.
Keywords: Visual acuity; Vision screening; Vision tests; logMAR; ETDRS
RESUMO
Nos tempos atuais, quando a pesquisa e a tecnologia estão avançando rapidamente, as melhorias na medicina, a padronização de terminologias e métodos está se tornando cada vez mais importante em todos os campos, incluindo a oftalmologia. Os profissionais de cuidados da visão em todo o mundo usam várias notações para a medição da visão. Nesta revisão, os autores destacam os desafios enfrentados por essa abordagem. A comunidade global precisa adotar um padrão uniforme.
Descritores: Acuidade visual; Triagem visual; Teste de visão; logMAR; ETDRS
INTRODUCTION
Visual acuity (VA) is presented in different units and using several notational systems(1-4). From a global vision care perspective,
accep-tance of a standard unit of vision testing and vision notation would help ease data consolidation between different countries and facili-tate easier communication between policy makers, healthcare or so cioeconomic benefits administrators, governments, healthcare training providers, and researchers. It would also establish a benchmark to evaluate all stakeholders on an equal footing.
V
ISUALACUITYMEASUREMENT Variations in chartsWorldwide, Snellen charts are the most popular charts for vision measurement, with many variations using a range of optotypes. For testing vision in children, the Landolt C chart, the Tumbling E chart, Lea Symbols, Lea grating, or other tests may be employed(2,5,6). Based
on the judgment of trained professionals, these charts may also be used for vision testing in adults with impaired mental abilities or low literacy(2,7,8). Jaeger charts are used to test near VA(9). The choice of
chart varies depending on patient requirement, practitioner prefe-rence, testing method, resource availability, and staff expertise.
Variations in notations
Visual acuity in Snellen charts is often represented as a fraction in which the numerator is distance from the chart and the denominator is size of the smallest line that can be read. Feet (ft.) and meters (m) are the most commonly used distance units for notation of VA. However, in clinical settings, a variety of notations are used throughout the world. For instance, the decimal system is used in Algeria, Bulgaria, Belgium, Denmark, Japan, and several other countries(4,8). Decimals as
x/10 fractions are used in several parts of Europe(3,10) and some parts
of Africa and Latin America. Five-score is used in China (personal communication). Vision standards recommended by the Federal Aviation Administration include Military Standard MIL-STD-401E and National Aerospace Standards (NAS) developed by the Aeros-pace Industries Association (AIA). AIA-NAS-410 uses Jaeger units for vision notation. The International organization for Standardization (ISO) accepts Jaeger and N points of VA to qualify nondestructive inspection and testing (NDI/NDT ) personnel using ISO-9712(9).
When the Jaeger chart is used for vision testing, readings may vary depending on testing distance. A J1 measurement based on the revised Jaeger standard testing distance of 14 inches would be equivalent to 20/20 under the Snellen acuity standard. If the NDI/ NDT vision standard of a 17.5-inch testing distance is followed, J1 would be equivalent to 20/15 and J2 would be 20/20(9). Grating tests
may be used for patients with severely constricted visual fields or scotomas with notation units of cycles per degree(2).
ETDRS for research
In Snellen charts, every line has variable letter sizes and a variable number of letters are present in each line. Good vision lines have up to eight letters and some poor vision lines may have only two letters. They contain an irregular progression of letter sizes between lines, and non-uniform spacing between letters and rows. In clinical settings, variable testing distance, illumination, test chart design, font types, optotype size, optotype spacing, patient variables, and methods of scoring all contribute small margins of error to test-retest variabilities in vision testing(2,5,11). Building up on researchdata and
Pat e l H, e ta l.
3 3 3 Arq Bras Oftalmol. 2017;80(5):332-7
minimum angle of resolution (MAR). Spacing between letters and rows was equalized to letter height in the smaller of the two rows(5).
In 1982, the US National Eye Institute developed the Early Treatment Diabetic Retinopathy Study (ETDRS) chart and a protocol for vision testing. British standard letters (rectangular) in the Bailey Lovie chart were replaced with Sloan Letters (square). A testing distance of 4 m was used instead of the earlier 6 m.Readings for these charts could be noted in logMAR, Visual acuity score, Letter score, MAR, and others, adding further to the range of notations.
The use of the ETDRS method, which had a superior chart design and a defined method for testing vision resulted in considerable improvement of VA scores, especially in the low vision range with two-line improvement in patients with ≤20/200 vision, approxima-tely five lines in those with 20/400 vision, and also in patients with exudative age-related macular degeneration, when compared to the Snellen chart(12). The accuracy of results provided by the ETDRS
method helped its establishment as a Gold standard in vision testing for research purposes. E-ETDRS or Electronic ETDRS testing is also now employed in clinical trials and has been proven to reduce test-retest time and technician bias(5,13).Despite these advances,
some researchers still express concern that there might be variation in scores with use of standard ETDRS or E-ETDRS charts in patients with visual disorders such as macular degeneration or amblyopia(13).
It should be noted that the standards of illuminance used in ETDRS protocols, measured in candela per square meter (cd/m2) units, are
also variable across countries. The ETDRS protocol approved by the US FDA defines a standard illumination of 85 cd/m2, use of a wide
chart on a lightbox, and mandates a testing distance of 4 m. The accepted standard in Germany is 300 cd/m2 and 120 cd/m2 has been
adopted in the United Kingdom(11,14). Nevertheless, even with these
caveats, the appeal of the ETDRS method for vision testing in research and academic settings is undisputed.
logMAR for routine use
Though the ETDRS method seems ideal for vision testing in re search settings, it does not automatically hold appeal among practicing ophthalmologists. Latin (Roman) alphabets on the ETDRS chart were modified to Sloan letters for use in Europe(14). Thus, region-specific
optoty-pes in vision charts were desirable for workers in the field. Many found the ETDRS protocol hard to adopt because of the need for special equipment, complex scoring, staff re-training, and the extended time needed to complete the evaluation. Some practi-tioners were of the opinion that the standard testing distan ce of 4 m is cumbersome when examining patients with low vision. However, there was general acceptance of the advantages of the ETDRS protocol and several practitioners explored methods to make it more cli-nic-friendly. Reduced logMAR E (RLME)(15), Compact reduced logMAR(16)
Simplified logMAR(17), Reduced logMAR(18) and other charts were
tes-ted and found acceptable. These charts are all re cogni zed as logMAR charts and differ in the use of optotypes, number of optotypes in a row, or number of lines in a chart. The use of logMAR charts with standard methods is expected to cause some test-retest variability based on the use of optotypes, number of lines, illumination, and other factors, but is a considerable improvement over using the Snellen chart. This method can reduce testing time and is much less cumbersome to use than the standard ETDRS research protocol. Though using the compact logMAR chart takes a slightly longer time than using the Snellen chart (5-40 sec
vs3-35 sec), the time taken was almost half that taken for using the ETDRS chart (9-80 sec)(16). The difference in sensitivity and specificity
of simplified logMAR compared to the standard is marginal (95 % vs
98%). The cost of a simplified logMAR chart printed on A4 size paper and pasted on a cardboard is less than $1, compared to the standard logMAR chart printed on acrylic material costing approximately $121. Training school teachers in the use of simplified logMAR charts was accomplished in half a day and the only logistics required for screening
were a pen, a measuring tape, and the chart itself(17). Thus, from a
practical standpoint, using logMAR charts with standard methods would be an excellent compromise.
T
HECHALLENGEINTHEPUBLICHEALTHCAREARENACurrent healthcare delivery is increasingly being driven by software platforms specializing in information exchange, data collection, and meta-analysis. Using software for analytics can have considerable influence in public healthcare decision-making and assessment of the effectiveness of policies by providing insights into trends inclu-ding geographic locations, population genetics, economics, and many other parameters.
HelpMeSee, via its extensive network of partner surgeons and hospitals, provides cataract care in ten countries and is rapidly ex-panding. The initiative faced several challenges in developing an automated software platform for visual outcome reporting following cataract surgery. The system required user interfaces of hospitals to be adaptable, enabling entry of pre-surgery and post-surgery VA data in notations as used by vision care providers around the globe. On the HelpMeSee interface, the software required accuracy in sorting of data in various notations with identical numerical values but different clinical translations. For example, a numerical value of 1.9 in logMAR would mean near total visual impairment, but 1.9 in grating cycles per degree (cpd) units would mean severe visual impairment. An outcome monitoring report was required in a US format for HelpMeSee evalua-tion, but feedback to the surgeons on the field needed to be in a format familiar to them. These requirements were essential in order to facilitate continuous improvement in patient care.
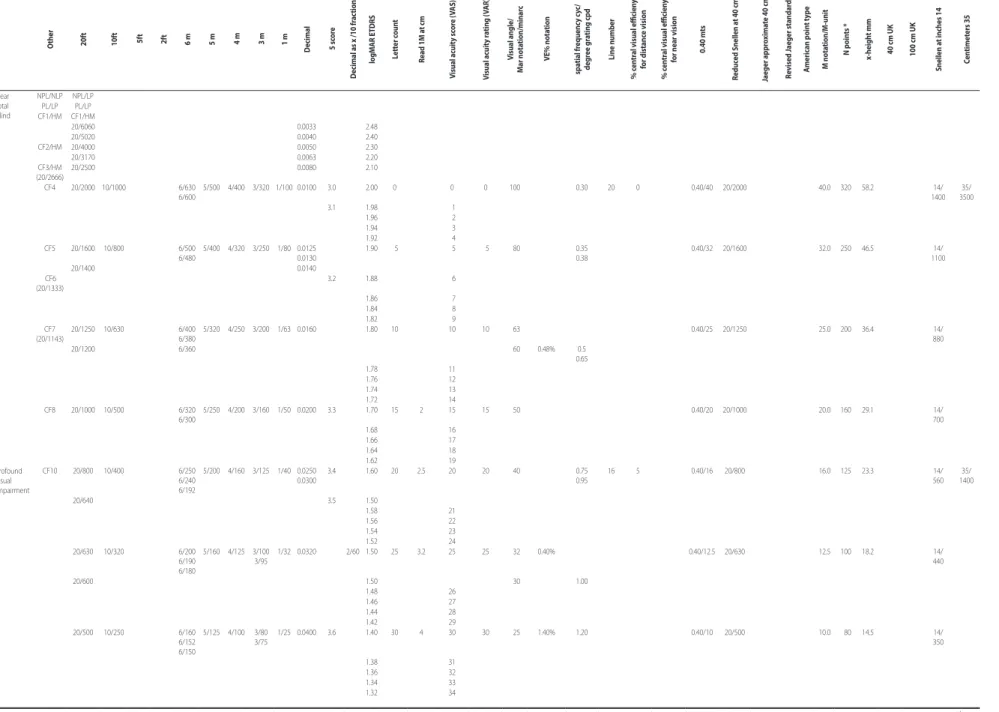
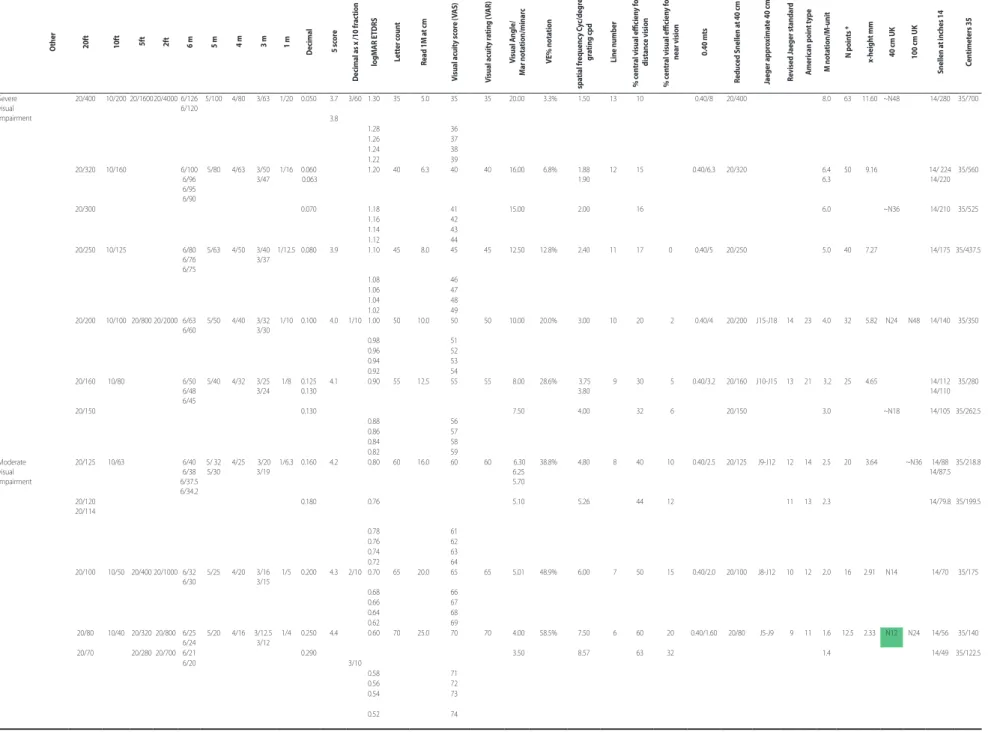
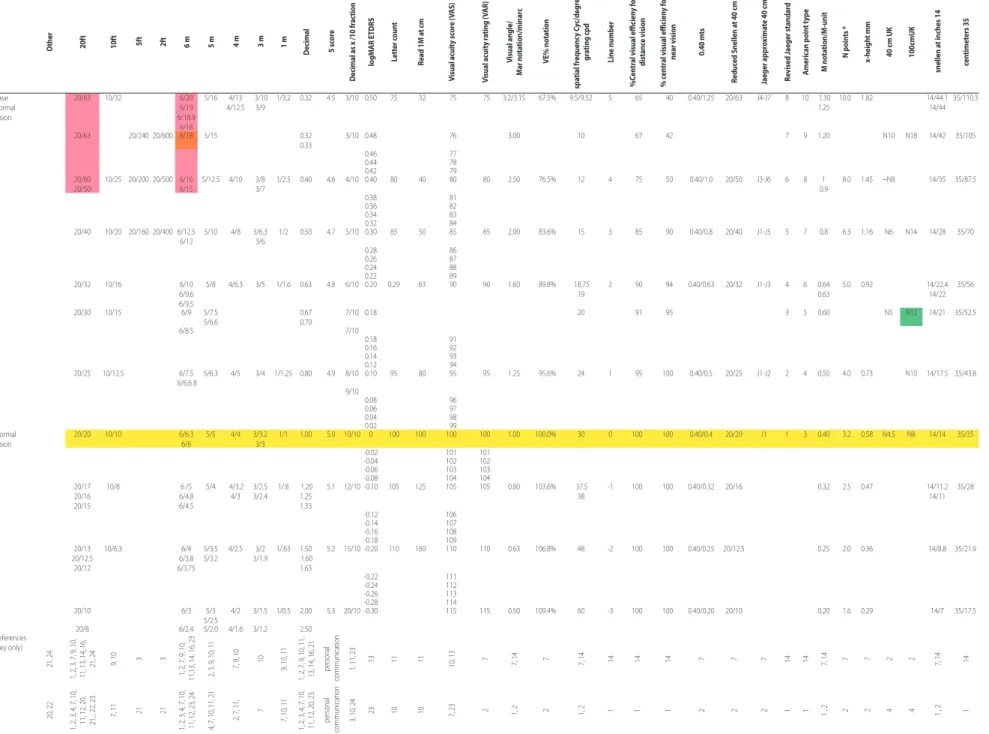
To provide a framework for the development of this software, the authors conducted a survey of a wide variety of available VA con-version charts. No attempt was made to study the various strategies used to check visual acuities. A comprehensive table of conversions (Table 1*) was created to avoid errors in translation of information and provide correct logic to build data sorting algorithms. At a 20 ft. measuring distance, VA noted as 20/20 would be represented as 6/6 at 6 m in metric notation. At this level, the decimal notation equivalent would be 1 and logMAR would be 0 (Table 1: highlighted in yellow). In the absence of simplification, as seen in the conversion table, aggregated information from various charts makes the chart too big for routine printing or viewing on digital devices and very complex to understand. Therefore, it is not a surprise that most equivalency charts used in hospitals are highly simplified and tailored to meet individual requirements. This work revealed that absolute conversion of one unit to another is not always possible regardless of how the VA measurement was obtained(3,19,12). Some levels of measurement might
A n e e df o rs tA n d A r d i z At i o ni nv i s uA lA c u i t y m e A s u r e m e n t
3 3 4 Arq Bras Oftalmol. 2017;80(5):332-7
The presented conversion chart will be useful to people actively working in public healthcare, especially in the international arena. It is expected to help understand information recorded using different systems of measurements, while drawing attention to discrepancies that require attention and translating values for practical application in software development, training of healthcare professionals, or de-velopment of region-specific healthcare policies.
P
RACTICALSOLUTIONFor organizations serving underprivileged areas, procuring special equipment might not be possible or financially viable. Availability of trained staff may also be a challenge resulting in long patient queues requiring optimum use of staff time. logMAR charts provide a practical solution in such scenarios. They borrow essential design elements of ETDRS charts and provide near-precise VA measurement while also overcoming issues identified in the Snellen methodology. Simplified formats allow evaluation in shorter timeframes than the ETDRS protocol. The authors believe that the logMAR chart when used with standard methodology provides a good balance of simplicity, acceptable level of accuracy, and reproducibility for routine cli -nical practice. Standardization of vision care professional training on a global level would also contribute hugely to harmonization.
HelpMeSee is working to adopt logMAR charts in the field and logMAR notation for reporting. HelpMeSee encourages standardiza-tion of VA notastandardiza-tion to improve global collaborastandardiza-tion and vision research. In the meantime, the equivalency chart will be used as a reference guide to ensure the best possible consistency in data analysis, outcome monitoring, and training programs for field staff.
*Owing to the large size of the table, viewing on digital screens with a resolution of at least 1920 × 1200 pixels and 24-in widescreen format, or a landscape print on A3 paper (11.7 × 16.5 in) is recommended.
RefeReNCeS
1. Holladay JT. Visual acuity measurements. J Cataract Refract Surg. 2004;30(2):287-290. 2. Bailey IL.Visual acuity. In: Borish’s clinical refraction. 2nd ed. St Louis: Butterworth
Heinemann Elsevier; 2006. p.217-46.
3. Zeitz PF, Zeitz J.Visual acuity charts “English-Deutsch-European”. Deutch: Praxix Zeitz Franko Zeitz; 2010. [cited 2017 Mar 1]. Available from: http://www.zeitzfrankozeitz. de/index.php/visustafeln.html
4. Visual acuity conversion chart from civil aviation authority.London:UK Civil Aviation Authority; 2012. [cited 2017 Mar 1]. Available from: https://www.caa.co.uk/WorkArea/ DownloadAsset.aspx?id=4294973558
5. Bailey IL, Lovie-Kitchin JE. Visual acuity testing. From the laboratory to the clinic. Vision Res. 2013;90:2-9.
6. Hyvarinen L, Jacob N. What and how does this child see? [Kndle edition]. Amazon: Vistest; 2011. p.33-8.
7. Colenbrander A. Guide for the evaluation of visual impairment. In: International Society for Low Vision Research and Rehabilitation [presented at] International Low Vision Conference VISION-99. San Francisco; 1999. [cited 2017 Mar 1]. Available from: http://www-test.ski.org/Colenbrander/Images/Visual_Impairmnt_Guide.pdf 8. Colenbrander A, Laey JJD. Vision requirements for driving safety. In: International
Council of Ophthalmology, 30th World Ophthalmology Congress, Sao Paulo, Brazil; 2006. p.1-25.
9. Nakagawara VB, Montgomery RW, Good GW. Medical Surveillance Programs for Aircraft Maintenance Personnel performing Non-Destructive Inspection and Testing. In: Technical report. Washington (DC): Federal Aviation Administration; 2005. [cited 2017 Mar 1]. Available from: http://www.dtic.mil/dtic/tr/fulltext/u2/a460862.pdf 10. Colenbrander A. Visual standards-aspects and ranges of vision loss with emphasis
on population surveys. In: International Council of Ophthalmology, 29th International
Congress of Ophthalmology, Sydney, Australia; 2002. p.1-33.
11. Colenbrander A. Visual acuity measurement standard. Ital J Ophthalmol. 1988;2(1):1-15 12. Kaiser PK. Prospective evaluation of visual acuity assessment: a comparison of snellen versus ETDRS charts in clinical practice (An AOS Thesis). Trans Am Ophthalmol Soc. 2009;107:311-24.
13. Beck RW, Moke PS, Turpin AH, Ferris FL 3rd, SanGiovanni JP, Johnson CA, Birch EE, et al. 21A computerized method of visual acuity testing: adaptation of the early treatment of diabetic retinopathy study testing protocol. Am J Ophthalmol. 2003;135(2):194-205. 14. Sotiris P, Joanna M, Trisevgeni G, et al. Validation of a modified ETDRS chart for
European-wide use in populations that use the Cyrillic, Latin or Greek alphabet. J Optom 2013;6(1):18-24.
15. Bourne R, Rosser D, Dineen B, Laidlaw DA, Johnson GJ, Murdoch IE. Evaluating a new logMAR chart designed to improve visual acuity assessment in population-based surveys. Eye (Lond). 2003;17(6):754-8.
16. Lim LA, Frost NA, Powell RJ, Hewson P. Comparison of the ETDRS logMAR, ‘com-pact reduced logMar’ and Snellen charts in routine clinical practice. Eye (Lond). 2010;24(4):673-7.
17. Naganathan M, Meenakshi S, Jyoti J, Thandalam SS. Screening efficacy of a simplified logMAR chart. Afr Vision Eye Health [Internet]. 2016;75 (1). [cited 2017 Aug 26]. Available from: http://www.avehjournal.org/index.php/aveh/article/view/323>. 18. Rosser DA, Laidlaw DAH, Murdoch IE. The development of a “reduced logMAR” visual acuity chart for use in routine clinical practice. Br J Ophthalmol. 2001;85(4):432-6.
19. Bailey IL, Jackson J. Assessment of reading vision systems in low vision patients. Ame-rican Association of optometry website. [cited 2017 Mar 1]. Available from: http:// www.aaopt.org/sites/default/files/LV-10.pdf
20. Schulze-Bonsel K, Feltgen N, Burau H, Hansen L, Bach M. Visual acuities “hand motion” and “counting fingers” can be quantified with the freiburg visual acuity test. Invest Ophthalmol Vis Sci. 2006;47(3):1236-40.
21. Visual acuity testing. Ophthalmic Technicians.org. [cited 2017 Mar 1]. Available from: http://www.ophthalmictechnician.org/index.php/courses-2/ophthalmic-assistant-basic training-course/123-visual-acuity-testing
22. Watt WS. How visual acuity is measured. [cited 2017 May 4]. Available from: http:// www.richmondproducts.com/files/2214/0960/3681/ETDRS_HOw_Acuity_Is_Measured_ Article_082108.pdf
P
a
t
e
l
H
,
e
t
a
l
.
3
3
5
A
rq
B
ra
s
O
ft
almo
l.
2
0
1
7
;8
0
(5
):3
3
2
-7
Table 1 (Part A): Visual acuity conversion chart X-axis: equivalent values are presented in the rows, Y-axis visual acuity notation types are presented in coloums
O
ther 20ft 10ft 5ft 2ft 6 m 5 m 4 m 3 m 1 m
Decimal 5 sc
or
e
Decimal as x /10 fr
ac
tion
lo
gM
AR e
TDRS
Lett
er c
oun
t
Read 1M a
t cm
V
isual acuit
y sc
or
e (
V
AS)
V
isual acuit
y r
ating (
V
AR)
V
isual angle/
M
ar nota
tion/minar
c
Ve%
nota
tion
spa
tial fr
equenc
y c
yc/
degr
ee gr
ating cp
d
Line numb
er
% c
en
tr
al visual eicien
y
for distanc
e vision
% c
en
tr
al visual eicien
y
for near vision
0.40 m
ts
Reduc
ed Snellen a
t 40 cm
Jaeger appr
o
xima
te 40 cm
Re
vised J
aeger standar
d
A
meric
an p
oin
t t
yp
e
M nota
tion/M
-unit
N p
oin
ts *
x-heigh
t mm
40 cm UK 100 cm UK
Snellen a
t inches 14
C
en
timet
ers 35
Near total blind
NPL/NLP NPL/LP PL/LP PL/LP CF1/HM CF1/HM
20/6060 0.0033 2.48
20/5020 0.0040 2.40
CF2/HM 20/4000 0.0050 2.30
20/3170 0.0063 2.20
CF3/HM (20/2666)
20/2500 0.0080 2.10
CF4 20/2000 10/1000 6/630 6/600
5/500 4/400 3/320 1/100 0.0100 3.0 2.00 0 0 0 100 0.30 20 0 0.40/40 20/2000 40.0 320 58.2 14/ 1400
35/ 3500 3.1 1.98 01
1.96 02 1.94 03 1.92 04 CF5 20/1600 10/800 6/500
6/480
5/400 4/320 3/250 1/80 0.0125 0.0130
1.90 05 05 05 080 0.35 0.38
0.40/32 20/1600 32.0 250 46.5 14/ 1100
20/1400 0.0140
CF6 (20/1333)
3.2 1.88 06
1.86 07 1.84 08 1.82 09 CF7
(20/1143)
20/1250 10/630 6/400 6/380
5/320 4/250 3/200 1/63 0.0160 1.80 10 10 10 063 0.40/25 20/1250 25.0 200 36.4 14/ 880
20/1200 6/360 060 0.48% 0.5
0.65 1.78 11
1.76 12 1.74 13 1.72 14 CF8 20/1000 10/500 6/320
6/300
5/250 4/200 3/160 1/50 0.0200 3.3 1.70 15 2 15 15 050 0.40/20 20/1000 20.0 160 29.1 14/ 700 1.68 16
1.66 17 1.64 18 1.62 19 Profound
visual impairment
CF10 20/800 10/400 6/250 6/240 6/192
5/200 4/160 3/125 1/40 0.0250 0.0300
3.4 1.60 20 2.5 20 20 040 0.75 0.95
16 5 0.40/16 20/800 16.0 125 23.3 14/ 560
35/ 1400
20/640 3.5 1.50
1.58 21 1.56 22 1.54 23 1.52 24 20/630 10/320 6/200
6/190 6/180
5/160 4/125 3/100 3/95
1/32 0.0320 2/60 1.50 25 3.2 25 25 032 0.40% 0.40/12.5 20/630 12.5 100 18.2 14/ 440
20/600 1.50 030 1.00
1.48 26 1.46 27 1.44 28 1.42 29 20/500 10/250 6/160
6/152 6/150
5/125 4/100 3/80 3/75
1/25 0.0400 3.6 1.40 30 4 30 30 025 1.40% 1.20 0.40/10 20/500 10.0 080 14.5 14/ 350
1.38 31 1.36 32 1.34 33 1.32 34
A n e e d f o r s t A n d A r d i z A t i o n i n v i s u A l A c u i t y m e A s u r e m e n t 3 3 6 A rq B ra s O ft almo l. 2 0 1 7 ;8 0 (5 ):3 3 2 -7 ...Continuation
Table 1 (Part B): Visual acuity conversion chart X-axis: equivalent values are presented in the rows, Y-axis visual acuity notation types are presented in coloums
O
ther 20ft 10ft 5f
t
2f
t
6 m 5 m 4 m 3 m 1 m
Decimal 5 sc
or
e
Decimal as x /10 fr
ac tion lo gM AR e TDRS Lett er c oun t
Read 1M a
t cm V isual acuit y sc or e ( V AS) V isual acuit y r ating ( V AR) V isual A ngle/ M ar nota tion/minar c Ve% nota tion spa tial fr equenc y C yc/degr ee gr ating cp d Line numb er % c en tr
al visual eicien
y f or distanc e vision % c en tr
al visual eicien
y f
or
near vision 0.40 m
ts
Reduc
ed Snellen a
t 40 cm
Jaeger appr
o
xima
te 40 cm
Re vised J aeger standar d A meric an p oin t t yp e M nota tion/M -unit N p oin ts * x-heigh t mm
40 cm UK 100 cm UK
Snellen a
t inches 14
C en timet ers 35 Severe visual impairment
20/400 10/200 20/160020/4000 6/126 6/120
5/100 4/80 3/63 1/20 0.050 3.7 3/60 1.30 35 05.0 35 35 20.00 03.3% 1.50 13 10 0.40/8 20/400 8.0 63 11.60 ~N48 14/280 35/700
3.8
1.28 36 1.26 37 1.24 38 1.22 39 20/320 10/160 6/100
6/96 6/95 6/90
5/80 4/63 3/50 3/47
1/16 0.060 0.063
1.20 40 06.3 40 40 16.00 06.8% 1.88 1.90
12 15 0.40/6.3 20/320 6.4 6.3
50 09.16 14/ 224 14/220
35/560
20/300 0.070 1.18 41 15.00 2.00 16 6.0 ~N36 14/210 35/525
1.16 42 1.14 43 1.12 44 20/250 10/125 6/80
6/76 6/75
5/63 4/50 3/40 3/37
1/12.5 0.080 3.9 1.10 45 08.0 45 45 12.50 12.8% 2.40 11 17 0 0.40/5 20/250 5.0 40 07.27 14/175 35/437.5
1.08 46 1.06 47 1.04 48 1.02 49 20/200 10/100 20/800 20/2000 6/63
6/60
5/50 4/40 3/32 3/30
1/10 0.100 4.0 1/10 1.00 50 10.0 50 50 10.00 20.0% 3.00 10 20 02 0.40/4 20/200 J15-J18 14 23 4.0 32 05.82 N24 N48 14/140 35/350
0.98 51 0.96 52 0.94 53 0.92 54 20/160 10/80 6/50
6/48 6/45
5/40 4/32 3/25 3/24
1/8 0.125 0.130
4.1 0.90 55 12.5 55 55 08.00 28.6% 3.75 3.80
09 30 05 0.40/3.2 20/160 J10-J15 13 21 3.2 25 04.65 14/112 14/110
35/280
20/150 0.130 07.50 4.00 32 06 20/150 3.0 ~N18 14/105 35/262.5
0.88 56 0.86 57 0.84 58 0.82 59 Moderate visual impairment
20/125 10/63 6/40 6/38 6/37.5 6/34.2
5/ 32 5/30
4/25 3/20 3/19
1/6.3 0.160 4.2 0.80 60 16.0 60 60 06.30
06.25
05.70
38.8% 4.80 08 40 10 0.40/2.5 20/125 J9-J12 12 14 2.5 20 03.64 ~N36 14/88 14/87.5
35/218.8
20/120 20/114
0.180 0.76 05.10 5.26 44 12 11 13 2.3 14/79.8 35/199.5
0.78 61 0.76 62 0.74 63 0.72 64 20/100 10/50 20/400 20/1000 6/32
6/30
5/25 4/20 3/16 3/15
1/5 0.200 4.3 2/10 0.70 65 20.0 65 65 05.01 48.9% 6.00 07 50 15 0.40/2.0 20/100 J8-J12 10 12 2.0 16 2.91 N14 14/70 35/175
0.68 66 0.66 67 0.64 68 0.62 69 20/80 10/40 20/320 20/800 6/25
6/24
5/20 4/16 3/12.5 3/12
1/4 0.250 4.4 0.60 70 25.0 70 70 04.00 58.5% 7.50 06 60 20 0.40/1.60 20/80 J5-J9 09 11 1.6 12.5 2.33 N12 N24 14/56 35/140
20/70 20/280 20/700 6/21 0.290 03.50 8.57 63 32 1.4 14/49 35/122.5
P a t e l H , e t a l . 3 3 7 A rq B ra s O ft almo l. 2 0 1 7 ;8 0 (5 ):3 3 2 -7 ...Continuation
Table 1 (Part C): Visual acuity conversion chart X-axis: equivalent values are presented in the rows, Y-axis visual acuity notation types are presented in coloums
O
ther 20ft 10ft 5ft 2ft 6 m 5 m 4 m 3 m 1 m
Decimal 5 sc
or
e
Decimal as x /10 fr
ac tion lo gM AR e TDRS Lett er c oun t
Read 1M a
t cm V isual acuit y sc or e ( V AS) V isual acuit y r ating ( V AR) V isual angle/ M ar nota tion/minar c Ve% nota tion spa tial fr equenc y C yc/degr ee gr ating cp d Line numb er %C en tr
al visual eicien
y f or distanc e vision % c en tr
al visual eicien
y f
or
near vision 0.40 m
ts
Reduc
ed Snellen a
t 40 cm
Jaeger appr
o
xima
te 40 cm
Re vised J aeger standar d A meric an p oin t t yp e M nota tion/M -unit N p oin ts * x-heigh t mm
40 cm UK 100cmUK
snellen a
t inches 14
cen timet ers 35 Near normal vision
20/63 10/32 6/20 6/19 6/18.9 6/18 5/16 4/13 4/12.5 3/10 3/9
1/3.2 0.32 4.5 3/10 0.50 75 032 075 075 3.2/3.15 067.5% 9.5/9.52 5 065 040 0.40/1.25 20/63 J4-J7 8 10 1.30 1.25
10.0 1.82 14/44.1 14/44
35/110.3
20/63 20/240 20/600 6/18 5/15 0.32 0.33
3/10 0.48 076 3.00 10 067 042 7 9 1.20 N10 N18 14/42 35/105
0.46 077 0.44 078 0.42 079 20/60
20/50
10/25 20/200 20/500 6/16 6/15
5/12.5 4/10 3/8 3/7
1/2.5 0.40 4.6 4/10 0.40 80 040 080 080 2.50 076.5% 12 4 075 050 0.40/1.0 20/50 J3-J6 6 8 1 0.9
08.0 1.45 ~N8 14/35 35/87.5
0.38 081 0.36 082 0.34 083 0.32 084 20/40 10/20 20/160 20/400 6/12.5
6/12
5/10 4/8 3/6.3 3/6
1/2 0.50 4.7 5/10 0.30 85 050 085 085 2.00 083.6% 15 3 085 090 0.40/0.8 20/40 J1-J5 5 7 0.8 06.3 1.16 N6 N14 14/28 35/70
0.28 086 0.26 087 0.24 088 0.22 089 20/32 10/16 6/10
6/9.6 6/9.5
5/8 4/6.3 3/5 1/1.6 0.63 4.8 6/10 0.20 0.29 063 090 090 1.60 089.8% 18.75 19
2 090 094 0.40/0.63 20/32 J1-J3 4 6 0.64 0.63
05.0 0.92 14/22.4 14/22
35/56
20/30 10/15 6/9 5/7.5 5/6.6
0.67 0.70
7/10 0.18 20 091 095 3 5 0.60 N5 N12 14/21 35/52.5
6/8.5 7/10
0.18 091 0.16 092 0.14 093 0.12 094 20/25 10/12.5 6/7.5
6/6.6 8
5/6.3 4/5 3/4 1/1.25 0.80 4.9 8/10 0.10 95 080 095 095 1.25 095.6% 24 1 095 100 0.40/0.5 20/25 J1-J2 2 4 0.50 04.0 0.73 N10 14/17.5 35/43.8
9/10
0.08 096 0.06 097 0.04 098 0.02 099 Normal
vision
20/20 10/10 6/6.3 6/6
5/5 4/4 3/3.2 3/3
1/1 1.00 5.0 10/10 0 100 100 100 100 1.00 100.0% 30 0 100 100 0.40/0.4 20/20 J1 1 3 0.40 03.2 0.58 N4.5 N8 14/14 35/35
-0.02 101 101 -0.04 102 102 -0.06 103 103 -0.08 104 104 20/17
20/16 20/15
10/8 6 /5 6/4.8 6/4.5
5/4 4/3.2 4/3
3/2.5 3/2.4
1/.8 1.20 1.25 1.33
5.1 12/10 -0.10 105 125 105 105 0.80 103.6% 37.5 38
-1 100 100 0.40/0.32 20/16 0.32 02.5 0.47 14/11.2 14/11 35/28 -0.12 106 -0.14 107 -0.16 108 -0.18 109 20/13 20/12.5 20/12 10/6.3 6/4 6/3.8 6/3.75 5/3.5 5/3.2 4/2.5 3/2 3/1.9 1/.63 1.50 1.60 1.63
5.2 15/10 -0.20 110 160 110 110 0.63 106.8% 48 -2 100 100 0.40/0.25 20/12.5 0.25 02.0 0.36 14/8.8 35/21.9
-0.22 111 -0.24 112 -0.26 113 -0.28 114 20/10 6/3 5/3
5/2.5
4/2 3/1.5 1/0.5 2.00 5.3 20/10 -0.30 115 115 0.50 109.4% 60 -3 100 100 0.40/0.20 20/10 0.20 01.6 0.29 14/7 35/17.5
20/8 6/2.4 5/2.0 4/1.6 3/1.2 2.50 References
(key only)
21, 24
1, 2, 3, 7, 9, 10,
11, 13, 14, 16,
21, 24 9, 10 3 3
1, 2, 7, 9, 10,
11,13, 14, 16, 23 2, 3, 9, 10, 11
7, 9, 10 10 9, 10, 11
1, 2, 7, 9, 10, 11,
13, 14, 16, 21 personal
communication
1, 11, 23
13 11 11
10, 13 7 7, 14 7 7, 14 14 14 14 7 7 7 14 14 7, 14 7 7 2 2 7, 14 14
20, 22
1, 2, 3, 4, 7, 10,
11, 12, 20, 21, , 22, 23 7, 11
21 21
1, 2, 3, 4, 7, 10,
11, 12, 23, 24 4, 7, 10, 11, 21
2, 7, 11,
7
7, 10, 11
1, 2, 3, 4, 7, 10, 11, 12, 20, 23 personal
communication
3, 10, 24 23 10 10 7, 23
2 1, 2 2 1, 2 1 1 1 2 2 2 1 1 1 , 2 2 2 4 4 1 , 2 1