Estimates of genetic parameters of wood traits for sawn timber production in
Eucalyptus grandis
Paulo Eduardo Telles dos Santos
1, Isaias Olívio Geraldi
2and José Nivaldo Garcia
3 1Embrapa Florestas, Colombo, PR, Brazil.
2
Universidade de São Paulo, Escola Superior de Agricultura Luiz de Queiroz, Departamento de Genética,
Piracicaba, SP, Brazil.
3
Universidade de São Paulo, Escola Superior de Agricultura Luiz de Queiroz, Departamento de Ciências
Florestais, Piracicaba, SP, Brazil.
Abstract
In this study, the breeding perspectives of 41 open-pollinated progenies ofEucalyptus grandis were evaluated based on their wood traits. The progenies were distributed in two experiments in a randomized complete block design, with three replicates and linear plots containing six plants each. The traits were assessed at eight years of age. Two trees from each plot were selected for this assessment based on better growth, stem form and phytosanity. Significant differences in basic density, sapwood/heartwood ratio, bowing, specific gravity, parallel compression and static bending were detected among the progenies. These traits were potentially promising for breeding programs, with heritability coefficients that varied from 0.34 to 0.61 on a progeny mean basis. There was no genetic variation in the moisture content, board end-splitting, log volume under the bark, log eccentricity, bark content, crooking, and shear strength of the progenies. Intermediate to highly significant genetic correlations were detected among the physical and mechanical properties, as well as between pairs of traits such as basic density and log end-splitting, basic density and bowing, specific gravity and bowing, sapwood/heartwood ratio and bowing, log volume and bowing, and log volume and log end-splitting. These results show that the levels of growth stress in trees can be reduced by selection using indirect traits such as the sapwood/heartwood ratio and bowing.
Key words:breeding, eucalypt, genetic parameters, wood quality.
Received: October 8, 2003; Accepted: May 25, 2004.
Introduction
The genusEucalyptusis one of the most widely culti-vated hardwood genera in tropical and subtropical regions of the world, primarily because of its economic importance. This success largely reflects the adaptability of this genus to a variety of climatic and edaphic conditions, its fast growth, and the versatility and usefulness of its wood for in-dustrial applications. Despite these advantages, eucalypts are prone to suffer strong stresses within the living trees, known as growth stresses (Kubler, 1987), that is reflected in the warping and splitting of logs and boards. Such de-fects reduce the general quality of the end product and limit the usefulness of the wood. Additional traits that can be im-portant in determining the value of eucalypts wood include its basic density, mechanical properties, and juvenile wood content, all of which can be modified through breeding pro-grams.
Various studies have shown that growth stress is ge-netically controlled, with considerable natural variability in this trait (Nicholson, 1973; Hillis, 1978; Chafe, 1979; Wilkins, 1986; Malan, 1984, 1988a,b, 1991; Yang and Fife, 2000). Thus, appropriate breeding programs can introduce important genetic gains to minimize the negative effects caused by high levels of growth stress. Quantification of the genetic control of this trait and an understanding of the rela-tionships among the relevant wood properties are important for developing breeding strategies to improve the quality of wood and its usefulness.
Malan and Hoon (1992) found no relationship be-tween growth stress and other traits inE. grandis. Thus, the diameter at breast height (DBH) and tree height showed no relationship with the level of growth stress. However, in wood samples taken from progeny tests, there was signifi-cant variation in log end-splitting, with the high heritabilities observed for this trait (up to 0.50) suggesting that this defect was sufficiently inherited to allow its reduc-tion by genetic improvement. Since no relareduc-tionship was
www.sbg.org.br
Send correspondence to Paulo Eduardo Telles dos Santos. Embra-pa Florestas, Estrada da Ribeira km 111, Caixa Postal 319, 83411-000 Colombo, PR, Brazil. E-mail: [email protected].
found between the level of growth stress and wood proper-ties, genetic progress may be obtained without any detri-mental effects to other wood properties (Malan, 1995). Malan (1988c) reported estimates for the genetic parame-ters of several tree and wood characteristics inE. grandis grown in South Africa. Significant variation among proge-nies was found for DBH, total tree height and basic density. The heritability coefficient estimates were 0.30, 0.45 and 0.45, respectively. Genetic correlation estimates among these traits were negative and significant for DBH and ba-sic density (rG= -1.035) and for tree height and basic
den-sity (rG= -0.673).
In this study, we estimated the heritability coeffi-cients and examined the genetic and phenotypic correla-tions and the expected response to selection for selected traits of importance for sawn timber production in Eucalyp-tus grandis.
Material and Methods
The material used in this study was obtained from two open-pollinated progeny tests ofEucalyptus grandis(Hill ex Maiden), originally from Atherton, Queensland, Austra-lia and of Luís Antônio, São Paulo, Brazil provenance, es-tablished at Altinópolis, in the State of São Paulo. The experiments were planted in 1992 and the evaluations were done at 8 years of age. The trials were established using two randomized complete block designs, with 20 and 21 treat-ments that resulted in a total of 41 progenies. Each trial con-sisted of three replicates and six-tree linear plots such that the initial stand of each progeny was represented by 18 plants. However, since only two plants from each plot were used in this study, in the end each progeny was evaluated using six trees, corresponding to those with the best proper-ties for sawn timber based on a combined phenotypic as-sessment of growth, stem form and phytosanity. The initial spacing was 3 m x 2 m and the survival rate was 70%. The geographic coordinates and the edaphic and climatic characterization of the field trial sites were as follows: latitude -21°04’42” S, longitude - 47°22’02” W, altitude - 703 m, mean annual rainfall (1994 to 2000) - 1,276 mm, frost fre-quency (1994 to 2000) - 2.4 per year, mean annual tempera-ture (1994 to 2000) - 23.8 °C, climate - Cwa, according to the W. Köppen international classification system, soil -quartz sand (Quartzpsament).
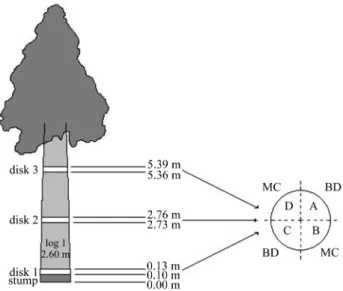
The logs were obtained using a chainsaw for tree fell-ing and stem partitionfell-ing operations, and were converted into boards using an industrial sawmill. The primary me-chanical processing was done with a twin band saw and the secondary processing was done with a two-shaft circular saw. Boards 260 cm long, 2.54 cm thick and 10-15 cm wide were obtained by regulating the twin band saw gauge, de-pending on the log diameter. One log and three disks per tree were used to characterize the experimental material (Figure 1).
Log evaluation
Log volume under the bark: The diameter under the bark was measured for each log end, and the corresponding areas under the bark for each end, as well as the average area of the ends, were estimated. The log volume was then obtained by multiplying the average area by the length of the log.
Sapwood/heartwood ratio:The heartwood area was calculated from the average diameter of the heartwood, and the sapwood area was the difference between the area under the bark and heartwood area. The final ratio was the aver-age of the estimates of heartwood/sapwood ratios based on the areas for the two ends.
Bark content:The bark content was calculated as the difference between the log volumes over and under the bark divided by the log volume over the bark.
Eccentricity:This was estimated as the quotient be-tween the largest and the smallest radii obtained from the largest diameter for each log end. The final eccentricity was the average of the values for the two ends.
Log end-splitting index (LESI):The log end-splitting index was assessed in each log end using the method of Conradie (1980), within a maximum time interval of 6 h af-ter felling. The final LESI was the average of the values for the two log ends.
Disk evaluation
Basic density:The basic density was determined in disks 2-3 cm thick that were free of bark. Two wedges were obtained from opposite each other in each disk and the ba-sic density was determined using the water displacement method. The basic density of the disk was calculated as the average density of the two wedges.
Moisture content: The moisture content was esti-mated by weighing the two disk wedges remaining from the previous step packed in impermeable plastic bags. After weighing in a moist state, the wedges were oven-dried until a constant weight was reached. The difference between the wet and dry weights divided by dry weight corresponded to the moisture content in percentage.
Board evaluation
Bowing deflection and crooking deflection:The de-flections were measured in each board using a section of aluminum (3.5 m x 2.5 cm x 5 cm) as a fixed reference. The deflection readings were obtained by placing the aluminum section an equal distance from the board ends. The average bowing and crooking deflections were obtained for each log as the sum of each type of deflection divided by the number of boards.
Board end-splitting index in green condition (BESI-G) and board end-splitting index in dried condition (BESI-D):The longest splits, parallel to the board axis, were measured at the top and bottom positions of each board obtained from the main block of every log (the num-ber of boards ranged from 3 to 7, depending on the mini-mum diameter of the log). The indexes were calculated by dividing the length of splits altogether by the number of boards, in the green and dried conditions, respectively.
Physical and mechanical properties: Samples ob-tained from the outer board of each log were used to deter-mine the physical and mechanical properties, after the boards had been naturally dried during 5 months followed by a complementary drying process in an industrial kiln during 4 days in order to reach a final humidity of ~12%. The samples were prepared from the central part of the boards and were free of any defect. One sample with di-mensions appropriate for each test was obtained from each log, as follows: specific gravity and parallel compression -3 cm x 2 cm x 2 cm, shear strength - -3 cm x 2 cm x 2 cm (with an area to be ruptured of 4 cm2and a protrusion of 0.5 cm from the main block), and static bending - 20 cm x 2 cm x 2 cm. The mechanical tests were done in a universal testing device. The load speeds applied were: parallel com-pression - 4,000 N/min, shear strength - 1,000 N/min, and static bending - 500 N/min. The rupture load readings were obtained and the tension values at the resistance limits were computed using the appropriate formulas for each situation, as described by Santoset al.(2003).
Statistical and genetic analysis
The statistical model for traits evaluated at a single position in trees was Yij(m)=µ+ tm+ pi(m)+ rj(m)+ eij(m),
where Yij(m)is the value of progeny i in replicate j within the
respective experiment m,µis the general mean of the com-bined analysis, tmis the effect of experiment m (m1= 1 and
m2= 2), assumed to be fixed, pi(m)is the effect of progeny i
(i1= 1, ..., p1; i2= 1, ..., p2) within the respective experiment
(m1or m2), assumed to be random, rj(m)is the random effect
of replication j (j = 1, ..., r) within the experiment and eij(m)is
the experimental error, with the assumption of eij ~ N
(0;σ2).
The statistical model for traits evaluated at two or three positions in trees was Yijk(m)=µ+ tm+ pi(m)+ rj(m)+ eij
+ hk(m)+ ejk+ (ph)ik(m)+ eijk(m), where Yijk(m)is the value of
progeny i in replicate j at position k within the respective experiment m,µis the general mean of the combined analy-sis, tmis the effect of experiment m (m1= 1 and m2= 2),
as-sumed to be fixed, pi(m)is the effect of progeny i (i1= 1, ...,
p1; i2= 1, ..., p2) within the respective experiment (m1or
m2), assumed to be random, rj(m)is the random effect of
rep-licate j (j = 1, ..., r) within the experiment, eij= e(a)is the
ex-perimental error of the plot units, with the assumption of eij~ N (0;σ2e(a)), hk(m)is the effect of position k (k = 1, ..., h)
within the experiment, assumed to be fixed, ejk= e(b)is the
experimental error of the subplot units, with the assumption of ejk~ N (0;σ2e(b)), (ph)ik(m)is the effect of interaction
be-tween progeny i (i1= 1, ..., p1; i2=1, ..., p2) and position k
(k = 1, ..., h) within the respective experiment (m1or m2),
assumed to be random, and eijk(m)= e(c)is the experimental
error of the combination of progeny and position effects, with the assumption of eijk~ N (0;σ2e(c)).
The data were analyzed using the general linear model (GLM) procedure of SAS®software. Variance com-ponent estimates were obtained by applying the MIXED procedure, followed by the option REML (restricted maxi-mum likelihood variance components estimation proce-dure).
The genetic coefficient of variation was estimated by the expression CVgen% p X
2
=[ σ$ ]×100, whereσ$p 2
is the
genetic variance estimate among progenies and X is the general mean. The heritability coefficient among progeny means was estimated by the expression h$X2 $p $
2 F 2
= σ σ ,
whereσ$p2 is the genetic variance among progenies and σ$F2 is the phenotypic variance among progeny means. The con-fidence intervals at the 95% probability level associated with the heritability coefficient estimates were determined according to the method of Knappet al.(1985). The genetic gain for each trait was estimated as Gs = ds. h$ $2X
and
$ $
Gs(%) = [Gs X]×100, where ds is the differential of selec-tion, h$X2
is the heritability coefficient among progeny means and X is the general mean.
The analysis of covariance for pairs of traits was based on the same model used for univariate analysis of variance, following the basic methodology proposed by Vencovsky and Barriga (1992), but excluding the fixed ef-fect “position”. The genetic correlation among progenies was estimated asr (x, y)$p =Cov (x, y)$ p σ$p(x).σ$p(y), where Cov (x, y)$ p is the genetic covariance among progenies for
devia-tion among progenies for the trait “x” andσ$p(y) is the ge-netic standard deviation among progenies for the trait “y”. The phenotypic correlation among progeny means was es-timated as r (x, y)$F =Cov (x, y)$ F σ$F(x).σ$F(y), where Cov (x, y)$ F is the phenotypic covariance among progeny means for the traits “x” and “y”,σ$F(x) is the phenotypic standard deviation among progeny means for the trait “x” and σ$F(y) is the phenotypic standard deviation among progeny means for the trait “y”.
Results and Discussion
No significant differences were detected for most of the traits among the progenies ofE. grandisstudied here (Tables 1 and 2). However, significant differences were de-tected for basic density, sapwood/heartwood ratio, bowing, specific gravity, parallel compression and static bending. Therefore, for breeding purpose, these were the traits that initially were most promising for selection.
The estimated heritability coefficients on a progeny mean basis are shown in Table 3 for the traits basic density (h2 = 0.34), LESI (h2 = 0.31), sapwood/heartwood ratio (h2= 0.39), bowing (h2= 0.39), specific gravity (h2= 0.61), parallel compression (h2 = 0.57) and static bending (h2= 0.50). For the other traits, the estimates were very low and non-significant. In general, the estimated genetic coef-ficients of variation were also very low. This could have been caused by the preliminary selection of trees within the experimental plots prior to evaluation. The traits LESI,
sap-wood/heartwood ratio and static bending showed the high-est high-estimated coefficients of genetic variation (9.08%, 7.58% and 6.62%, respectively).
The expected genetic gains from the selection for each trait based on progeny means and at a selection inten-sity of 20% ranged from 0.59% to 7.69% (Table 3). These values were compatible with the genetic variation found in this population and corresponded to selection in both sexes, with the intercrossing of only selected trees. This finding indicates that a clonal seed orchard would be appropriate to capture the expected gains. Based on analysis of isoenzyme variability, Morán and Bell (1983) and Mori (1993) re-ported outcrossing rates of 84% and 88% forE. grandis, in-dicating the presence of a certain degree of endogamy. According to Resendeet al.(1995), these genetic responses to selection correspond to immediate gains that are valid only for the first generation of recombination, since a new equilibrium would be reached only after a few generations of outcrossing because of the relatively low inbreeding rate of this species.
The BESI-G and BESI-D were unable to discriminate the progenies under the two conditions of humidity (Table 1), and it was impossible to obtain valid heritability esti-mates for these parameters, thus indicating that these vari-ables could be seriously affected by uncontrolled factors attributable mainly to imperfections in mechanical process-ing, drying effects and physical shocks. These traits are therefore not recommended as useful parameters for selec-tion in breeding programs.
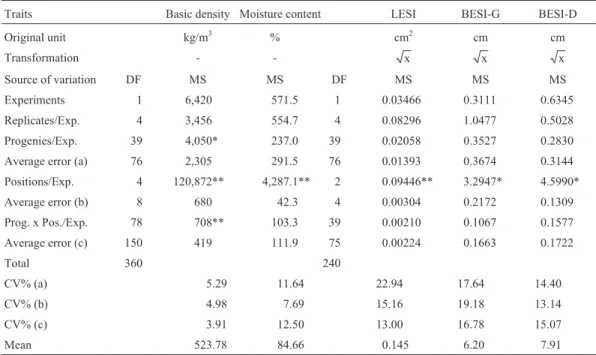
Table 1- Analysis of variance for several traits in eight-year-oldE. grandison a plot mean basis (two plants) and for different sampling tree positions and evaluations in logs.
Traits Basic density Moisture content LESI BESI-G BESI-D
Original unit kg/m3 % cm2 cm cm
Transformation - - x x x
Source of variation DF MS MS DF MS MS MS
Experiments 1 6,420 571.5 1 0.03466 0.3111 0.6345
Replicates/Exp. 4 3,456 554.7 4 0.08296 1.0477 0.5028
Progenies/Exp. 39 4,050* 237.0 39 0.02058 0.3527 0.2830
Average error (a) 76 2,305 291.5 76 0.01393 0.3674 0.3144
Positions/Exp. 4 120,872** 4,287.1** 2 0.09446** 3.2947* 4.5990*
Average error (b) 8 680 42.3 4 0.00304 0.2172 0.1309
Prog. x Pos./Exp. 78 708** 103.3 39 0.00210 0.1067 0.1577
Average error (c) 150 419 111.9 75 0.00224 0.1663 0.1722
Total 360 240
CV% (a) 5.29 11.64 22.94 17.64 14.40
CV% (b) 4.98 7.69 15.16 19.18 13.14
CV% (c) 3.91 12.50 13.00 16.78 15.07
Mean 523.78 84.66 0.145 6.20 7.91
DF: degrees of freedom, MS: mean square, LESI: log end-splitting index, BESI-G: board end-splitting index in green condition, BESI-D: board end-splitting index in dried condition.
Garciaet al.(2001) reported that lowering the distri-bution gradient of the tension and compression stresses and producing more uniform wood properties along the longi-tudinal axis of the tree are also essential for reducing split-ting and bowing.
The genetic correlations among progenies and the phenotypic correlations among progeny means (Table 4) were estimated only for pairs of traits of interest for breed-ing purposes. The genetic and phenotypic correlations be-tween log volume under the bark and basic density were practically null (r = 0.008 and 0.030, respectively), indicat-ing that these traits could be selected independently. In con-trast, the genetic and phenotypic correlations between basic density and specific gravity were highly positive (r = 0.750 and 0.682, respectively), which explains the similar pattern of association of these two traits in relation to parallel com-pression and static bending, two mechanical properties that
are strongly influenced by those traits. These relationships are easily explained by the fact that fiber and vessel wall thicknesses, as well as lumen diameter, change according to the wood density or specific gravity. Thus, wood sam-ples with a higher density or specific gravity contain fewer empty intracellular spaces and a more compact arrange-ment of the structural anatomical elearrange-ments (fibers and ves-sels). This results in greater resistance to mechanical force, whereas wood of lower density tends to be less resistant to such force.
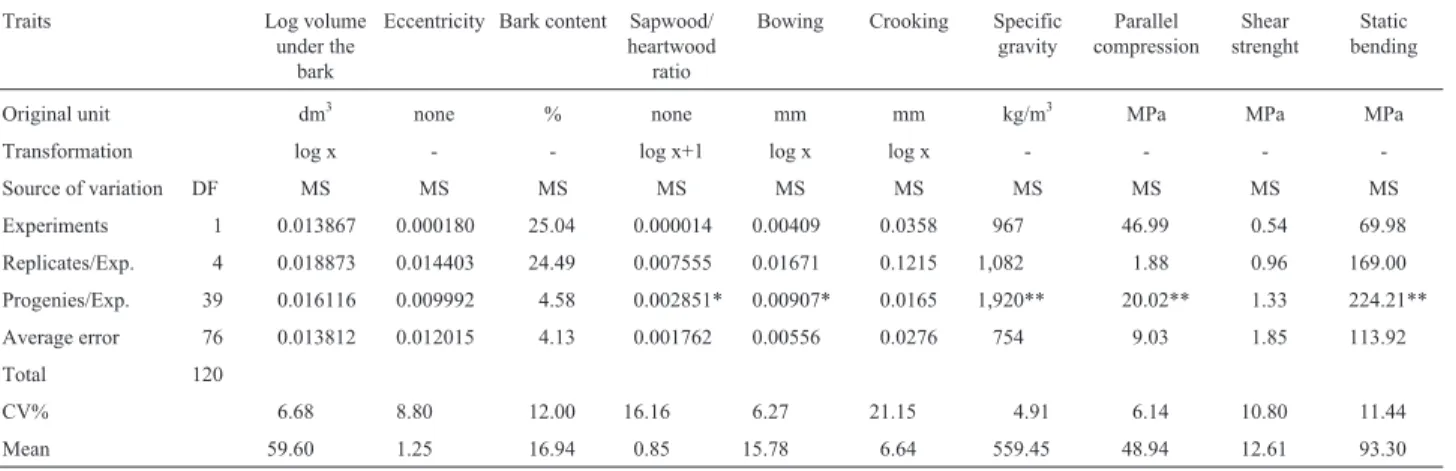
The genetic correlation between basic density and LESI was positive and intermediate (r = 0.439), while the phenotypic correlation was positive, but low (r = 0.206). Table 2- Analysis of variance for several traits in eight-year-oldE. grandison a plot mean basis (two plants).
Traits Log volume
under the bark
Eccentricity Bark content Sapwood/ heartwood ratio
Bowing Crooking Specific gravity
Parallel compression
Shear strenght
Static bending
Original unit dm3
none % none mm mm kg/m3
MPa MPa MPa
Transformation log x - - log x+1 log x log x - - -
-Source of variation DF MS MS MS MS MS MS MS MS MS MS
Experiments 1 0.013867 0.000180 25.04 0.000014 0.00409 0.0358 967 46.99 0.54 69.98
Replicates/Exp. 4 0.018873 0.014403 24.49 0.007555 0.01671 0.1215 1,082 1.88 0.96 169.00
Progenies/Exp. 39 0.016116 0.009992 4.58 0.002851* 0.00907* 0.0165 1,920** 20.02** 1.33 224.21**
Average error 76 0.013812 0.012015 4.13 0.001762 0.00556 0.0276 754 9.03 1.85 113.92
Total 120
CV% 6.68 8.80 12.00 16.16 6.27 21.15 4.91 6.14 10.80 11.44
Mean 59.60 1.25 16.94 0.85 15.78 6.64 559.45 48.94 12.61 93.30
DF: degrees of freedom, MS: mean square. *p < 0.05 and **p < 0.01.
Table 3- Estimates of heritability coefficients on a progeny mean basis (h$X2
), genetic variation coefficients (CVg%), and expected response to
selection (Gs(%))$ for nine traits evaluated in eight-year-oldE. grandis.
Trait h$2X CV
g% Gs(%)$ (2)
Basic density 0.34 (-0.07 to 0.64)(1) 2.38 1.73 (+)
Log end-splitting index 0.31 (-0.15 to 0.63) 9.08 7.69 (-)
Log volume under the bark 0.10 (-0.45 to 0.52) 0.04 0.59 (+)
Bark content 0.11 (-0.53 to 0.49) 2.41 1.21 (-)
Sapwood/heartwood ratio 0.39 (-0.05 to 0.65) 7.58 6.08 (-)
Bowing 0.39 (-0.04 to 0.66) 2.94 2.65 (-)
Specific gravity 0.61 (0.33 to 0.78) 3.56 3.36 (+)
Parallel compression 0.57 (0.24 to 0.75) 4.02 4.40 (+)
Static bending 0.50 (0.14 to 0.71) 6.62 6.25 (+)
(1): confidence interval at the 95% probability level.
(2): selection among progeny means for both sexes at 20% intensity; + or -indicates selection for increasing or decreasing the trait mean, respec-tively.
Table 4 - Estimates of the genetic correlation coefficients among progenies (rp) and the phenotypic correlation coefficients among progeny means (rF) for pairs of traits of interest in relation to sawn timber
production in eight-year-oldE. grandis.
Pairs of traits rp rF
Log volume under the bark x Basic density1 0.008 0.030
Basic density x Specific gravity 0.750 0.682**
Basic density x Log end-splitting index2 0.439 0.206
Sapwood/heartwood ratio x Bowing 0.924 0.326*
Log volume under the bark x Bowing -0.623 -0.144
Log volume under the bark x Log end-splitting index
0.405 0.332*
Log end-splitting index x Bowing -0.252 0.054
Specific gravity x Bowing 0.518 0.237
Specific gravity x Parallel compression 1.063 0.914**
Specific gravity x Static bending 0.813 0.703**
Basic density x Bowing 1.053 0.359*
Basic density x Parallel compression 0.976 0.721**
Basic density x Static bending 1.028 0.720**
1
Mean between 1stand 2ndpositions of disks in trees. 2Mean between log ends.
The genetic correlation between log volume under the bark and LESI was positive and intermediate (r = 0.405), whereas the phenotypic correlation between these two traits was slightly higher (r = 0.332). Hence, selecting for an in-crease in wood density and tree volume may negatively af-fect log end-splitting since a reduction in this trait is desirable.
The genetic correlation between log volume under the bark and bowing was negative and intermediate (r = -0.623), and the phenotypic correlation was also nega-tive and low (r = -0.144). From the point of view of an in-crease in tree diameter, greater dimensions may dein-crease the growth stress gradient between the tension and com-pression zones within the bole, thereby reducing the inter-nal strength that causes board bowing. This approach should be considered as a plausible explanation for the ex-istence of a highly positive genetic correlation between the sapwood/heartwood ratio and bowing (r = 0.924) and also for the positive phenotypic correlation between these traits (r = 0.326). Since bowing is an indicator of the original level of stress within the tree, it is desirable to select geno-types with lower values for this trait. The sapwood/heart-wood ratio should be used as an indirect trait to facilitate the selection procedures. This trait provides an indication of the amount of wood recently formed during secondary growth of the stem relative to that formed in the early stages of the tree life cycle. Heartwood generally has more stable physical and mechanical properties that represent impor-tant advantages when selecting trees for sawn timber pro-duction. Selecting trees with a lower sapwood/heartwood ratio is particularly important since growing trees soon leave the juvenile stage and begin to form adult wood of better quality at an earlier stage.
The genetic correlation between the LESI and bowing was negative and low (r = -0.252) and the phenotypic corre-lation was virtually null (r = 0.054). The genetic and phenotypic correlations between specific gravity and bow-ing were positive and of intermediate and low magnitude (r = 0.518 and 0.237, respectively). Finally, the genetic cor-relation between basic density and bowing was highly posi-tive (r = 1.053), while the phenotypic correlation was positive and intermediate (r = 0.359). Whereas the correla-tion between basic density and LESI was positive and inter-mediate, that between basic density and bowing was more pronounced. These findings showed that both the LESI and bowing were good indicators of the level of growth stress in these trees. In this regard, bowing is a more appropriate trait for an indirect assessment of growth stress, primarily be-cause of its lower vulnerability to errors during evaluation. Since the population showed an adequate basic density for sawn timber, there is little need to modify this trait. By not interfering with this trait, one also avoids a negative effect on the LESI and bowing.
The intermediate to highly positive genetic correla-tions seen between basic density and bowing and between
specific gravity and bowing suggested that a mutual dependence between these traits. Since board bowing is an indirect indicator of growth stress, we concluded that the magnitude of growth stress was influenced by wood den-sity. The same pattern of variation was seen for the correla-tion between basic density and the LESI, although of lower magnitude. This correlation reinforced the supposition that wood density was genetically closely related to the level of growth stress in this population.
In general, the main aspects considered in eucalypts breeding programs designed to improve the production of sawn timber are an increase in wood volume per tree and re-finement of the physical and mechanical properties of the wood to enhance its final use. Several studies have shown that growth rate and the main properties of wood (most of them directly dependent on the basic density) have no phenotypic and/or genetic relationship to the levels of growth stress in the tree (Malan, 1979, 1988b, 1991; Malan and Hoon, 1992; Schachtet al., 1998). In the present study, the phenotypic correlations generally showed the same pat-tern, particularly when the LESI was used as an indirect variable to assess growth stress. This finding was supported by the correlations between the log volume under the bark and the LESI and between basic density and the LESI, both of which were non-significant (Table 4). Although growth rate and wood density can be negatively correlated (Malan, 1988b, 1991), several studies in eucalypts have shown that this relationship is sometimes weak (Greaveset al., 1997; Tibbits and Hodge, 1998) or that the traits are unrelated to each other (Malan, 1993; DeBellet al., 2001). As already mentioned, the genetic and phenotypic correlations be-tween the log volume under the bark and basic density were practically null. In a coetaneous population of trees such as studied here, the individual volume of each tree represents its rate of growth, and this allows direct comparisons with the results of other studies.
For the population investigated here, joint selection for a high growth rate, a wood density adjusted for the final intended use, and a low level of growth stress would be dif-ficult because of the correlations among these traits. Ideally, during selection, an appropriate balance between the basic density, bowing and the LESI should be reached in order to provide wood with the desired properties. One possible strategy would be to increase the basic density a little without causing significant losses to bowing and the LESI, both of which are closely related to sawn timber pro-duction. The negative genetic correlation seen between log volume under the bark and bowing tends to favor an in-crease in wood production and a dein-crease in the level of growth stress.
which they can be measured. This was particularly the case for the sapwood/heartwood ratio, bowing and specific gravity. Although the use of genetic correlations as a tool for selecting appropriate traits can create some problems, overall this approach generally facilitates the selection pro-cedure. The strategy chosen may involve an increase in the volumetric production of wood and a decrease in the sap-wood/heartwood ratio, in association with the low selection intensity of basic density or specific gravity. Such an ap-proach would be expected to result in significant gains in wood productivity and timber quality.
In summary, the ideotype of eucalyptus trees studied here can be described as highly vigorous, with good stem formation, a high growth rate, a low sapwood/heartwood ratio, intermediate wood density (or specific gravity), mini-mal log end-splitting and low board bowing. Appropriate selection for these traits should help to improve the final quality of timber obtained from eucalypt trees.
Acknowledgements
The authors thank Celina Ferraz do Valle, César Au-gusto V. Bonine, Marcelo Onuki, Votorantim Celulose e Papel and Eucatex S/A Indústria e Comércio for the techni-cal and operational support they provided during this work.
References
Chafe SC (1979) Growth stress in trees. Aust For Res 9:203-223. Conradie WE (1980) Utilization of South African grown
Eucalyp-tus grandis(W. Hill ex Maiden) as veneer logs. Part 1: Con-trol of end splitting in veneer logs. Special Report n. 206, National Timber Research Institute/CSIR, Pretoria, 27 pp. DeBell DS, Keyes CR and Gartner BL (2001) Wood density of
Eucalyptus salignagrown in Hawaiian plantations: Effects of silvicultural practices and relation to growth rate. Aust For 64:106-110.
Garcia JN, Crêspo EA and Baillères H (2001) Influence of log characteristics and machines performance on Eucalyptus board end splitting and board deflections. In: Szymani R (ed) Proceedings of The 15thInternational Wood Machining Seminar, Los Angeles, USA, pp 163-171.
Greaves BL, Borralho NMG, Raymond CA, Evans R and White-man P (1997) Age-age correlations in, and relationships be-tween basic density and growth inEucalyptus nitens. Silvae Genet 46:264-270.
Hillis WE (1978) Wood quality and utilization. In: Hillis WE and Brown AG (eds) Eucalypts for Wood Production. 2nd edi-tion. CSIRO, Adelaide, pp 259-289.
Knapp SJ, Stroup WW and Ross WM (1985) Exact confidence in-tervals for heritability on a progeny mean basis. Crop Sci 25:192-194.
Kubler H (1987) Growth stresses in trees and related wood prop-erties. For Abst 48:131-189.
Malan FS (1979) The control of end splitting in sawlogs: A short literature review. S Afr For J 109:14-18.
Malan FS (1984) Studies on the phenotypic variation in growth stress intensity and its association with tree and wood
prop-erties of South African grownEucalyptus grandis(Hill ex Maiden). PhD thesis, University of Stellenbosch, Stellenbosch.
Malan FS (1988a) Wood density variation in four trees of South African grownEucalyptus grandis(Hill ex Maiden). S Afr For J 144:36-42.
Malan FS (1988b) Relationships between growth stress and some tree characteristics in South African grown Eucalyptus grandis. S Afr For J 144:43-46.
Malan FS (1988c) Genetic variation in some growth and wood properties among 18 full-sib families of South African grown Eucalyptus grandis: A preliminary investigation. S Afr For J 146:38-43.
Malan FS (1991) Variation, association and inheritance of juve-nile wood properties ofEucalyptus grandisHill ex Maiden with special reference to the effect of rate of growth. S Afr For J 157:16-23.
Malan FS (1993) The wood properties and qualities of three South African-grown eucalypt hybrids. S Afr For J 167:35-44. Malan FS (1995)Eucalyptusimprovement for lumber production.
In: IPEF, IPT, IUFRO and ESALQ (eds) Anais do Seminário Internacional de Utilização da Madeira de Eucalipto para Serraria, São Paulo, Brazil, pp 1-19. Malan FS and Hoon M (1992) Effect of initial spacing and
thin-ning on some wood properties ofEucalyptus grandis. S Afr For J 163:13-20.
Morán GF and Bell JC (1983) Eucalyptus. In: Tanksley DS and Orton TJ (eds) Isozymes in Plant Genetics and Breeding -Part B. Elsevier, Amsterdam, pp 423-441.
Mori ES (1993) Variabilidade genética isoenzimática em uma população deEucalyptus grandisHill ex Maiden submetida a diferentes intensidades de seleção. Doctoral thesis, Universidade de São Paulo, Piracicaba, SP.
Nicholson JE (1973) Growth stress differences in eucalypts. For Sci 19:169-174.
Resende MDV, Vencovsky R and Fernandes JSC (1995) Selec-tion and genetic in populaSelec-tions ofEucalyptuswith mixed mating system. In: Proceedings of the IUFRO Conference on Eucalypt Plantations: Improving Fibre Yield and Quality. Hobart, Australia, pp 191-193.
Santos PET, Geraldi IO and Garcia JN (2003) Estimates of ge-netic parameters for physical and mechanical properties of wood inEucalyptus grandis. Sci For 63:54-64.
Schacht L, Garcia JN and Vencovsky R (1998) Genetic variation of growth stress indicators in clones of Eucalyptus urophylla. Sci For 54:55-68.
Tibbits W and Hodge G (1998) Genetic parameters and breeding value predictions forEucalyptus nitenswood fiber produc-tion traits. For Sci 44:587-598.
Vencovsky R and Barriga P (1992) Genética Biométrica no Fitomelhoramento. Sociedade Brasileira de Genética, Ribeirão Preto, 486 pp.
Wilkins AP (1986) Nature and origin of growth stresses in trees. Aust For 49:56-62.
Yang JL and Fife D (2000) Wood properties of three provenances of plantation-grownEucalyptus globulusLabill. I. Growth strain. In: Proceedings of the IUFRO Conference on The Fu-ture of Eucalypts for Wood Products, Launceston, Australia, pp 301-309.