Characterization of the
Arachis
(Leguminosae) D genome
using fluorescence
in situ
hybridization (FISH) chromosome markers
and total genome DNA hybridization
Germán Robledo
1and Guillermo Seijo
1,21
Instituto de Botánica del Nordeste, Corrientes, Argentina.
2
Facultad de Ciencias Exactas y Naturales y Agrimensura, Universidad Nacional del Nordeste,
Corrientes, Argentina.
Abstract
Chromosome markers were developed forArachis glandulifera using fluorescence in situ hybridization (FISH) of the 5S and 45S rRNA genes and heterochromatic 4’-6-diamidino-2-phenylindole (DAPI) positive bands. We used chro-mosome landmarks identified by these markers to construct the firstArachis species ideogram in which all the ho-mologous chromosomes were precisely identified. The comparison of this ideogram with those published for other Arachis species revealed very poor homeologies with all A and B genome taxa, supporting the special genome con-stitution (D genome) ofA. glandulifera. Genomic affinities were further investigated by dot blot hybridization of biotinylatedA. glandulifera total DNA to DNA from several Arachis species, the results indicating that the D genome is positioned between the A and B genomes.
Key words:chromosome markers, DAPI bands, rDNA loci, dot blot hybridization, genome relationships. Received: June 29, 2007; Accepted: November 22, 2007.
Introduction
The genusArachiscomprises 80 wild species and the cultivated crop Arachis hypogaea L. (Fabales, Legumi-nosae) commonly known as groundnut or peanut. All
Arachisspecies are native to South America and have been arranged taxonomically into nine sections based on mor-phological characters and cross-compatibility relationships (Krapovickas and Gregory, 1994). Species within section
Arachisare distinguished from those belonging to other sections by having tap roots, erect main stems, prostrate lat-eral branches, tetrafoliate leaves, vertical pegs and flowers without prominent veins (Krapovickas and Gregory, 1994). This section comprises 29 wild diploid species (2n = 2x = 20, 2n = 2x = 18) and two allopolyploids entities (2n = 4x = 40), the cultigenA. hypogaeaand its presumed wild progenitorArachis monticola(Krapovickas and Greg-ory, 1994; Fernández and Krapovickas, 1994; Lavia, 1996, 2000; Peñaloza and Valls, 2005; Valls and Simpson, 2005). Diploid species have received particular attention because they are being used as sources for several agronomic traits, including resistance to various pests and diseases, drought resistance and different life-cycle spans (Singh, 1986;
Bu-rowet al., 2001; Simpson, 2001; Mallikarjuna, 2002;
Mal-likarjunaet al., 2004). For this reason, great efforts have been directed towards understanding the relationships be-tween species, with particular attention to the genetic com-patibility between the wild taxa and the cultivated peanut.
Except for the species with 2n = 18, for which the ge-nome identity still remains uncertain, three different geno-mes have been proposed within sectionArachisbased on chromosome features and cross-compatibility relationships (Smarttet al., 1978; Singh and Moss, 1982, 1984; Singh, 1986; Stalker, 1991; Singh and Smartt, 1998). Most of the species have symmetric karyotypes, mainly composed of metacentric chromosomes, which have been assigned to ei-ther A or the B genome types. The A genome is character-ized by a small chromosome pair, the “A chromosome” (Husted, 1931; Smarttet al., 1978) and has been confirmed in 16 wild diploidArachisspecies (Fernández and Krapovi-ckas, 1994; Lavia, 1996, 2000; Peñaloza and Valls, 2005). The A genome species also have heterochromatic bands in all, or almost all, of their chromosomes and are homoge-neous in their gross karyotype structure (Seijoet al., 2004). The remaining species with a symmetric karyotype do not have the “A chromosome” pair and have been traditionally included in the B genome. These taxa are more diverse in karyotype formula and in the presence and distribution of www.sbg.org.br
Send correspondence to Guillermo Seijo. Instituto de Botánica del Nordeste, Casilla de Correo 209, Sargento Cabral 2131, Corrien-tes, Argentina. E-mail: [email protected].
heterochromatin (Raina and Mukai, 1999; Seijo et al.,
2004). Tetraploid species have an AABB genome constitu-tion, and it has been demonstrated that they originated by hybridization of two wild diploid species, one with the A genome and the other with the B genome (Gregory and Gregory, 1976, 1979; Seijoet al., 2007).
The D genome is the third so far described for the sec-tion and it has been proposed to be exclusive toArachis glandulifera. The assignment of a different genome type for this species was mainly based on morphological traits and results from interspecific crossings, using Arachis duranensis(A genome) andArachis batizocoi(B genome) as representatives of their genome type (Stalker, 1991). Al-though hybrids have been obtained in low frequency from those crosses, all the plants were highly sterile. However, the chromosome pairing of the hybrids into five to eight bi-valents at meiotic metaphase demonstrated a certain degree of homology between the chromosomes ofA. glandulifera
and those ofA. duranensisandA. batizocoi.
According to the available cytogenetic data, A. glanduliferais characterized by an asymmetric karyotype made up of several submetacentric and subtelocentric chro-mosomes and without the small “A chromosome pair”. However, different karyotype formulas have been propo-sed by different authors for the four populations so far known of this species (Stalker, 1991; Fernández and Kra-povickas, 1994). Some of the differences observed in chro-mosome morphology were attributed to polytypic varia-tion, while others were considered as miss-identification of chromosomes (Fernández and Krapovickas, 1994).
Concerning the genomic relationships, it has been hy-pothesized that A. glandulifera has evolved from other
member of the section through pericentric inversions and/or translocations (Stalker, 1991). In this sense, and from a karyotype point of view, the main candidate would beA. batizocoi, since according to Fernández and
Krapo-vickas (1994) it is the species within sectionArachiswith
the least symmetric karyotype aside fromA. glandulifera.
Different analyses using molecular markers have shown a closer relationship betweenA. glanduliferaand the B genome group of species, particularly withA. batizocoi, and a more distant relationship with the A genome species (Millaet al., 2005; Talluryet al., 2005). However, analysis of the plastid trnT-L region has shown thatA. glandulifera
lies in an unresolved polytomy out of the clusters formed by A and B genome species (Tallury et al., 2005). Addi-tionally, a simple sequence repeat (SSR) analysis by Mo-retzsohnet al.(2004) showed thatA. glanduliferaformed a cluster with one 2n = 18 species and withArachis cruziana. Therefore, the relationship of A. glandulifera with other species within sectionArachisis still not well understood. Moreover, in spite of much effort the exact genome identity of A. glandulifera is still unresolved and the molecular methods employed so far have not generated fingerprintings for the D genome.
Detection of rRNA genes by fluorescentin situ
hy-bridization (FISH) has proved to be a useful tool in studies of plant genome organization, chromosome homeologies, cytotaxonomy and evolution (Jiang and Gill, 1994; Mos-coneet al., 1999; Limet al., 2000; Nakamuraet al., 2001).
Raina and Mukai (1999) applied this approach to a few
Arachisspecies and demonstrated that the number of
ribo-somal rDNA loci is variable. Subsequently, the mapping of these sites and heterochromatic bands provided new infor-mation on the genomic characterization and phylogenetic relationship of the group (Seijoet al., 2004). Furthermore,
physical mapping of chromosome markers allowed the es-tablishment of several homeologies between species and served as a base for the construction of a comparative FISH-basedArachisgenetic map (Seijoet al., 2004).
In the present study, we investigate the genomic af-finities ofA. glanduliferawith representative species of the A and B genomes by comparing several chromosome land-marks and by total genome DNA hybridization. We con-structed the first karyotype for anArachisspecies in which all the homologous chromosomes were identified by physi-cally mapping the 5S and 45S rRNA gene loci by FISH and by the establishment of heterochromatic 4’-6-diamidino-2-phenylindole (DAPI) positive banding patterns. The cytogenetic landmarks developed allowed a precise charac-terization of the D genome and the establishment of some homeologies with the published karyotype for other
Arachisspecies. The data provided will contribute to the characterization of wildArachisspecies, thereby aiding in understanding the variability contained in the secondary gene pool ofA. hypogaea.
Materials and Methods
Plant material and chromosome preparations
Vouchers specimens of the three populations of
re-moval of the coverslip with gas carbon dioxide the slides were air dried, aged for one to two days at room tempera-ture and stored at - 20 °C until use.
Probe labeling and fluorescentin situhybridization
The 5S rDNA and 45S rDNA loci were localized us-ing the probes amplified from total DNA ofA. hypogaea
subsp.fastigiataWaldron var.aequatorianaKrapov. and W.C. Gregory (race Zaruma. Ecuador, Quito, Collection Number: Banks, Pietrarelli and Zurita 683). For the 5S rDNA loci were detected by the plasmid clone pA5S, which contains a 326 bp fragment corresponding to 5S rRNA gene repeated unit and the adjacent intergenic spacer of A. hypogaea; amplified using the primers: A5Sfwd (5’-GAG GAATTCTAGGATGGGTGAC-3’) and A5Srev (5’-TCC GAATTCTACTCTCGCCC-3’). The 45S rDNA loci were detected using an equimolar mixture of the plasmid clones pA18S and pA26S. The plasmid clone pA18S contains a 1572 bp fragment corresponding to the coding region of the 18S rRNA gene ofA. hypogaea, amplified using the prim-ers: A18Sfwd (5’-GCTAATACGTGCAACAAACCCC G-3’) and A18Srev (5’-GGACTTCTCACAACGTCGCC
G-3’). The plasmid clone pA26S contains a 3366 bp frag-ment corresponding to the coding region of the 26S rRNA gene of A. hypogaea, amplified using the primers: A26Sfwd (5’-GATTCCCCTAGTAACGGCGAG-3’) and A26Srev (5’-TGGATCGTGGCAGCAAGGCC-3’). The three amplified fragments were cloned in pGEM®-T Easy vector (Promega) and their identities were determined by sequencing.
Probes were labeled by nick translation with digoxi-genin-11-dUTP (Boehringer) or biotin-11-dUTP (Sigma). Pretreatment of preparations, chromosome and probe dena-turation, conditions for the in situ hybridization, post-hybridization washing, blocking and indirect detection by fluorochrome conjugated antibodies were performed ac-cording to Moscone et al. (1996). The concentration of each DNA probes used in the hybridization mixes was of 2.5 ngµL-1to 3.5 ngµL-1. The first set of antibodies
con-sisted of mouse biotin (Dakopatts) and sheep anti-digoxigenin conjugated to fluorescein isothiocyanate (FITC) (Boehringer). The second set of antibodies con-sisted of rabbit anti-mouse conjugated to tetramethyl-rho-damine isothiocyanate (TRITC) (Dakopatts) and
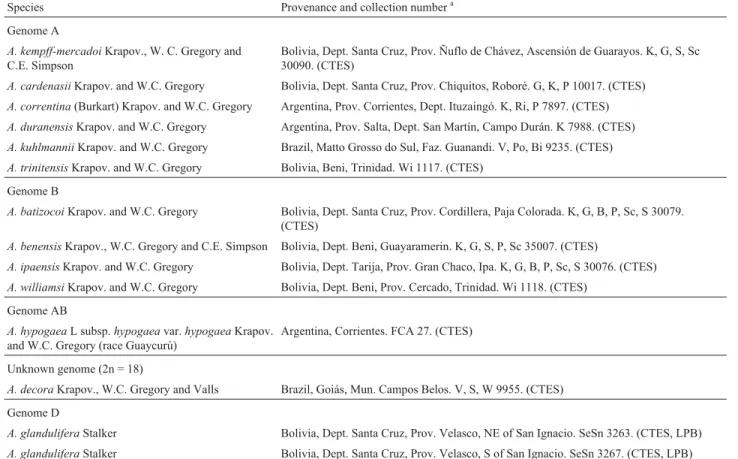
FITC-Table 1- List of theArachisspecies and accessions used for fluorescencein situhybridization (FISH) and dot blot analysis.
Species Provenance and collection numbera
Genome A
A. kempff-mercadoiKrapov., W. C. Gregory and C.E. Simpson
Bolivia, Dept. Santa Cruz, Prov. Ñuflo de Chávez, Ascensión de Guarayos. K, G, S, Sc 30090. (CTES)
A. cardenasiiKrapov. and W.C. Gregory Bolivia, Dept. Santa Cruz, Prov. Chiquitos, Roboré. G, K, P 10017. (CTES)
A. correntina(Burkart) Krapov. and W.C. Gregory Argentina, Prov. Corrientes, Dept. Ituzaingó. K, Ri, P 7897. (CTES)
A. duranensisKrapov. and W.C. Gregory Argentina, Prov. Salta, Dept. San Martín, Campo Durán. K 7988. (CTES)
A. kuhlmanniiKrapov. and W.C. Gregory Brazil, Matto Grosso do Sul, Faz. Guanandi. V, Po, Bi 9235. (CTES)
A. trinitensisKrapov. and W.C. Gregory Bolivia, Beni, Trinidad. Wi 1117. (CTES)
Genome B
A. batizocoiKrapov. and W.C. Gregory Bolivia, Dept. Santa Cruz, Prov. Cordillera, Paja Colorada. K, G, B, P, Sc, S 30079. (CTES)
A. benensisKrapov., W.C. Gregory and C.E. Simpson Bolivia, Dept. Beni, Guayaramerin. K, G, S, P, Sc 35007. (CTES)
A. ipaensisKrapov. and W.C. Gregory Bolivia, Dept. Tarija, Prov. Gran Chaco, Ipa. K, G, B, P, Sc, S 30076. (CTES)
A. williamsiKrapov. and W.C. Gregory Bolivia, Dept. Beni, Prov. Cercado, Trinidad. Wi 1118. (CTES)
Genome AB
A. hypogaeaL subsp.hypogaeavar.hypogaeaKrapov. and W.C. Gregory (race Guaycurú)
Argentina, Corrientes. FCA 27. (CTES)
Unknown genome (2n = 18)
A. decoraKrapov., W.C. Gregory and Valls Brazil, Goiás, Mun. Campos Belos. V, S, W 9955. (CTES)
Genome D
A. glanduliferaStalker Bolivia, Dept. Santa Cruz, Prov. Velasco, NE of San Ignacio. SeSn 3263. (CTES, LPB)
A. glanduliferaStalker Bolivia, Dept. Santa Cruz, Prov. Velasco, S of San Ignacio. SeSn 3267. (CTES, LPB)
A. glanduliferaStalker Bolivia, Dept. Santa Cruz, Prov. Velasco, S of Concepción. SeSn 3230. (CTES, LPB)
aB = D. Banks, Bi = L.B. Bianchetti, G = W.C. Gregory, K = A. Krapovickas, p = J. Pietrarelli, Po = A. Pott, Ri = V.A. Rigoni, S = C.E. Simpson, Sc = A.
conjugated rabbit anti-sheep (Dakopatts). Preparations were counterstained and mounted with Vectashield me-dium (Vector Laboratories, USA) containing 2 mg mL-1of
DAPI. The DAPI counterstaining subsequent to FISH re-sulted in a C-banding like pattern with major heteromatic bands fluorescing more intensely, aiding in the chro-mosome identification (Moscone et al., 1996, 1999).
Chromosomes were viewed and photographed with a Leica DMRX epifluorescence microscope (Leica) equipped with a computer-assisted Leica DC 350 digital camera system. Red, green and blue images were captured in black and white using appropriate filters for TRITC, FITC, and DAPI excitation, respectively. Digital images were combined us-ing IM 1000 Leica software and then imported into Photo-shop, version 7.0 (Adobe) for final processing.
Karyotype analysis was accomplished using at least five metaphase plates per plant for chromosome measure-ments using the free version of the MicroMeasure 3.3 pro-gram. The centromeric index (CI), calculated as CI = short arm length (µm) x 100/chromosome length (µm), was used
to classify the chromosomes as metacentric (m) with CI = 50 to 37.51, submetacentric (sm) with CI = 37.50 to 25.01 or subtelocentric (st) with CI = 25 to 12.51 (Levanet al., 1964). Different lengths of the same arm (and band/lo-cus, where applicable) from homologous chromosomes were combined, mean values calculated and then repre-sented in the haploid complements of the ideograms. Each chromosome pair was ordered in groups according to mor-phology and within each group by decreasing size. Accord-ingly, they were named from D1 to D10, where D is used in reference to the D genome. Intercalary markers were map-ped using the di index calculated as di = d x 100/a, where d = distance (µm) of band center from the centromere and
a = length (µm) of the corresponding chromosome arm
(Greilhuber and Speta, 1976).
Dot blot assays
Genomic DNA of 11 wild diploid species belonging either to the A or B genomes and to the cultigen A. hypogaea (Table 1) were spotted onto Zeta-Probe nylon membranes (Bio-Rad). Representative diploid species hav-ing the A genome were selected accordhav-ing to the groups proposed by Gregory and Gregory (1976), and those bear-ing the B genome considerbear-ing their geographical distribu-tion and the presence or absence of heterochromatic bands in their karyotypes. For each species three dots with 0.50, 0.25 and 0.125µg of genomic DNA were applied to the
membrane, which was then incubated in pre-hybridization solution (containing: formamide, 60% (v/v); SDS, 7% (w/v); Na2HPO4, 0.12 M (pH 7.2); NaCl, 0.25 M; EDTA, 1
mM) at 37 °C for 1 h. For hybridization, 600 ng ofA. glandulifera (Accession number: SeSn 3263) denatured biotinylated total DNA was added to the pre-hybridization solution and incubated at 37 °C overnight. Post-hybri-dization washes were performed in 2x standard saline
ci-trate (SSC), 0.5x SSC and 0.2x SSC for 5 min each at room temperature (all washing solution contained 0.1% (w/v) SDS). Under this stringency condition, at least 80% to 85% identity of nucleotide sequence is necessary for hybridiza-tion. Hybridized biotinylated DNA was visualized by colo-rimetric detection using streptavidin/alkaline phosphatase conjugate (Amersham Biosciences) and SIGMA FAST
NBT-BCIP (Sigma). All chemicals from Sigma unless oth-erwise stated.
Results
Chromosome identification and construction of a detailed ideogram
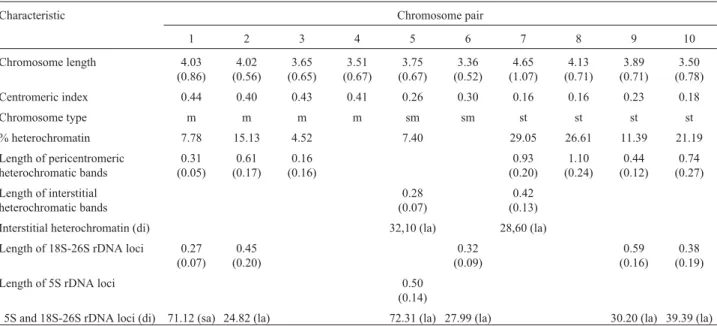
A consensus ideogram based on the measurements of the metaphases from five plants of three analyzed popula-tions, together with the chromosome markers generated by mapping the rDNA loci and the DAPI+ heterochromatic blocks was developed (Figure 1a). The karyotype formula was 8 m + 4 sm + 8 st (Table 2), with a chromosome length ranging between 3.36µm and 4.65µm and a mean length of
the haploid karyotype of 38.22µm±6.32µm. The indexes
of asymmetry A1 and A2 revealed a moderate degree of intrachromosomal asymmetry (A1 = 0.49), but low inter-chromosomal asymmetry (A2 = 0.09).
The D2 chromosome pair bore a macrosatellite in the long arm and displayed an extended paracentromeric sec-ondary constriction. Eight chromosome pairs had DAPI+ heterochromatic bands and the total amount of this type of heterochromatin per haploid karyotype was 13.09%. The bands were mainly pericentromeric, but they showed vari-able size and intensity allowing homologous identification (Figure 1b). Subtelocentric chromosomes had the biggest heterochromatic blocks, reaching up to 29.05% of the chro-mosome length in the D7 pair. The remaining chromo-somes bearing bands had small and faint blocks corre-sponding to less than 7.78% of the total length, except for the satellited chromosomes that showed a medium-sized band (Table 2). The D7 pair was characterized by the pres-ence of two heterochromatic blocks, one pericentromeric and the other interstitial, whereas the D5 pair was unique since it presented only an interstitial band. The chromo-somes without bands corresponded to the metacentric D4 and submetacentric D6 pairs, which are the smallest of the karyotype.
Thein situhybridization revealed only one 5S rDNA
locus located in a subterminal position on the long arms of the D5 pair in all the accessions analyzed, although up to ten loci for the 45S rRNA genes were observed (Figure 1b). Chromosome pair D2 was hybridized all along the ex-tended secondary constrictions, indicating that they bore the ribosomal gene clusters participating in the formation of the nucleolus in the preceding interphase. The D9 and D10 subtelocentric pairs presented high-intensity intersti-tial hybridization sites on the long arms, while faint signals were observed in subterminal position on the short arms of pair D1 and in the interstitial position on the long arms of D6 pair. The pattern of signal intensity for the 45S rDNA sites described was constant for all the analyzed meta-phases. However, some differences in the number of 45S
rDNA sites were observed between populations. The larg-est number of sites observed in the metaphases analysed was ten for the A. glandulifera accession SeSn 3263,
whereas accession SeSn 3230 presented eight sites and SeSn 3267 six sites. The differences found corresponded to the absence of the subterminal hybridization sites on chro-mosome pair D1 for accessions SeSn 3267 and SeSn 3230, and an interstitial site on chromosome pair D6 for accession SeSn 3267.
Genome affinity ofA. glanduliferawith other species
of sectionArachiswas investigated using the patterns of
genomic DNA hybridization betweenA. glanduliferaand
11 wild diploid species (Figure 2). Biotinylated DNA ofA. glandulifera showed a strong hybridization signal with
most of the species at the higher DNA concentrations dots (0.25µg and 0.50µg), hampering the determination of any
genome affinity. Nevertheless, hybridization differences were evident in the dots with 0.125µg of DNA. The A
ge-nomeArachis trinitensis,Arachis kuhlmanniiandArachis
Figure 1- Ideogram and somatic metaphase ofArachis glandulifera. (a) Ideogram in which the distribution of 5S (yellow-green) and 45S rDNA loci (red), and 4, 6-diamidino-2-phenylindole (DAPI) + heterochromatic bands (blue) are represented. The indifferent DAPI-stained chromatin is represented without color. The chromosomes were ordered primarily by morphology and secondarily by decreasing size. (b) Somatic metaphase after double fluorescentin situhybridization (FISH), showing yellow-green fluorescein isothiocyanate (FITC) signals from 5S rDNA probe and red tetramethyl-rhodamine isothiocyanate (TRITC) signals from the 45S rDNA probe. The DAPI counterstaining (light blue) subsequent to the FISH procedure was used to highlight the heterochromatin bands and to stain euchromatin. The same number identified homologous chromo-somes. In the case of D2 chromosome pair the short arm and the proximal segment of the long arm are indicated by the degree symbol and the sepa-rated satellite is marked by an asterisk. Scale bar = 5µm.
Figure 2- Dot blot assay revealing the genome affinities ofArachis glanduliferawith representative diploidArachisspecies having the A and B genome. Biotinylated total DNA from ofA. glandulifera(SeSn 3263) was hybridized to dots with total DNA of 11 diploidArachisspecies and
kempff-mercadoiand the B genomeArachis ipaensisand
Arachis williamsipresented the strongest signals, whereas the hybridizations of the remaining species were weak. The only species which showed very low affinity with A. glandulifera at any DNA concentration was Arachis decora, which belongs to the small group of species having 2n = 18 chromosomes.
Discussion
Genomic inferences by means of chromosome analy-sis consider that species with homologous genomes may show similar karyotypes and display similar patterns of chromosome markers as opposed to those with dissimilar genomic backgrounds. Based on this, we used molecular cytogenetic techniques to explore the chromosomes ofA. glandulifera and obtain valuable information to test the
uniqueness of its genome within sectionArachis, and
whe-ther-or -not any karyotype affinity with other species could be established. The bulk of chromosome markers found al-lowed the unequivocal identification of all the complement pairs and the construction of the first wholly-resolved
Arachisideogram, which could not only be a useful
refer-ence for the location of new chromosomal markers but also to correlate theArachisgenetic linkage map with physical
chromosomes.
The karyotype formula of 8 m + 4 sm + 8 st forA. glanduliferarevealed by FISH was similar to that reported by Fernández and Krapovickas (1994). The small differ-ences in chromosome morphology observed could be ex-plained as an artifact caused by the proteinase treatment used for chromosome permeation (Schwarzacher and Heslop-Harrison, 2000).
The unimodality of the A. glandulifera karyotype, shown by a low A2 index is a character shared with all other species of the section, although the moderate degree of intrachromosomal asymmetry (A1) is a distinguishing trait of this taxon.
Our DAPI banding analysis demonstrated a very cha-racteristic pattern of heterochromatin distribution. The presence of big heterochromatic blocks at pericentromeric and interstitial positions on the subtelocentric chromo-somes, including up to one third of the length of the longest chromosomes of the karyotype, were not observed in any other species ofArachis.In spite of these large blocks, the percentage of total heterochromatin per haploid karyotype (13.09%) is just below that observed for other A or B ge-nome diploid species with heterochromatic bands (Seijoet al., 2004). The maintenance of the amount of heterochro-matin per haploid genome inA. glanduliferaresides in the fact that two pairs of its complement have no DAPI+ bands. It has been shown thatArachisspecies usually have all, or almost all, the chromosomes of the complement with pericentromeric bands (A genome species) or without bands (B genome species) (Raina and Mukai, 1999; Seijoet al., 2004). Within the latter group,A. batizocoiis an excep-tion since it has heterochromatic bands in all chromosome pairs except one (Seijoet al., 2004). This feature, together with the fact that the small A chromosomes are absent in D genome species, show that the complement ofA. batizocoi
is the most similar to that ofA. glandulifera.
The analysis of 45S rRNA genes demonstrated thatA. glandulifera has the highest number of sites so far de-scribed for any diploid species ofArachis. The larger 45S rDNA locus on the active nucleolar-organizing regions of chromosome D2 is similar in size and position to the active
Table 2- Average chromosome measures ofArachis glandulifera. Measurements (µm) are expressed as mean length and standard deviation (in brack-ets). m = metacentric, sm = submetacentric, st = subtelocentric, sa = short arm, la = long arm, di = distance index (Greilhuber and Speta, 1976).
Characteristic Chromosome pair
1 2 3 4 5 6 7 8 9 10
Chromosome length 4.03
(0.86)
4.02 (0.56)
3.65 (0.65)
3.51 (0.67)
3.75 (0.67)
3.36 (0.52)
4.65 (1.07)
4.13 (0.71)
3.89 (0.71)
3.50 (0.78)
Centromeric index 0.44 0.40 0.43 0.41 0.26 0.30 0.16 0.16 0.23 0.18
Chromosome type m m m m sm sm st st st st
% heterochromatin 7.78 15.13 4.52 7.40 29.05 26.61 11.39 21.19
Length of pericentromeric heterochromatic bands
0.31 (0.05)
0.61 (0.17)
0.16 (0.16)
0.93 (0.20)
1.10 (0.24)
0.44 (0.12)
0.74 (0.27) Length of interstitial
heterochromatic bands
0.28 (0.07)
0.42 (0.13)
Interstitial heterochromatin (di) 32,10 (la) 28,60 (la)
Length of 18S-26S rDNA loci 0.27 (0.07)
0.45 (0.20)
0.32 (0.09)
0.59 (0.16)
0.38 (0.19)
Length of 5S rDNA loci 0.50
(0.14)
sites of other species of the section. However, the intersti-tial position of the non-active sites in chromosomes with bands is a special feature ofA. glandulifera. In other
spe-cies, when interstitial sites were observed, they were exclu-sively borne by one pair of unbanded chromosomes (Seijo
et al., 2004). The only exception isA. batizocoi, which has
interstitial loci of 45S rRNA genes on two chromosome pairs with heterochromatic bands. Therefore, according to the chromosome mapping of these genes,A. batizocoialso
appears as the species having the most similar karyotype to
A. glandulifera. The 5S rRNA gene clusters have always
been reported in paracentromeric position in all theArachis
species so far analyzed (Seijoet al., 2004), thus the distal
position of these loci on the long arms of chromosome pair D5 is also an exclusive character ofA. glandulifera.
The FISH signal strength of a particular locus is posi-tively related to the number of copies of the repeated se-quences present in the cluster (Mosconeet al., 1999 and
references included in it). Taking in account this relation-ship, the fact that signal intensity of the 45S rDNA sites on chromosome pairs D1 and D6 ofA. glanduliferaaccession
SeSn 3263 was very poor may indicate that these clusters have a low number of copies. Moreover, according to this rationale, loci number differences between accessions of different provenance could be attributed to either true poly-morphism or the presence of loci with copy number below the minimum sequence size resolved byin situ
hybridiza-tion.
Chromosome homeologies have been established be-tween species of the same genome type, and to a less extent between species of the A and B genome groups (Seijoet al., 2004). Comparison of theA. glandulifera ideogram with those so far published for otherArachisspecies revealed very few homeologies with all A genome species and with those species included in the B genome that lack hetero-chromatic bands. Although some homeologies could be es-tablished betweenA. glandulifera andA. batizocoi,there are still many gross karyotype differences that support the criteria for keepingA. glanduliferaas having a different ge-nome, the D type.
Molecular markers have shown thatA. glanduliferais more distantly related to the A genome species than to the B genome species (Millaet al., 2005; Tallury et al., 2005). Within the latter group,A. batizocoiappears as the species with higher genome affinity withA. glandulifera. These data are in agreement with our analysis on gross karyotype features and with the chromosome markers as well. How-ever, dot blot hybridization challenges those results, since
A. glanduliferaDNA showed less genomic affinity withA. batizocoi than with any other species of the B genome group and even than the species included in A genome group. Considering the B genome taxa, the fact that A. glanduliferaDNA showed strongest hybridization withA. williamsifollowed byA. ipaensis, resembles the results ob-tained with the analysis of the plastid trnT-L region, in
which A. glandulifera clustered in a sister clade to that
formed byA. batizocoiand some other B genome species
(Tallury et al., 2005). Moreover, in that analysis A. williamsiwas joined by a polytomy to the cluster of D
ge-nome species, whereasA. ipaensiswas included (although
with a low bootstrap value) into the base of the clade of the B genome species. On the other hand, the weaker hybrid-ization ofA. glanduliferaDNA withA. benensisis in
accor-dance with the phylogenetic analysis based on amplified fragment length polymorphism (AFLP) since these species clustered in different clades (Millaet al., 2005). The strong
hybridization ofA. glanduliferaDNA withA. trinitensis,A. kuhlmannii andA. kempff-mercadoi, which grouped into
the cluster of the A genome entities by AFLP analysis (Millaet al., 2005; Talluryet al., 2005; Moretzsohnet al.,
2004), may reflects an intermediate position of A. glanduliferabetween the A and B genome clades, as was
proposed from the analyses of the plastid trnT-L region (Talluryet al., 2005).
Dot blot analysis in plants relies largely on the hy-bridization of genome repetitive sequences since they are a major component of genomes. Rapid evolution of those se-quences can lead to changes in sequence motif and/or abun-dance of a particular sequence even between narrowly related species (Schmidt and Heslop-Harrison, 1998; Alkhimovaet al., 2004), without being necessarily related
to changes in the gross karyotype morphology (Ugarkovic and Plohl, 2002). This fact may explain, at least in part, the incongruence between molecular and chromosome data, reflecting differences in the rate and direction of evolution at each level.
In summary, our results have revealed the special genomic identity ofA. glanduliferaand although the data were not conclusive in determining the most related extant species toA. glanduliferathe data did show a general simi-larity between the karyotype of A. glandulifera and A. batizocoi.
Acknowledgments
This work was supported by the European Commis-sion, INCO-DEV Contract no. ICA4-CT-2001-10072; Consultative Group on International Agricultural Re-search, Challenge Program, subprogram “Trait capture for crop improvement”, period 2005-2008; Consenjo Nacional de Investigaciones Científicas y Técnicas (CONICET), Ar-gentina; PICT 2005 n. 34458, ANPCyT, Argentina. We would like to thanks Dirección general de biodiversidad, Ministerio de desarrollo sostenible y planificación, Bolivia, for authorizing botanical collections.
References
Burow MD, Simpson CE, Starr JL and Paterson A (2001) Trans-mission genetics of chromatin from a synthetic amphidi-ploid to cultivated peanut (Arachis hypogaea L.): Broa-dening the gene pool of a monophyletic polyploid species. Genetics 159:823-837.
Fernández A and Krapovickas A (1994) Cromosomas y evolución enArachis(Leguminosae). Bonplandia 8:187-220. Gregory WC and Gregory MP (1976) Groundnut. Arachis
hypogaea(Leguminosae-Papilionatae). In: Simmonds NW (ed) Evolution of Crop Plants. Longman Group Ltd, Lon-don, pp151-154.
Gregory MP and Gregory WC (1979) Exotic germplasm of
ArachisL. interspecific hybrids. J Hered 70:185-193. Greilhuber J and Speta F (1976) C-banded karyotypes in theScilla
hohenackerigroup, S.persicaandPuschkinia(Liliaceae). Plant Syst Evol 126:149-188.
Jiang J and Gill BS (1994) New 18S-26S ribosomal RNA gene loci: Chromosomal landmarks for the evolution of polyploid wheats. Chromosoma 103:179-185.
Krapovickas A and Gregory WC (1994) Taxonomía del género
Arachis(Leguminosae). Bonplandia 8:1-186.
Lavia GI (1996) Estudios cromosómicos enArachis (Legumi-nosae). Bonplandia 9:111-120.
Lavia GI (2000) Chromosome studies of wildArachis (Legu-minosae). Caryologia 53:177-181.
Levan A, Fredga K and Sandberg AA (1964) Nomenclature for centromeric position on chromosomes. Hereditas 52:201-220.
Lim KY, Matyasek R, Lichtenstein CP and Leitch AR (2000) Mo-lecular cytogenetic analyses and phylogenetic studies in the
NicotianasectionTomentosae. Chromosoma 109:245-258. Mallikarjuna N (2002) Gene introgression fromArachis glabrata
intoA. hypogaea,A. duranensisand A. diogoi. Euphytica 124:99-105.
Mallikarjuna N, Pande S, Jadhav DR, Sastri DC and Rao JN (2004) Introgression of disease resistance genes from
Arachis kempff-mercadoiinto cultivated groundnut. Plant Breed 123:573-576.
Milla SR, Isleib TG and Stalker HT (2005) Taxonomic relation-ships among Arachissect. Arachisspecies as revealed by AFLP markers. Genome 48:1-11.
Moretzsohn MC, Hopkins MS, Mitchell SE, Kresovich S, Valls JFM and Ferreira ME (2004) Genetic diversity of peanut (Arachis hypogaeaL.) and its wild relatives based on the analysis of hypervariable regions of the genome. BMC Plant Biol 4:11.
Moscone EA, Matzke MA and Matzke AJM (1996) The use of combined FISH/GISH in conjunction with DAPI counter-staining to identify chromosomes containing transgene in-serts in amphidiploid tobacco. Chromosoma 105:231-236. Moscone EA, Klein F, Lambrou M, Fuchs J and Schweizer D
(1999) Quantitative karyotyping and dual-color FISH map-ping of 5S and 18S-26S rDNA probes in the cultivated
Phaseolusspecies (Leguminosae). Genome 42:1224-1233. Nakamura R, Kitamura S, Inoue M, Ohmido N and Fukui K
(2001) Karyotype analysis of Nicotiana kawakamii Y. Ohashi using DAPI banding and rDNA FISH. Theor Appl Genet 102:810-814.
Peñaloza A and Valls JFM (2005) Chromosome number and sat-ellited chromosome morphology of eleven species of
Arachis(Leguminosae). Bonplandia 14:65-72.
Raina SN and Mukai Y (1999) Detection of a variable number of 18S-5.8S-26S and 5S ribosomal DNA loci by fluorescentin situhybridization in diploid and tetraploidArachisspecies. Genome 42:52-59.
Schmidt T and Heslop-Harrison JS (1998) Genomes, genes and junk: The large-scale organization of plant chromosomes. Trends Plant Sci 3:195-199.
Schwarzacher T, Ambros P and Schweizer D (1980) Application of Giemsa banding to orchid karyotype analysis. Plant Syst Evol 134:293-297.
Seijo JG, Lavia GI, Fernández A, Krapovickas A, Ducasse D and Moscone EA (2004) Physical mapping of 5S and 18S-25S rRNA genes evidences that Arachis duranensis and A. ipaensisare the wild diploid species involved in the origin of
A. hypogaea(Leguminosae). Amer J Bot 91:1294-1303. Seijo JG, Lavia GI, Fernández A, Krapovickas A, Ducasse DA,
Bertioli DJ and Moscone EA (2007) Genomic relationships between the cultivated peanut (Arachis hypogaea, Legu-minosae) and its close relatives revealed by double GISH. Amer J Bot 94:1963-1971.
Schwarzacher T and Heslop-Harrison P (2000) Practicalin situ
Hybridization. Bios, Oxford, 203 pp.
Simpson CE (2001) Use of wildArachisspecies / introgression of genes intoA. hypogaeaL. Peanut Sci 28:114-116.
Singh AK (1986) Utilization of wild relatives in the genetic im-provement ofArachis hypogaeaL. Part 8. Synthetic amphi-diploids and their importance in interspecific breeding. Theor Appl Genet 72:433-439.
Singh AK and Moss JP (1982) Utilization of wild relatives in ge-netic improvement ofArachis hypogaeaL. 2. Chromosome complements of species of section Arachis. Theor Appl Genet 61:305-314.
Singh AK and Moss JP (1984) Utilization of wild relatives in ge-netic improvement ofArachis hypogaeaL. 5. Genome anal-ysis in sectionArachisand its implications in gene transfer. Theor Appl Genet 68:355-364.
Singh AK and Smartt J (1998) The genome donors of the ground-nut/peanut (Arachis hypogaeaL.) revisited. Genet Res Crop Evol 45:113-118.
Smartt J, Gregory WC and Gregory MP (1978) The genomes of
Arachis hypogaea. 1. Cytogenetic studies of putative ge-nome donors. Euphytica 27:665-675.
Stalker HT (1991) A new species sectionArachisof peanuts with D genome. Amer J Bot 78:630-637.
Tallury SP, Hilu KW, Milla SR, Friend SA, Alsaghir M, Stalker HT and Quandt D (2005) Genomic affinities inArachis sec-tion Arachis (Fabaceae): Molecular and cytogenetic evi-dence. Theor Appl Genet 111:1229-1237.
Ugarkovic D and Plohl M (2002) Variation in satellite DNA pro-files-causes and effects. EMBO Journal 21:5955-5959. Valls JFM and Simpson CE (2005) New species ofArachisfrom
Brazil, Paraguay, and Bolivia. Bonplandia 14:35-64.
Internet Resources
MicroMeasure 3.3 program, http://www.colostate.edu/Depts/Bi-ology/MicroMeasure/.
Associate Editor: Marcelo Guerra