PONTIFÍCIA UNIVERSIDADE CATÓLICA DO RIO GRANDE DO SUL FACULDADE DE BIOCIÊNCIAS
PROGRAMA DE PÓS-GRADUAÇÃO EM BIOCIÊNCIAS - ZOOLOGIA
CARACTERIZAÇÃO DA VARIABILIDADE GENÉTICA E
AVALIAÇÃO DAS PROVÁVEIS ÁREAS DE ALIMENTAÇÃO
BASEADA NO DNA MITOCONDRIAL DA POPULAÇÃO DE
BALEIAS JUBARTE,
Megaptera novaeangliae
, NO BANCO DOS
ABROLHOS, BAHIA, BRASIL
Biól. Márcia Helena Engel Coitinho Orientador: Prof. Dr. Sandro Luis Bonatto Co-orientador: Dr. Howard C. Rosenbaum
DISSERTAÇÃO DE MESTRADO PORTO ALEGRE – RS - BRASIL
II
SUMÁRIO
III
IV
2. AGRADECIMENTOS
A realização deste trabalho somente foi possível graças ao apoio de vários amigos, colaboradores e instituições. O suporte financeiro foi proporcionado pela PETROBRAS e as análises de laboratório foram desenvolvidas pelo Centro de Biologia Genômica e Molecular da PUCRS com o financiamento da FAPERGS. Foram importantes parceiros na execução destes estudos o American Museum of Natural History/USA e o Projeto Baleias do Programa Antártico Brasileiro (PROANTAR) da Marinha do Brasil.
V
3. RESUMO
VI
4. ABSTRACT
Characterization of the genetic variability and evaluation of the likely feeding grounds based on the mitochondrial DNA of the humpback whale, Megaptera novaeangliae
population in the Abrolhos bank, Bahia, Brazil
1
5. APRESENTAÇÃO
O presente trabalho teve por objetivo estimar a variabilidade genética, a proporção sexual e determinar o sítio de alimentação do “ stock” (subpopulação) de baleias jubarte,
Megaptera novaeangliae, que utiliza o banco dos Abrolhos para reprodução e cria de filhotes. O conhecimento das áreas de alimentação e reprodução e da rota migratória das jubartes entre estas áreas agregam além disso subsídios para a defesa de proposta brasileira que será reapresentada em 2003 à Comissão Internacional da Baleia (IWC), órgão máximo que regulamenta a caça e conservação de grandes cetáceos no mundo, de criação do “Santuário do Atlântico Sul”, local onde as baleias estarão protegidas da caça comercial em uma das fases mais vulneráveis de sua vida.
As ações de pesquisa e conservação destes animais na região de Abrolhos são desenvolvidas desde 1988 pelo Projeto Baleia Jubarte, com o apoio do Parque Nacional Marinho dos Abrolhos/IBAMA, mais antiga unidade de conservação federal do país. Estudos de fotoidentificação, estimativa populacional, observações de comportamento, monitoramento do turismo e outros têm sido desenvolvidas e os estudos de genética iniciados em 1997 vêm agregar informações importantes para a ecologia e manejo da espécie.
As jubartes de ambos os hemisférios formam sazonalmente diferentes concentrações reprodutivas em latitudes tropicais. Cada subpopulação, apesar da ausência de barreiras geográficas evidentes, possui grande fidelidade a seu local de acasalamento, realizando migrações verticais para uma também específica área de alimentação em águas árticas ou antárticas. No hemisfério sul, a espécie possui seis sítios reprodutivos distintos, entre os quais o banco dos Abrolhos, no sul da Bahia, considerado a principal área de reprodução da espécie em todo o Oceano Atlântico Sul Ocidental. A Comissão Internacional da Baleia divide as áreas de alimentação das baleias na Antártida em também seis regiões principais, numeradas de I a VI. Considerando-se o padrão migratório vertical da espécie, as áreas definidas como I e II, situadas respectivamente entre os meridianos 60ºW e 120ºW e 0ºW e 60ºW constituiriam o provável local de alimentação das jubartes brasileiras.
2
subpopulações ou espécies. Devido a suas elevadas taxas de mutação, transmissão somente pelas fêmeas e ausência de recombinação, o DNA mitocondrial oferece vantagens sobre outras regiões do genoma como a nuclear nos estudos de variabilidade genética, padrões de distribuição e fluxo gênico entre populações.
3
Mitochondrial DNA variability and evaluation of the likely feeding
grounds of the humpback whale (
Megaptera novaeangliae)
population of
the Abrolhos bank, Bahia, Brazil
Márcia H Engel *1,2, Nelson JR Fagundes2, Howard C Rosenbaum 3,4, Paulo H Ott 5, Renata Schmitt 2 & Sandro L Bonatto 2
1
Projeto Baleia Jubarte/Instituto Baleia Jubarte – Rua 7 de Setembro 178 – 45900-000 Caravelas, Bahia, Brazil
2
Centro de Biologia Genômica e Molecular, Pontifícia Universidade Católica do Rio Grande do Sul, Av. Ipiranga 6681, 90619-900 Porto Alegre, RS, Brazil
3
The Wildlife Conservation Society, International Conservation, 185th Street and Southern Blvd., Bronx, NY 10460
4
Museum of Natural History, Molecular Systematics Laboratory, New York 10024
5
Departamento de Genética/Universidade Federal do Rio Grande do Sul. Porto Alegre, RS, Brazil
Running title: mtDNA diversity of the humpback whales from Brazil
Address for correspondence: Márcia H Engel, Projeto Baleia Jubarte/Instituto Baleia Jubarte – Rua 7 de Setembro 178 – 45900-000Caravelas, Bahia, Brazil, FAX, Phone, m.engel@terra.com.br
4
Abstract
5
Introduction
In the Southern Hemisphere, it is generally accepted that humpback whales (Megaptera novaeangliae) have seven distinct breeding areas, distributed along continents or islands or in shallow banks in tropical latitudes.
At the beginning of the austral summer, each of these ‘stocks’ migrate to specific feeding grounds in high-latitude Antarctic waters (Dawbin 1966; Whitehead & Moore, 1982; Baker et al. 1995; Clapham & Mead 1999). The longitudinal boundaries of such areas – as well as the knowledge about the distribution of blue whales (Balaenoptera musculus) - have led the International Whaling Commission to establish political units for commercial whaling in the region (Tonnessen & Johnsen 1982). Since 1957 the limits of six feeding grounds in Antarctic waters, known as Areas I to VI, were accepted by the International Whaling Comission and in 1974/75 season they were included in the “official” schedule of the Commission. The defined Antarctic Areas I and II were located respectively between the 120º to 60º W and 60º to 0º W (Donovan 1991).
In the Southwestern Atlantic Ocean, humpback whales are found in the Abrolhos Bank (16º40´- 19º30´S and 37º25´- 39º45´W) their main mating and calving grounds (IBAMA/FUNATURA 1991; Engel 1996; Martins et al. 2001). Their corresponding feeding ground in the Antarctic region, however, remains unknown, since comparisons based in the photo-ID catalogs from the College of the Atlantic Program and Projeto Baleia Jubarte/Humpback Whale Project – Brazil, did not result in any match between Abrolhos and Antarctic Area I (Muñoz, pers. comm.; Projeto Baleia Jubarte, unpubl. data). The bad conditions for navigation in the Weddell Sea have not allowed researchers to develop comparisons with photoidentified individuals from Antarctic Area II, their most likely feeding ground, as it is generally located due south below the Southwestern Atlantic Ocean. At the same time, photoidentification studies (Stone et al. 1990; Capella & Flórez-González 1993; Muñoz et al. 1998) and mtDNA analyses (Caballero et al 2000; Olavarría et al, 2000) demonstrated an evident link between the subpopulation of humpbacks that breed along the Colombian coast and Area I in the Western part of the Antarctic Peninsula.
6
and sei whales were killed. The worldwide protection of humpback whales from hunting was established in 1966 (Rice 1978) so the species experienced around 46 years of intensive killing. As example of what happened in many of these concentration areas, is actually known that the humpback whale “stock” of the Brazilian coast was extensively hunted until the international moratorium in 1966, despite the existence of many gaps in these records (Paiva & Grangeiro 1965; 1970).
7
of such biopsies (Lambertsen et al. 1987; Pallsboll et al. 1992). In recent years, new techniques based in sex-specific DNA sequences have been used to determine gender in cetaceans (Baker et al. 1991; Pallsboll et al. 1992).
In this report we investigated the genetic diversity and putative migratory connection of the Brazilian humpback whales, through molecular methods based on mitochondrial DNA. It was also determined the sex-biased rate of the Brazilian stock and the gender of each individual as a complement of the Projeto Baleia Jubarte/Humpback Whale Project – Brazil catalogue, which includes 183 whales photoidentified and sexed by molecular techniques until 2001.
Materials and methods
Sampling and mtDNA sequencing
201 skin samples of humpback whales from different social groups were collected during the breeding seasons of 1997 through to 2001, most of it from the Abrolhos Bank and a few as a result of strandings in Bahia and Espírito Santo States, or other locations in the Brazilian coast (Figure 1). For each whale sampled, date, location (by Global Positioning System), group composition, number of animals, and presence of calf were also recorded. For sampling of live animals a Barnett Wildcat XL crossbow was used with stainless steel biopsy darts with a 8mm diameter and a 15 mm length sampling tip. Samples were kept in 70% ethanol or DMSO, according to the protocol established by Baker et al.
(1998).
Additional 79 skin samples were obtained in the Gerlache and Bransfield Straits and in the Weddell Sea near the Antarctic Peninsula using the same methods described above. These samples were obtained during the expedition organized by the Antarctic Brazilian Program (PROANTAR) in the austral summers of the years 1999 to 2000. Following a recent proposal of Caballero et al. (2000) of changing the limits between Antarctic areas I and II from 60ºW to 58ºW, in this study were considered as belonging to Antarctic area II a total of 25 samples collected very near the 58ºW boundary.
The DNA extraction of the tissue samples followed protocols modified from Baker
8
K (100 µg /ml-1) at 650 C for a minimum of three hours, followed by the extraction with phenol/chloroform and precipitation with ethanol.
A region of approximately 450 nucleotides from the most variable portion of the control region in mtDNA was amplified, using primers Dlp-1.5 and Dlp-5 (as described in Baker et al., 1993). Approximately 100 ng of total DNA were submitted to 35 cycles/25 µl of reaction volume with 0.5 units of the Taq DNA polymerase enzyme, 0.2 µM of each primer, 1.5 mM of magnesium chloride, 0.2 mM of DNTPs and 1X buffer (20 mM Tris-HCl ph 8.4; 50 mM KCl). The amplified material was purified with shrimp alkaline phosphatase and exonuclease I (Amersham Biociences) and sequenced with the chain terminators method (Amershan Biosciences ET terminator kit) in a thermocycler, purified afterwards (precipitation with ethanol) and taken to the automatic sequencer MegaBACE 1000.
Molecular determination of sex
The molecular determination of sex of 183 individuals from Abrolhos Bank and the Brazilian coast was obtained following the protocol of Pallsboll et al. (1992) modified by Berube and Palsboll (1996). The oligonucleotide primers ZFY0097 and ZFY1204 were used to amplify by PCR an 1100 base pair sex-specific homologue region of the X and Y chromosomes. One µl of total cellular DNA was amplified in a 30 µl reaction volume by 40 cycles of standard PCR. Sixteen µl of the amplified DNA was digested with TAQ I restriction enzyme in a total solution of 20 µl. The restricted DNA was separated by agarose gel (2%) eletrophoresis and observed by UV light after exposure to ethidium bromide (0,5 µg/ml). The total and the social groups sexual rates were estimated and compared with that obtained in other breeding and calving areas, and the Pearson chi-square test with Yate´s correction was used to calculate the statistical significance of these rates. The calves were not biopsied in this study.
Statistical methods
9
Some analyses were done using different dataset. In order to classify the new haplotypes according to the three previously described clades, referred to as “AE”, “CD” and “IJ” (Baker et al. 1990), one set of phylogenies were undertaken using the sequences from Brazil and the Antarctic described here and 48 other humpback whale sequences obtained from GenBank (Baker et al. 1993; 1998). To confirm the position of the root in the haplotype tree of M. novaeangliae, published sequences of Balaenoptera edeni, B. musculus, B. physalus, B. acutorostrata, Balaena mysticetus, Eubalaena and Caperea marginata from Genbank were used as outgroups. In this case only approximately 250 positions could be used. To maximize the information, in all other phylogenies estimated and analyses performed, only the 253 sequences described here that include the full 431 nucleotides alignment were used (324 sites were present in all sequences).
Haplotype and nucleotide diversity were calculated using the MEGA software version 2.1 (Kumar et al. 2001) with the standard error estimated by 500 boostrap replicates. The phylogenies were estimated using the neighbour–joining method with Kimura-2 parameter (K2p) distance (Saitou e Nei 1987) also using MEGA. Other distances were also used but as all gave essentially the same results, only the K2p results were presented. The ‘bootstrap’ method (Felsenstein 1985) was used to estimate the statistical validity of the clades. The TCS 1.13 software (Clement et al. 2001) was used to produce a haplotype network.
The structure of the genetic diversity in these areas was studied using the AMOVA approach (Excoffier et al. 1992) as implemented in ARLEQUIN 2.0 software (Schneider et al. 2000). For this hierarchical method the Abrolhos bank and Brazilian coast samples, Antarctica area I and Antarctica area II were considered as three populations. To study the relationships among the breeding area and the two feeding grounds, three grouping of populations were considered. The AMOVA was performed using the k2p distance among the haplotypes (Φst) and also not using the distance among haplotypes (Fst) and the significance of the differences was tested using 1000 no-parametric permutations.
10
Results
Variability of mtDNA control region sequences
A consensus segment of 431 bp of the mtDNA control region was assembled from 176 sequences from Brazil, 46 from Antarctic Area I and 31 from Antarctic Area II. A total of 59 polymorphic sites were identified defining 62 haplotypes in the Brazilian sample. For the Antarctic samples, 33 and 27 segregation sites were detected defining 20 haplotypes for Area I and 14 for Area II, respectively. The table 1 presents these data and the nucleotide and haplotype diversities of each one of these three sampled areas, in comparison with that reported for other breeding and feeding grounds within the three ocean basins (North Atlantic, North Pacific and Southern Hemisphere). The Brazilian haplotype diversity (h=0.971) was high and similar to that found in the majority of the breeding grounds such as the African Gabon and Antogil Bay, Madagascar (Rosenbaum et al., in prep). The nucleotide diversity ( in Brazil was low, only comparable to Colombia and the overall North Pacific sample. The Antarctic Areas I and II presented haplotype diversity values (h=0.913 and 0.912, respectively) lower than all other feeding grounds studied, but higher than North Atlantic and North Pacific and some Southern Ocean breeding areas. Regarding the nucleotide diversities, we found in both Antarctic Areas a value ( = 0.017) lower then all other area studied.
Considering together all sequences from the three populations described here it were identified 74 different haplotypes (figure 2), the three areas sharing four of them. The number of sharing haplotypes and of individuals sharing haplotypes between the areas (table 2), clearly indicate that Antarctic Areas I and II have a closer connection that any one of them has with the Brazilian area.
mtDNA Phylogeny and Clade distribution
11
and CD clades (Baker et al. 1990; 1993; 1998). We found a new clade, holding a few Brazilian sequences and EA11 (a sequence from Eastern Australia not included in any of the other three clades in the previous studies). This clade was found in a basal position near the outgroups and the AE clade. We named this new clade as “BR.
The phylogenetic tree built using only the Brazilian and Antarctic haplotypes described here and one representative of each set of identical sequences presented a very similar result (Figure 2). The same four clades were found but the bootstrap values for the AE and BR clades were relatively high.
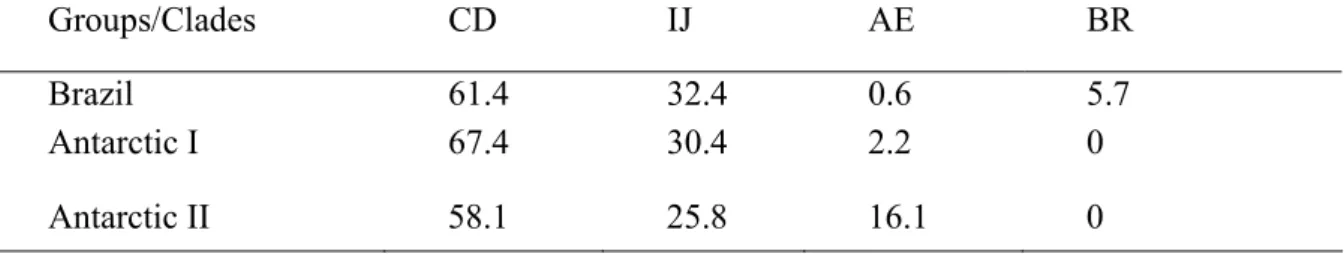
Similarly to what was found in other studies (what other studies), the haplotype clades were dispersed among the populations. However, the frequency distribution for the clades among the three populations (table 3) was significantly different (X2=21.934; p=0.001). There is a predominance of the CD clade in all three areas while the IJ clade presents an intermediate frequency. The AE clade had a much higher frequency in Antarctic II in contrast to its lower occurrence in Antarctic I and in Brazil, while the BR clade contained DNA sequences that were only found in Brazil.
Within-Population Variation
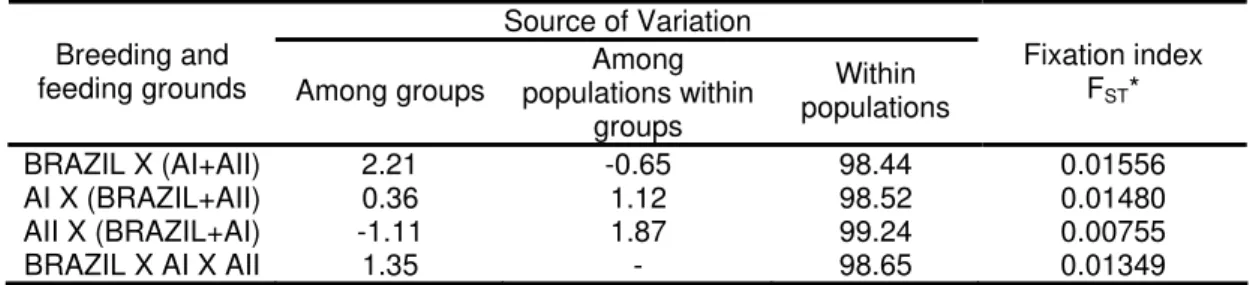
An initial AMOVA analysis without structuring the areas in groups resulted that 98% to 99% of the mtDNA variability was found within the populations (table 4). Considering the three different grouping of these populations, the higher among groups variation, 2.2%, was obtained when we compare Brazil against the two Antarctic feeding areas. However, in all the simulations, the FST fixation indices were statistically significant (table 4). Corroborating these results, the analysis of the Kimura 2-parameter genetic distance between the two Antarctic areas (0.018) was lower than between Brazil and any one of the two Antarctic feeding Areas (0.02) (table 5).
Molecular sexing
12
Discussion
The high mitochondrial DNA diversity (nucleotide and haplotype) observed in the Brazilian sample in this study is in agreement with that described for other areas studied in the Southern Hemisphere and North Atlantic Ocean (Baker et al. 1993b; 1998; Rosenbaum et al. 1998, 2000, 2001) (Table 1). Therefore, despite the severe effects of commercial hunting in this stock (Paiva & Grangeiro 1965;1970), its maternal genetic diversity was not probably strongly reduced. A possible explanation for this maintenance of diversity in humpback whales in the Brazilian area and in general is that the major harvests was relatively recent and short-lived in relation to the other whales.
Furthermore, differently from other mysticeti species, humpback whales have a minimum age at sexual maturity of 4 to 6 years (Klinowska, 1991) and a long generation time between 5 to 10 years (Baker et al. 1993b), what may have allowed reduced populations of humpbacks to overlap during and consequently pass through a bottleneck without much mtDNA variability loss. According to Nei et al. (1975), the decay of mtDNA variability is slowed down if the period of time of the population bottleneck is short and the species has a long generation time. This seems to be the case with most of the humpback populations, including the Brazilian one, which recovered to an estimated number around 2500 individuals in the present (Freitas et al. 2001; Andriolo et al. 2001).
Another explanation for the high diversity maintained in most breeding sites is that a low but consistent gene flow among these areas exists. It is not clear why the nucleotide diversity we found in Antarctic Areas I and II were so low when compared with other estimates (Table 1) but it may be related to the very small region where samples were taken.
The frequency of CD clade haplotypes in the Brazilian area was high (61.4%), similar to that found in Eastern Australia and Tonga, and Western Australia region (Baker
13
labeled BR, comprising five haplotypes from 10 individuals found in the Brazilian coast plus the Eastern Australia haplotype EA11. This suggests that this clade may occur in other southern hemisphere populations, but this conclusion should wait until more sequences from this region render publicly available for comparisons.
The AMOVA analyses indicate a lower differentiation between Antarctic Areas I and II when both compared with the Brazilian population. The results of population pairwise FSTs also corroborate the AMOVA results, obtaining a lower genetic distance between Antarctic Areas I and II than between Brazil and any of these feeding grounds. Moreover, the proportion of shared haplotypes between Brazil and both the Antarctic areas (n=4) and between Brazil and each Antarctic areas separately (table 2) may be considered very low if we take the example of the Colombia breeding area and Antarctic Area I (17 over 37), whose migratory connection is well know. Such results imply that Antarctic Areas I and Area II as sampled here, near the Antarctic Peninsula (Figure 1) do not constitute the feeding ground of the Brazilian humpback whales.
14
Although the observed proportion of males and females in the Brazilian sample did not differ significantly, an overall higher number of males was found (table 5), as usually observed in humpback whale breeding areas due to the different pattern of migration in males versus females (Palumbi & Baker 1994; Craig & Herman 1997). According to the first authors, females apparently visit the winter grounds less frequently than do males, resulting in a surplus of males. This strategy aim to increase the female's probability of reproductive success by maximizing the time spent on the feeding grounds, as the energy costs of migration and lactation for long periods, plus the absence of food sources, is formidable.
The sex composition of the various social groups studied here were in agreement with the expected values. For example, the high predominance of males in surface-active groups and trios corroborates the observations described in Clapham (1996) such as that mature females usually are distributed separately each other aiming to increase the possibility of interaction with many males and that the males are usually forming short-period groups where they are engaged in the competition to copulate with the female. The four single females registered probably were immature or already pregnant animals; otherwise escorts or calves likely would accompany them. An almost equal proportion of male and females composed the dyads, which were often observed in mating and courtship behaviors. Of the nine stranded animals, one was rescued alive but the other eight were dead whales and many were in an advanced state of decomposition, preventing visual sex identification.
Acknowledgements
15
References
Andriolo A, Martins CCA, Engel MH, Pizzorno JL, Más-Rosa S, Freitas A, Morete ME, Petta CB, Kinas PG (2001) Aerial survey of humpback whale (Megaptera novaeangliae) to estimate abundance in the breeding ground, Brazil: preliminary results. Paper SC/54/H5 presented to the IWC Scientific Committee, 2001 (unpublished), 10 pp.
Arnason U, Gullberg A, Gretarsdottir S, Ursing B, Janke A (2000) The mitochondrial genome of the sperm whale and a new molecular reference for estimating eutherian divergence rates. Journal of Molecular Evolution, 50, 569-578.
Allen KR (1980) Conservation and Management of Whales. University of Washington Press, Seattle.
Baker CS, Palumbi SR, Lambertsen RH, Weinrich MT, Calambokidis J, O´Brien SJ (1990) Influence of seasonal migration on geographic distribution of mitochondrial DNA haplotypes in humpback whales. Nature,344, 238-240.
Baker, C.S, R.H. Lambertsen, M.T. Weinrich, J. Calambokidis, G. Early and S.J. O´Brien (1991) Molecular genetic identification of the sex of humpback whales (Megaptera novaeangliae). Rep. Int. Whal. Comm., Special Issue 13, 105-111.
Baker CS, Perry A, Bannister JL, Weinrich MT, Abernethy RB, Calambokidis J, Lien J, Lambertsen RH, Urban-Ramirez J, Vasquez O, Clapham PJ, Alling A, O´Brien SJ, Palumbi SR (1993a) Abundant mitochondrial DNA variation and worlwide population structure in humpback whales. Proc. Natl. Acad. Sci.USA, 90, 8239-8243.
Baker CS, Gilbert DA, Weinrich MT, Lambertsen R, Calambokidis J, Mc Ardle B, Chambers GK, O´Brien SJ (1993b) Population characteristics of DNA fingerprints in humpback whales (Megaptera novaeangliae). The Journal of Heredity,84(4): 281-290. Baker CS, Flórez-González L, Rosenbaum HC, Bannister J (1995) Molecular genetic identification of sex and stock structure among humpback whales of the southern hemisphere. Paper SC/46/SH14 presented to the International Whaling Committee, 1995
(unpublished), 11 pp.
16
Baker CS & Medrano-González L (2002) Worldwide distribution and diversity of humpback whale mitochondrial DNA lineages. In: Molecular and Cell Biology of Marine Mammals (eds. C.J. Pfeiffer & P.E. Nachtigall), pp. 81-106. Krieger Publishing Company, Melbourne FL.
Berube M & Palsboll P (1996) Identification of sex in cetaceans by multiplexing using ZFX and ZFY specific primers. Mol. Ecol., 5, 283-287.
Caballero S, Hamilton H, Flórez-González L, Capella J, Olavarría C, Rosenbaum HC, Baker CS (2000) Stock identity and diversity of humpback whale mitochondrial DNA lineages on the Colombian winter breeding grounds. Paper SC/52/IA14 presented to the IWC Scientific Committee, 2000 (unpublished), 08 pp.
Capella J & Flórez-González L (1993) Tras el rastro de la ballena jorobada. Boletín Antártico Chileno, pp 2-4.
Chittleborough RG (1965) Dynamics of two populations of the humpback whale, Megaptera novaeangliae (Borowski). Aust. J. Mar. Freshwater Res., 16, 33-128.
Clapham PJ & Mayo CA (1987) Reproduction and recruitment of individually identified humpback whales, Megaptera novaeangliae, observed in Massachussets Bay, 1979-1985.Can. J. Zool., 65, 2853-2863.
Clapham PJ (1995) Sex ratio of the Gulf of Maine humpback whale population. Marine Mammal Science, 11 (2), 227-231.
Clapham PJ (1996) The social and reproductive biology of humpback whales:na ecological perspective. Mammal Review,26(1), 27-49.
Clapham PJ & Mead JG (1999) Megaptera novaeangliae. Mammalian Species604, 1-9. Clement M, Posada D, Crandall KA (2000) TCS: a computer program to estimate gene genealogies. Molecular Ecology 9 (10), 1657-1660.
Dawbin W (1966) The seasonal migratory cycle of the humpback whale. In: Whales, Dolphins and Porpoises. (ed. Norris KS), pp 145-170.University of California Press, Berkeley.
Donovan GP (1991) A Review of IWC Stock Boundaries. Report of the International Whaling Comission, Special Issue 13, 39-68.
17
Evans PGH (1987) The Natural History of Whales and Dolphins. Facts on File Publ., New York.
Excoffier L, Smouse PE, Quattro J (1992) Analysis of molecular variance inferred from metric distances among DNA haplotypes: application to human mitochondrial DNA data. Genetics,131, 479-491.
Felsenstein J (1985) Confidence limits on phylogenies: an approach using the bootstrap. Evolution, 39, 783-791.
Filatov DA (2001) Processor of Sequences Manual. University of Birmingham, England. (available at http://www.biosciences.bham.ac.uk/labs/filatov/proseq.html)
Freitas A C, Kinas PG, Martins CCA, Engel MH (2001) Population estimate for humpback whales from Abrolhos bank, Brazil wintering ground in the Southwestern Atlantic ocean. Paper SC/54/H11 presented to the IWC Scientific Committee, 2001 (unpublished). 11pp. Glockner DA (1983) Determining the sex of humpback whales (Megaptera novaeangliae) in their natural envinronment. AAAS Sel. Symp., 76, 447-464.
IBAMA/FUNATURA (1991) Plano de Manejo: Parque Nacional Marinho dos Abrolhos. IBAMA, Brasília.
Klinowska, M. (Comp.) 1991. Dolphins, Porpoises and Whales of the World. Gland: IUCN Red Data Book. Gland, SW.
Kumar S, Tamura K, Jakobsen IB, Masatoshi N (2001) MEGA2: Molecular Evolutionary Genetics Analysis Software. Arizona State University, Tempe, Arizona, USA.
Lambertsen RH (1987) A biopsy system for large whales and its use for cytogenetics. J. Mamm., 68, 443-445.
Lyrholm T, Leimar O, Gyllensten U (1996) Low diversity and biased substitution patterns in the mitochondrial DNA control region of sperm whales: implications for estimates of time since common ancestry. Mol. Biol. Evol. ,13 (10), 1318-1326.
Martins CCA, Morete ME, Engel MH, Freitas A, Secchi ER, Kinas PG (2001) Aspects of habitat use patterns of humpback whales in the Abrolhos bank, Brazil, breeding ground. Memoirs of the Queensland Museum, 47(2), 563-570.
18
Muñoz E, Félix F, Flórez-González L, Hasse B, Katona S, Lodi L, Mc Oscker M, Robertson K, Stevick P, Siciliano S (1998) Migration of individually identified humpback whales Megaptera novaeangliae between the Antarctic peninsula and South America. Paper presented at the World Marine Mammal Science Conference, Monaco, 20-24 January. Nicholas KB & HB Nicholas (1997) GeneDoc: A Tool for Editing and Annotating Multiple Sequence Alignments. (available at www.psc.edu/biomed/genedoc).
Olavarría C, Baker CS, Medrano L, Aguayo A, Caballero S, Flórez-González L, Capella J, Rosenbaum HC, Garrigue C, Greaves J, Bannister JL, Jenner M, Jenner C (2000) Stock identity of Antarctic peninsula humpback whales inferred from mtDNA variation. Paper SC/52/IA15 presented to the IWC Scientific Committee, 2000 (unpublished). 11 pp.
Paiva MP & Grangeiro BF (1965) Biological investigations on the whaling seasons 1960-1963, off northeastern coast of Brazil. Arquivos da Estação de Biologia Marinha da Universidade do Ceará, 5(1), 24-64.
Paiva MP & Grangeiro BF (1970) Investigations on the whaling seasons 1964-1967 off northeastern coast of Brazil. Arquivos de Ciências do Mar, 10(2), 111-126.
Pallsboll PJ, Vader A, Bakke I, El-Gewely MR (1992) Determination of gender in cetaceans by polymerase chain reaction. Canadian Journal of Zoology, 70, 2166-2170. Palsboll PJ, Clapham PJ, Mattila DK, Larsen F, Sears R, Siegismund HR, Sigurjónsson J, Vásquez O, Artander P (1995) Distribution of mtDNA haplotypes in North Atlantic humpback whales: the influence of behaviour on population structure. Marine Ecology Progress Series, 116, 1-10.
Palumbi S, Martin A, Romano S, McMillan WO, Stice L, Grabowski G (1991) The Simple Fool´s Guide to PCR, v. 2.0. Dept. of Zoology, University of Hawaii, Honolulu.
Rice DW (1978) The humpback whale in the North Pacific: distribution, exploitation, and numbers. In: Report on a Workshop on Problems Related to Humpback Whales (Megaptera novaeangliae) in Hawaii, (eds. K.S.Norris & R. Reeves), pp.29-44. U.S. Marine Mammal Commission, Washington, DC.
19
of Areas III, IV, V and VI in the Southern Hemisphere. Paper SC/50/CAWS35 presented to the IWC Scientific Committee, 1998 (unpublished). 9 pp.
Rosembaum HC, Best PB, Findlay KP, Engel MH, Pomilla C, Razafindrakoto Y, Morete ME, Vely M, Freitas AC, Baker CS, Jenner C, Jenner M-N, Bannister J (2000) Mitochondrial DNA variation among humpback whales from the wintering grounds in the South Atlantic and Southwestern Indian Oceans. Paper SC/52/IA11 presented to the IWC Scientific Committee, 2000 (unpublished). 13 pp.
Rosenbaum HC, Best PB, Pomilla C (2001) A preliminary analysis of mtDNA variation among humpback whales of the southeastern Atlantic Ocean from the wintering grounds along the coast of west Africa. Paper SC/53/IA32 presented to the IWC Scientific Committee, 2001 (unpublished). 8 pp.
Rozas J & Rozas R (1999) DnaSP version 3: an integrated program for molecular population genetics and molecular evolution analysis. Bioinformatics, 15, 174-175.
Saitou N & Nei M (1987) The neighbor-joining method: a new method for reconstructing phylogenetic trees. Mol. Biol. Evol., 4, 406-425.
Schneider S, Roessli D, Excoffier L (2000) Arlequin v. 2.000: A Software for Population Genetics Data Analysis. Genetics and Biometry Laboratory, University of Geneva, Switzerland.
Stone GS, Flórez-González L, Katona S (1990) Whale migration record. Nature, 346, 705. Tamura K & Nei M (1993) Estimation of the number of nucleotide substitutions in the control region of mitochondrial DNA in humans and chipanzees. Mol. Biol. Evol., 10, 512-526.
Thompson JD, Higgins DG, Gibson TJ (1994) Clustal W: improving the sensitivity of progressive multiple sequence alignment through sequence weighting, positions-specific gap penalties and weight matriz choice. Nucl. Acids Res., 22, 4673-4680.
Tonnessen JN & Johnsen AO (1982) The History of modern whaling. University of California Press, Berkeley.
Whitehead H & Moore MJ (1982) Distribution and movements of West Indian humpback whales in winter. Canadian Journal of Zoology, 60, 2203-2211.
20
21
WEDDELL SEA
Bransfield Strait
Gerlache Strait Figure 1. a) Abrolhos bank, the Brazilian
breeding ground and, b) the likely feeding areas I and II in the surroundings of the Antarctic Peninsula.
a
22
Figure 2.Unrooted phylogenetic tree of shared haplotypes between the three areas and clades division
CD σ σ σ ν ν λ λ λ λ λ λ λ λ ν σ ν λ λ λ λ λ λ λ σ ν λ λ λ σ λ ν λ λ λ λ λ λ λ λ λ σ λ σ ν σ λ λ σ
ν ν
λ
λ λ
λ λ λ λ λ λ λ λ σ ν λ λ λ λ λ ν λ σ λ ν λ λ λ λ λ λ σ λ ν
σ λ
λ λ λ σ σ λ λ 0.005 AE BR I J 26 41 69 73 λ BRAZIL
23
Table 1. Sample by region and information of variability mtDNA control region of humpback whales from Brazil and Antarctic Areas I and II and its comparisons with other breeding and feeding grounds. Haplotype (h) and nucleotype (¶) diversities, as well as their standard deviations are reported.
REGION N HP ND P h+/-SD π+/-SD REFERENCEa
BRAZIL 49 27 350 38 0.969+/-0.010 0.025+/-0.013 1
BRAZIL 176 61 324 57 0.971+/-0.004 0.02040+/-0.001 this study
ISLA GORGONA, COLOMBIA
30 16 240 26 0.913+/-0.037 0.027+/-0.015 2
MALAGA BAY, COLOMBIA 37 12 240 22 0.880+/-0.036 0.020+/-0.011 2
ANTOGIL BAY, MADAGASCAR
141 51 350 50 0.976+/-0.003 0.025+/-0.013 1
SOUTH MADAGASCAR 35 19 350 40 0.955+/-0.017 0.027+/-0.014 1
MAYOTTE, COMOROS 17 11 350 28 0.949+/-0.033 0.026+/-0.014 1
MOZAMBIQUE/SE AFRICA 8 6 350 21 0.893+/-0.111 0.021+/-0.013 1
WESTERN AUSTRALIA 26 22 240 32 0.988+/-0.014 0.031+/-0.017 2
EASTERN AUSTRALIA 15 8 240 16 0.895+/-0.053 0.022+/-0.013 2
TONGA 20 14 240 25 0.932+/-0.044 0.029+/-0.016 2
NEW CALEDONIA 16 12 240 23 0.967+/-0.031 0.029+/-0.016 2
GABON 70 37 340 47 0.973+/-0.007 0.027+/-0.013 3
ANGOLA 11 9 340 30 0.964+/-0.051 0.028+/-0.016 3
WEST SOUTH AFRICA 23 11 350 25 0.910+/-0.03 0.023+/-0.012 1
ANTARCTIC AREA I 11 7 333 *** 0.9273 0.0230+/-0.0039 4
ANTARCTIC AREA I 46 17 324 24 0.913+/-0.021 0.01779+/-0.001 this study
ANTARCTIC AREA II 31 13 324 21 0.912+/-0.028 0.01740+/-0.001 this study
ANTARCTIC AREA IIIE 15 14 333 *** 0.9905 0.0244+/-0.0018 4
ANTARCTIC AREA IV 73 34 333 *** 0.9593 0.0256+/-0.0008 4
ANTARCTIC AREA V 40 23 333 *** 0.9603 0.0281+/-0.0014 4
ANTARCTIC AREA VIW 16 12 333 *** 0.9583 0.0243+/-0.0020 4
NORTH ATLANTIC 246 *** 283 *** 0.881+/-0.015 0.0236+/-0.00015 5
NORTH PACIFIC 109 *** 283 *** 0.772+/-0.024 0.046+/-0.0081 5
N = Sample size, HP = Number of haplotypes, ND = Number of nucleotides, P = Polymorphic sites *** data not available
24
Table 2. Shared Haplotypes between Brazil (BR), Antarctic Area I (A1) and Antarctic Area II (A2)
Number of
Haplotypes
Number (Frequency %) of Individuals
Populations Populations
Haplotypes BR A1 A2 BR A1 A2
Restricted to 1 pop 54 5 2 136 (77.27) 10 (21.74) 4 (12.90)
Shared only with BR - 2 1 - 2 (4.35) 1 (3.23)
Shared only with A1 2 - 6 9 (5.11) - 16 (51.61)
Shared only with A2 1 6 - 1 (0.57) 22 (47.82) -
Common to all pops 4 4 4 30 (17.05) 12 (26.09) 10 (32.26)
Total 61 17 13 176 (100) 46 (100) 31 (100)
Table 3. Frequency (%) of occurrence of each clade in the three areas analyzed.
Groups/Clades CD IJ AE BR
Brazil 61.4 32.4 0.6 5.7
Antarctic I 67.4 30.4 2.2 0
25
Table 4. AMOVA results for the pairwise comparisons between Brazil and Antarctic Areas I (AI) and Area II (AII) using mtDNA control region data.
Source of Variation Breeding and
feeding grounds Among groups
Among populations within
groups
Within populations
Fixation index FST*
BRAZIL X (AI+AII) 2.21 -0.65 98.44 0.01556
AI X (BRAZIL+AII) 0.36 1.12 98.52 0.01480
AII X (BRAZIL+AI) -1.11 1.87 99.24 0.00755
BRAZIL X AI X AII 1.35 - 98.65 0.01349
*For all values p<0,05
Table 5. Mean genetic distancesa between populations (below diagonal) and pairwise FST indices based
genetic distance between haplotypesa (above diagonal)
ANT 1 ANT 2 BRAZIL
ANT 1 -0.00434 0.01801*
ANT 2 0.01792
(0.00407)
0.01061
BRAZIL 0.01995
(0.00416)
0.01961
(0.00414)
26
Table 6. Molecular genetic identification of sex in different social groups of the Brazilian humpback whale population.
SOCIAL GROUP MALES FEMALES
SINGLE 9 4
MOTHER-CALF PAIR* 0 17
DYAD 22 19
TRIO 13 3
MOTHER-CALF PAIR & ESCORT* 22 24
4 OR MORE ADULTS 18 5
3 OR MORE ADULTS & CALF* 12 5
STRANDING 5 4
NON-IDENTIFIED 0 1
TOTAL 101 82