Identification of Ascomycetes and Basidiomycetes in
Environmental Samples
Hirokazu Toju1,2*., Akifumi S. Tanabe2., Satoshi Yamamoto2
, Hirotoshi Sato3
1The Hakubi Center for Advanced Research, Kyoto University, Sakyo, Kyoto, Japan,2Division of Biological Science, Graduate School of Science, Kyoto University, Sakyo, Kyoto, Japan,3Kansai Research Center, Forestry and Forest Products Research Institute, Nagaikyutaro-68, Momoyama, Fushimi, Kyoto, Japan
Abstract
The kingdom Fungi is estimated to include 1.5 million or more species, playing key roles as decomposers, mutualists, and parasites in every biome on the earth. To comprehensively understand the diversity and ecology of this huge kingdom, DNA barcoding targeting the internal transcribed spacer (ITS) region of the nuclear ribosomal repeat has been regarded as a prerequisite procedure. By extensively surveying ITS sequences in public databases, we designed new ITS primers with improved coverage across diverse taxonomic groups of fungi compared to existing primers. Anin silicoanalysis based on public sequence databases indicated that the newly designed primers matched 99% of ascomycete and basidiomycete ITS taxa (species, subspecies or varieties), causing little taxonomic bias toward either fungal group. Two of the newly designed primers could inhibit the amplification of plant sequences and would enable the selective investigation of fungal communities in mycorrhizal associations, soil, and other types of environmental samples. Optimal PCR conditions for the primers were explored in an in vitro investigation. The new primers developed in this study will provide a basis for ecological studies on the diversity and community structures of fungi in the era of massive DNA sequencing.
Citation:Toju H, Tanabe AS, Yamamoto S, Sato H (2012) High-Coverage ITS Primers for the DNA-Based Identification of Ascomycetes and Basidiomycetes in Environmental Samples. PLoS ONE 7(7): e40863. doi:10.1371/journal.pone.0040863
Editor:Olivier Lespinet, Universite´ Paris-Sud, France
ReceivedMarch 29, 2012;AcceptedJune 14, 2012;PublishedJuly 12, 2012
Copyright:ß2012 Toju et al. This is an open-access article distributed under the terms of the Creative Commons Attribution License, which permits unrestricted use, distribution, and reproduction in any medium, provided the original author and source are credited.
Funding:This work was supported by grant-in-aid by Funding Program for Next Generation World-Leading Researchers (GS014) by the Japan Society for the Promotion of Science (http://www.jsps.go.jp/english/e-jisedai/index.html) and the Hakubi Project by Kyoto University (http://www.hakubi.kyoto-u.ac.jp/eng/ index.html). The funders had no role in study design, data collection and analysis, decision to publish, or preparation of the manuscript.
Competing Interests:The authors have declared that no competing interests exist.
* E-mail: [email protected]
.These authors contributed equally to this work.
Introduction
Fungi constitute a highly species-rich kingdom, embracing c. 100,000 described and potentially 1.5–5.1 million undescribed species [1–4] in environments such as forest soil [5,6], phyllo-sphere [7–9], aquatic ecosystems [10,11], and soils of the polar region [12]. Fungi are important components of ecosystems, acting, among other things, as decomposers [13], mutualists of plants [5,6], and parasites of various organisms [14,15]. They are utilized by humans in terms of applications in agriculture [16,17], pharmacology [18,19], the food industry [20], and environmental technologies [21]. Thus, exploration of fungal diversity is crucial not only for ecosystem and community ecology but also to provide invaluable resources for various fields of applied microbiology.
In cataloging diverse fungal species and thereby constructing reference databases of fungal diversity, ‘‘DNA barcoding’’ based on the nucleotide sequence information of a target gene region can be highly efficient, potentially enabling the rapid and accurate identification of fungal specimens [22–25]. DNA barcoding is a method of identifying unknown samples by means of known classifications [26]. Generally, short nucleotide sequences in one to three loci are used as DNA barcoding markers to catalog and identify a taxonomic group [26–31]. The potential importance of DNA barcoding in mycology and ecology is enormous. Through
In DNA barcoding, the universality of PCR primers limits the efficiency of cataloging and identifying specimens, and the development and selection of high-coverage barcoding primers are regarded as crucial steps [27,39]. In fact, many attempts have been made to design high-coverage primers for amplification of the fungal ITS region [40–43]. Several ‘‘classic’’ primers developed by White et al. [40] and Gardes & Bruns [41] are commonly used for ITS-based barcoding of a variety of fungal groups [44], promoting various taxonomic [33] and ecological [2,45] studies. However, a recent study showed that some of these primers can mismatch with target fungal ITS sequences at non-negligible frequencies, potentially precluding the DNA barcoding of some subgroups of fungi or hampering the accurate description of fungal community structures [39]. For example, the classic primers ITS2 and ITS3, which were designed to amplify the ITS1 and ITS2 regions (Fig. 1), respectively, do not match with the sequences of many basidiomycete fungi (the phylum Basidiomy-cota), causing biased amplification toward ascomycetes (the phylum Ascomycota) and other fungal groups such as glomer-omycetes (the phylum Glomeromycota) [39]. Likewise, the fungi-specific primer ITS1-F, which facilitates the selective amplification of fungal ITS sequences from mycorrhizal and other types of environmental samples [41], shows a high proportion of mismatches to ascomycete sequences, resulting in biased amplifi-cation of basidiomycete and other fungal sequences [39]. Such biases are especially unfavorable in metagenomic studies on fungal diversity and community structures because the coverage of used primers severely influences the reliability of the data produced by next-generation sequencing [39,46]. Consequently, a need exists to develop new primers that can be used for DNA barcoding of fungi with less taxonomic bias.
By thoroughly analyzing the sequence database of the fungal ITS region, we developed herein new primers showing enhanced coverage across diverse fungal taxa. An in silico analysis of the coverage of designed primers based on the ecoPCR program [39]
revealed that the newly designed primers covered 99% of fungal taxa at the species level. Furthermore, they could amplify the sequences of diverse Dikarya fungi (i.e., a subkingdom of fungi consisting of the two phyla Ascomycota and Basidiomycota) without significant taxonomic biases. Although the limited number of ‘‘non-Dikarya’’ database sequences precluded a thorough examination of the coverage across the entire fungal kingdom, a further inspection of the in silico results showed that the newly designed primers could also cover an ecologically important clade of mycorrhizal fungi, Glomeromycota. Taking into account the coverage of each primer, high-coverage primer sets were selected for DNA barcoding of ITS1, ITS2, and the entire ITS region. Furthermore, to determine the optimal PCR conditions for each primer set and evaluate variation in amplicon length, which may cause taxonomic bias in PCR and next-generation sequencing (e.g., 454 pyrosequencing), in vitro PCR with ascomycete and basidiomycete specimens was conducted. This study provides a series of improved barcoding primers to promote ecological and microbiological studies of the diversity and community structures of fungi in the era of massive DNA sequencing.
Methods
Primer Design
To design new ITS primers that amplify broad fungal taxa, we constructed databases of fungal ribosomal RNA gene sequences. Two local sequence databases were prepared by downloading sequences from the Nucleotide database of the National Center for Biotechnology Information (NCBI; http://www.ncbi.nlm.nih. gov/; accessed April 26, 2011). To construct a database of small subunit ribosomal RNA gene sequences, 134,928 sequences were downloaded using the taxonomic ID 4751 (fungi) and the query word ‘small subunit OR 18S’ and setting the range of sequence length from 200 to 5,000 bp. Likewise, to construct a database of 5.8S ribosomal RNA and large subunit RNA gene sequences,
Figure 1. Map of nuclear ribosomal RNA genes and their ITS regions.Positions of forward (right-pointing arrow) and reverse (left-pointing arrow) primers are shown on the map of ITS regions and the surrounding ribosomal RNA genes. The ranges covered by the respective subset databases (see text) are also indicated.
26,616 sequences were downloaded using the taxonomic ID 4751 (fungi) and the query word ‘5.8S’ with the abovementioned range of sequence lengths. Note that we attempted to construct a specific database of large subunit ribosomal RNA gene sequences using the query word ‘large subunit OR 28S,’ but many downloaded sequences did not contain the 59-end of the gene, which was necessary for designing reverse primers for the ITS2 region (Fig. 1). Since each database was composed of numerous sequences, which were difficult to align simultaneously, consensus sequences of closely related taxa were obtained using assembler programs. Assembly was first conducted by PCAP [47], which enabled parallelized rapid assembling, with a sequence identity setting of 92%. The contigs returned by PCAP were further assembled to generate consensus sequences of diverse fungal taxa using CAP3 [48], which facilitated accurate assembling, with a sequence identity setting of 80% and a max overhang percent length of 200 bp. Multiple alignments of the output consensus sequences were conducted using MAFFT v6.813b [49] with default options.
High-coverage PCR primers targeting the ITS1 and ITS2 regions were designed at conserved nucleotide positions of the aligned consensus sequences.
In silicoPCR
The coverage of the designed ITS primers was evaluated and compared with those of existing fungal ITS primers developed in previous studies [40–43] based onin silicoPCR using the ecoPCR v0.7.0 software [39]. Since the software requested sequence database files of focal taxonomic groups in the European Molecular Biology Laboratory (EMBL) database, fungal nucleo-tide sequence databases (STD, GSS, HTG, and WGS of release 107) were downloaded from the EMBL FTP site (ftp://ftp.ebi.ac. uk/pub/databases/embl/release/). Given that only a small proportion of sequences covered the entire part of the small subunit 5.8S and large subunit ribosomal RNA genes and the flanking ITS1 and ITS2 regions (Fig. 1), three subset databases covering either ITS1, ITS2, or the entire ITS region were Table 1.Primers used in this study.
Category Primer name Position Primer sequence, 5’23’ Primer source study
SSU (forward) NSA3 1514–1535 AAACTCTGTCGTGCTGGGGATA Martin & Rygiewicz (2005)
ITS9mun 1618–1635 TGTACACACCGCCCGTCG Egger (1995)
NSI1 1644–1663 GATTGAATGGCTTAGTGAGG Martin & Rygiewicz (2005)
ITS1-F 1723–1744 CTTGGTCATTTAGAGGAAGTAA Gardes & Bruns (1993)
ITS1-F_KYO1 1723–1744 CTHGGTCATTTAGAGGAASTAA This study
ITS1-F_KYO2 1733–1753 TAGAGGAAGTAAAAGTCGTAA This study
ITS5 1737–1758 GGAAGTAAAAGTCGTAACAAGG White et al. (1990)
ITS1 1761–1779 TCCGTAGGTGAACCTGCGG White et al. (1990)
5.8S (reverse) ITS2 2024–2043 GCTGCGTTCTTCATCGATGC White et al. (1990)
58A2R 2026–2042 CTGCGTTCTTCATCGAT Martin & Rygiewicz (2005)
ITS10mun 2026–2043 GCTGCGTTCTTCATCGAT Egger (1995)
ITS2_KYO1 2026–2042 CTRYGTTCTTCATCGDT This study
ITS2_KYO2 2029–2046 TTYRCTRCGTTCTTCATC This study
5.8S (forward) ITS3 2024–2043 GCATCGATGAAGAACGCAGC White et al. (1990)
58A1F 2024–2040 GCATCGATGAAGAACGC Martin & Rygiewicz (2005)
58A2F 2026–2042 ATCGATGAAGAACGCAG Martin & Rygiewicz (2005)
ITS3_KYO1 2026–2043 AHCGATGAAGAACRYAG This study
ITS3_KYO2 2029–2046 GATGAAGAACGYAGYRAA This study
LSU (reverse) ITS4 2390–2409 TCCTCCGCTTATTGATATGC White et al. (1990)
ITS4_KYO1 2390–2409 TCCTCCGCTTWTTGWTWTGC This study
ITS4_KYO2 2401–2418 RBTTTCTTTTCCTCCGCT This study
ITS8mun 2433–2450 CTTCACTCGCCGTTACTA Egger (1995)
ITS4_KYO3 2442–2459 CTBTTVCCKCTTCACTCG This study
ITS4-B 2526–2548 CAGGAGACTTGTACACGGTCCAG Gardes & Bruns (1993)
NLB4 2558–2577 GGATTCTCACCCTCTATGAC Martin & Rygiewicz (2005)
NLB3 2559–2577 GGATTCTCACCCTCTATGA Martin & Rygiewicz (2005)
NLC2 2628–2649 GAGCTGCATTCCCAAACAACTC Martin & Rygiewicz (2005)
NL6Amun 2767–2786 CAAGTGCTTCCCTTTCAACA Egger (1995)
NL6Bmun 2767–2786 CAAGCGTTTCCCTTTCAACA Egger (1995)
Subset construction only NS7 1403–1426 GAGGCAATAACAGGTCTGTGATGC White et al. (1990)
LR3 3029–3045 CCGTGTTTCAAGACGGG Vilgalys & Gonzalez (1990)
Both primers whose coverage of fungal taxa was evaluated and those used only for subset construction are shown, together with their position in a reference ribosomal RNA sequence ofSerpula himantioides(AM946630).
constructed, as detailed in Bellemainet al.[39]. To create the first subset (subset 1), the ITS1 region was amplified in silico by extracting sequences matching both NS7 and ITS2 primers (Table 1, Fig. 1) from the initial fungal database. In this process, three mismatches to each primer were tolerated but sequences containing consecutive five or more ‘N’ were excluded, leaving a database containing 1,374 sequences. Likewise, subset 2 for the entire ITS region (ITS5-ITS4; 8,421 sequences) and subset 3 for the ITS2 region (ITS3-LR3; 3,217 sequences) were created.
Based on the three subset databases, the coverage of each ITS primer (Table 1) was evaluatedin silico. In thein silicoamplification, each target primer was paired with the forward or reverse primer that had been used in making the focal subset database, and from zero to three mismatches between each target primer and the template sequence (except mismatches at the two bases of the 39-end of the primer) were allowed to simulate different PCR stringency conditions. Three mismatches between each nontarget primer and the template sequence were allowed in all cases to remove the effects of nontarget primers. Since each subset database included multiple sequences of the same fungal species, the coverage of PCR primers was calculated in terms of the proportion of ‘‘taxa’’ amplifiedin silico. In our subset databases, each sequence had its own taxonomic IDs in the NCBI taxonomy database, and the lowest taxonomic units (LTUs) of the subset/database sequences corresponded to species, subspecies, or varieties in the NCBI taxonomy. In total, 723 LTUs in subset 1, 3,474 in subset 2, and 1,869 in subset 3 were subjected toin silicoPCR. Using the taxonomic information, the results ofin silico
PCR were evaluated independently for ascomycetes, basidiomyce-tes, and the remaining ‘‘non-Dikarya’’ fungi. Compared to ascomycete and basidiomycete fungi, ‘‘non-Dikarya’’ fungi repre-sented only 7.6% (subset 1), 8.3% (subset 2) and 2.9% (subset 3) of the database sequences.
When selecting fungal PCR primers for DNA barcoding of environmental samples, both the coverage of primers across fungal taxa (species, subspecies, or varieties; see the above discussion of LTUs) but also the degree of ‘‘mismatches’’ to plant ITS sequences are important criteria for preventing the amplification of nontarget organismal sequences. Accordingly, we conductedin silicoPCR of
plant ITS sequences using fungal ITS primers (Table 1). From the
EMBL FTP site (ftp://ftp.ebi.ac.uk/pub/databases/embl/
release/), we downloaded plant nucleotide sequence databases (STD, GSS, HTG, and WGS of release 107) and used them to
construct subsets 1–3, as detailed above. In silico PCR was
conducted using the same settings as the fungal analysis; the results was are shown separately for Embryophyta (i.e., land plants) and the remaining ‘‘non-Embryophyta’’ plants.
On account of the coverage across fungal LTUs and the degree of mismatches to plant ITS sequences, candidate pairs of ITS primers for fungal DNA barcoding were selected for ITS1, ITS2, or the entire ITS region. The PCR fragment lengths amplified by these primer pairs were simulated using ecoPCR.
In vitro Selection of Annealing Temperatures
Optimal annealing temperatures for the selected fungal ITS primer pairs were explored in vitro. Three ascomycete and four basidiomycete fungal species collected on Yakushima Island,
Kagoshima Prefecture, Japan, were subjected to the in vitro
examination (A1–3 and B1–4: Table 2). DNA was extracted from fruiting body tissues of the fungal specimens using the CTAB method, as described elsewhere [32]. PCR was conducted using the buffer system of Ampdirect Plus (Shimadzu) with BIOTAQ HS DNA Polymerase (Bioline) under a temperature profile of 95uC for 10 min, followed by 35 cycles at 94uC for 20 s, 47uC, 50uC, 53uC or 56uC for 30 s, and 72uC for 20 s (40 s for the entire ITS region), followed by 72uC for 7 min. The concentration of
MgCl2, dNTPs, PCR primers and the template DNA in the
reaction buffer were 1.5 mM, 200 mM, 0.5mM and 1 ng/ml,
respectively. Amplification of the DNA fragments was confirmed using the Flash Gel System for DNA (Lonza).
To evaluate the coverage of the selected fungal ITS primer pairs
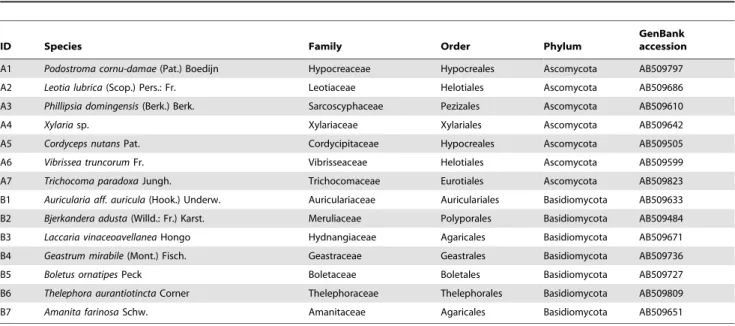
in vitro, an additional PCR assay was conducted under the optimal annealing temperature tested above using seven ascomycete and seven basidiomycete specimens (Table 2). All necessary permits of the sample collection were issued by Kyushu Regional Forest Office, Ministry of Agriculture, Forestry and Fisheries, Japan. Table 2.Seven ascomycete and seven basidiomycete fungi are shown with the accession numbers of their ITS sequences.
ID Species Family Order Phylum
GenBank accession
A1 Podostroma cornu-damae(Pat.) Boedijn Hypocreaceae Hypocreales Ascomycota AB509797
A2 Leotia lubrica(Scop.) Pers.: Fr. Leotiaceae Helotiales Ascomycota AB509686
A3 Phillipsia domingensis(Berk.) Berk. Sarcoscyphaceae Pezizales Ascomycota AB509610
A4 Xylariasp. Xylariaceae Xylariales Ascomycota AB509642
A5 Cordyceps nutansPat. Cordycipitaceae Hypocreales Ascomycota AB509505
A6 Vibrissea truncorumFr. Vibrisseaceae Helotiales Ascomycota AB509599
A7 Trichocoma paradoxaJungh. Trichocomaceae Eurotiales Ascomycota AB509823
B1 Auricularia aff. auricula(Hook.) Underw. Auriculariaceae Auriculariales Basidiomycota AB509633
B2 Bjerkandera adusta(Willd.: Fr.) Karst. Meruliaceae Polyporales Basidiomycota AB509484
B3 Laccaria vinaceoavellaneaHongo Hydnangiaceae Agaricales Basidiomycota AB509671
B4 Geastrum mirabile(Mont.) Fisch. Geastraceae Geastrales Basidiomycota AB509736
B5 Boletus ornatipesPeck Boletaceae Boletales Basidiomycota AB509727
B6 Thelephora aurantiotinctaCorner Thelephoraceae Thelephorales Basidiomycota AB509809
B7 Amanita farinosaSchw. Amanitaceae Agaricales Basidiomycota AB509651
DNA was extracted from fruiting body specimens collected on Yakushima Island, Kagoshima Prefecture, Japan. The fruiting body specimens were deposited in Kyoto University Herbarium (KYO). See Kirket al.[3] and NCBI Taxonomy (http://www.ncbi.nlm.nih.gov/guide/taxonomy/) for the taxonomy of the specimens.
Results
In silico PCR and the Coverage of Fungal ITS Primers Within the first group of ITS primers for the small subunit ribosomal RNA gene (Table 1, Fig. 1), ITS9mun, ITS1-F_KYO2, and ITS5 realized more than 98% coverage across 723 fungal LTUs when one mismatch between a target primer and the template sequence was allowed. Commonly used primers, such as ITS1-F and ITS1, showed less than 90% coverage (Table 3, Fig. 2). Among the reverse primers for the 5.8S ribosomal RNA gene (Table 1, Fig. 1), ITS2_KYO1 and ITS2_KYO2 showed more than 98% coverage under one-mismatch conditions, while the coverage of commonly used ITS2 primers was relatively low
(93.7%; Table 3, Fig. 2). Likewise, among the forward primers for the 5.8S ribosomal RNA gene (Table 1, Fig. 1), 58A2F, ITS3_KYO1, and ITS3_KYO2 showed more than 98% coverage under one-mismatch conditions, while the coverage of commonly used ITS3 primers was relatively low (95.1%; Table 3, Fig. 2). Among the reverse primers for the large subunit ribosomal RNA gene (Table 1, Fig. 1), the widely used ITS4 showed taxon coverage as high as the newly designed ITS4_KYO1, ITS4_-KYO2, and ITS4_KYO3 under one-mismatch conditions, while other primers showed much lower coverage (Table 3, Fig. 2). Among primers for the large subunit ribosomal RNA gene, ITS4_KYO3 showed low coverage across ‘‘non-Dikarya’’ fungi (77.8%), while others covered more than 90% of ‘‘non-Dikarya’’
Figure 2. Coverage of fungal ITS primers.The percentage of fungal LTUs amplified by ecoPCR is shown for each primer. In each analysis,in silico
amplification was conducted using both a target primer and the primer used in construction of the focal subset database; hence, the percentage represents the coverage of the target primer but not that of the primer pairs. From zero to three nucleotide mismatches between the target primer and database sequences were allowed in each analysis (except mismatches in the two bases at the 39-end of the primer). (a) Forward primers for the small subunit ribosomal RNA gene evaluated with subset 1 (723 LTUs). (b) Reverse primers for the 5.8S ribosomal RNA gene evaluated with subset 2 (3,474 LTUs). (c) Forward primers for the 5.8S ribosomal RNA gene evaluated with subset 2 (3,474 LTUs). (d) Reverse primers for the large subunit ribosomal RNA gene evaluated with subset 3 (1,869 LTUs).
taxa.In silicoPCR also indicated that primers with more than 97% coverage across fungal LTUs (i.e., ITS9mun, ITS1-F_KYO2, ITS5, ITS2_KYO1, ITS2_KYO2, 58A2F, ITS3_KYO1, ITS3_-KYO2, ITS4, ITS4_KYO1, and ITS4_KYO2) are unlikely to exhibit a significant coverage bias toward ascomycetes or basidiomycetes (Table 3). Although a relatively small number of ‘‘non-Dikarya’’ sequences was available, a further inspection of sequences in the present data sets revealed that ITS1-F_KYO1, ITS1-F_KYO2, ITS2_KYO2, ITS3_KYO2, and ITS4 matched 99.2% (123/124), 96.0% (119/124), 98.8% (568/575), 99.0% (569/575), and 99.2% (387/390), respectively, of glomeromyce-tous sequences (one-mismatch conditions).
Mismatches to Plant ITS Sequences
Among the above-mentioned high-coverage fungal primers, ITS1-F_KYO2 and ITS5 showed less than 10% coverage of plant LTUs under one-mismatch conditions, while other high-coverage primers matched the sequences of more than 96% of plant LTUs
(Table 4). Thus, although ITS9mun showed the highest coverage across fungal LTUs (Table 3, Fig. 2), potential simultaneous amplification of plant sequences by this primer would be unfavorable in a variety of contexts, such as DNA barcoding of mycorrhizal fungi. Meanwhile, ITS1-F_KYO1, whose LTU coverage was relatively high (96.8%), showed a high specificity for fungi (Table 4). At the large subunit ribosomal RNA gene, ITS4_KYO3 matched the sequences of only 3.1% of land plant LTUs, while other primers were expected to amplify most land plant LTU sequences (Table 4). In terms of the 5.8S RNA gene, no primer with more than 95% fungal LTU coverage under one-mismatch conditions was expected to selectively amplify fungal sequences (Table 4). Accordingly, because of coverage across fungal LTUs and mismatches to plant ITS sequences,
ITS1-F_KYO2–ITS2_KYO2, ITS3_KYO2–ITS4, and
ITS1-F_KYO2–ITS4 primer pairs were tentatively selected as prefer-able for amplification of ITS1, ITS2, and the entire ITS regions, respectively, in the subsequent in vitro analyses (see below for Table 3.Percentage of fungal taxa amplifiedin silico.
Category Subset Target primer name Ascomycota Basidiomycota ‘non-Dikarya’ Total
SSU (forward) * Subset 1 NSA3 93.6 85.6 5.5 85.6
(550 Ascomycota, ITS9mun 99.6 98.3 94.5 99.0
118 Basidiomycota NSI1 88.0 43.2 50.9 77.9
and 55 ITS1-F 92.2 80.5 85.5 89.8
‘non-Dikarya’ LTUs) ITS1-F_KYO1 98.4 94.9 85.5 96.8
ITS1-F_KYO2 99.1 99.2 94.5 98.8
ITS5 98.9 98.3 94.5 98.5
ITS1 73.8 85.6 90.9 77.0
5.8S (reverse){ Subset 2 ITS2 97.1 88.1 96.5 93.7
(1,897 Ascomycota, 58A2R 97.0 97.2 91.3 96.6
1,289 Basidiomycota ITS10mun 97.0 91.6 91.3 94.6
and 288 ITS2_KYO1 99.5 97.4 99.0 98.7
‘non-Dikarya’ LTUs) ITS2_KYO2 99.5 98.6 99.0 99.1
5.8S (forward){
Subset 2 ITS3 98.3 90.2 96.2 95.1
(1,897 Ascomycota, 58A1F 98.5 90.1 85.8 94.3
1,289 Basidiomycota 58A2F 99.3 98.4 97.6 98.8
and 288 ITS3_KYO1 99.3 98.7 99.0 99.1
‘non-Dikarya’ LTUs) ITS3_KYO2 99.5 98.7 99.0 99.2
LSU (reverse)1
Subset 3 ITS4 97.6 96.9 92.6 97.2
(1,102 Ascomycota, ITS4_KYO1 97.6 96.9 92.6 97.2
713 Basidiomycota ITS4_KYO2 97.9 96.6 90.7 97.2
and 54 ITS8mun 41.7 93.8 72.2 62.4
‘non-Dikarya’ LTUs) ITS4_KYO3 96.6 96.9 77.8 96.1
ITS4-B 0.0 47.5 0.0 18.1
NLB4 62.1 52.6 0.0 56.7
NLB3 64.6 90.5 75.9 74.8
NLC2 74.1 96.9 53.7 82.2
NL6Amun 52.4 0.7 0.0 31.1
NL6Bmun 51.0 84.7 68.5 64.4
One nucleotide mismatch between each target primer and the database sequence was allowed in ecoPCR, except for the two bases at the 39-end of the primer. *ITS2, used to construct subset 1, was used as a reverse primer in ecoPCR.
{
ITS5, used to construct subset 2, was used as a forward primer in ecoPCR. {
ITS4, used to construct subset 2, was used as a reverse primer in ecoPCR.
1
further discussion). The average lengths of fragments amplified were 252.1 bp (SD = 53.2; N= 8,555 sequences) for the
ITS1-F_KYO2–ITS2_KYO2 pair, 327.2 bp (SD = 40.1;N= 19,646) for
the ITS3_KYO2–ITS4 pair, and 586.5 bp (SD = 73.9;N= 3,774) for the ITS1-F_KYO2–ITS4 pair (Fig. 3). Although the basidio-mycete amplicons were the longest on average, considerable variation in amplicon lengths was observed within the ascomycete, basidiomycete, or ‘‘non-Dikarya’’ group (Fig. 3).
In vitroSelection of Annealing Temperatures
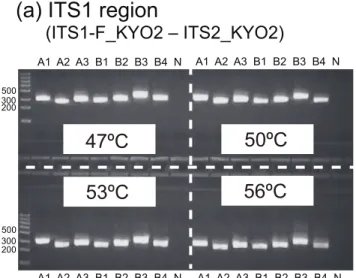
In vitro PCR analysis revealed that the optimal annealing temperature was 47uC for all the primer pairs examined (Fig. 4). The seven ascomycete and seven basidiomycete fungi examined were successfully PCR-amplified using the primer pairs (Fig. 5). Table 4.Percentage of plant taxa amplifiedin silico.
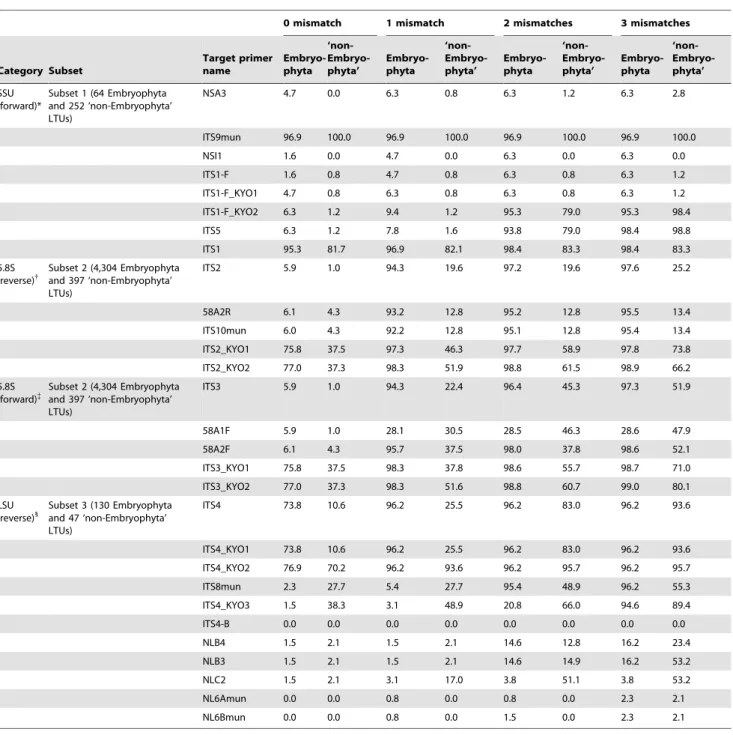
0 mismatch 1 mismatch 2 mismatches 3 mismatches
Category Subset
Target primer name
Embryo-phyta
‘non- Embryo-phyta’
Embryo-phyta
‘non- Embryo-phyta’
Embryo-phyta
‘non- Embryo-phyta’
Embryo-phyta
‘non- Embryo-phyta’
SSU (forward)*
Subset 1 (64 Embryophyta and 252 ‘non-Embryophyta’ LTUs)
NSA3 4.7 0.0 6.3 0.8 6.3 1.2 6.3 2.8
ITS9mun 96.9 100.0 96.9 100.0 96.9 100.0 96.9 100.0
NSI1 1.6 0.0 4.7 0.0 6.3 0.0 6.3 0.0
ITS1-F 1.6 0.8 4.7 0.8 6.3 0.8 6.3 1.2
ITS1-F_KYO1 4.7 0.8 6.3 0.8 6.3 0.8 6.3 1.2
ITS1-F_KYO2 6.3 1.2 9.4 1.2 95.3 79.0 95.3 98.4
ITS5 6.3 1.2 7.8 1.6 93.8 79.0 98.4 98.8
ITS1 95.3 81.7 96.9 82.1 98.4 83.3 98.4 83.3
5.8S (reverse){
Subset 2 (4,304 Embryophyta and 397 ‘non-Embryophyta’ LTUs)
ITS2 5.9 1.0 94.3 19.6 97.2 19.6 97.6 25.2
58A2R 6.1 4.3 93.2 12.8 95.2 12.8 95.5 13.4
ITS10mun 6.0 4.3 92.2 12.8 95.1 12.8 95.4 13.4
ITS2_KYO1 75.8 37.5 97.3 46.3 97.7 58.9 97.8 73.8
ITS2_KYO2 77.0 37.3 98.3 51.9 98.8 61.5 98.9 66.2
5.8S (forward){
Subset 2 (4,304 Embryophyta and 397 ‘non-Embryophyta’ LTUs)
ITS3 5.9 1.0 94.3 22.4 96.4 45.3 97.3 51.9
58A1F 5.9 1.0 28.1 30.5 28.5 46.3 28.6 47.9
58A2F 6.1 4.3 95.7 37.5 98.0 37.8 98.6 52.1
ITS3_KYO1 75.8 37.5 98.3 37.8 98.6 55.7 98.7 71.0
ITS3_KYO2 77.0 37.3 98.3 51.6 98.8 60.7 99.0 80.1
LSU (reverse)1
Subset 3 (130 Embryophyta and 47 ‘non-Embryophyta’ LTUs)
ITS4 73.8 10.6 96.2 25.5 96.2 83.0 96.2 93.6
ITS4_KYO1 73.8 10.6 96.2 25.5 96.2 83.0 96.2 93.6
ITS4_KYO2 76.9 70.2 96.2 93.6 96.2 95.7 96.2 95.7
ITS8mun 2.3 27.7 5.4 27.7 95.4 48.9 96.2 55.3
ITS4_KYO3 1.5 38.3 3.1 48.9 20.8 66.0 94.6 89.4
ITS4-B 0.0 0.0 0.0 0.0 0.0 0.0 0.0 0.0
NLB4 1.5 2.1 1.5 2.1 14.6 12.8 16.2 23.4
NLB3 1.5 2.1 1.5 2.1 14.6 14.9 16.2 53.2
NLC2 1.5 2.1 3.1 17.0 3.8 51.1 3.8 53.2
NL6Amun 0.0 0.0 0.8 0.0 0.8 0.0 2.3 2.1
NL6Bmun 0.0 0.0 0.8 0.0 1.5 0.0 2.3 2.1
From zero to three nucleotide mismatches between each target primer and database sequences were allowed in ecoPCR, except for the two bases at the 39-end of the primer.
*ITS2, which was used for the construction of subset 1, was used as a reverse primer in ecoPCR. {
ITS5, which was used for the construction of subset 2, was used as a forward primer in ecoPCR. {ITS4, which was used for the construction of subset 2, was used as a reverse primer in ecoPCR. 1
Discussion
Using nucleotide sequence databases, we designed improved fungal ITS primers for the DNA barcoding of fungi. Ourin silico
PCR analysis indicated that the coverage of the newly designed primers was around 99% (e.g., 98.8% for ITS1-F_KYO2, 99.1% for ITS2_KYO2, and 99.2% for ITS3_KYO2), and the taxonomic bias of amplification (ascomycetes vs. basidiomycetes) was expected to be very low (Table 3, Fig. 2). Concomitantly,in vitro analyses demonstrated that the improved primers are applicable to the cataloging and identification of ascomycete and basidiomycete fungi using standard PCR conditions (Figs. 4 and 5).
Requirements for Fungal DNA Barcoding Primers In fungal DNA barcoding founded on PCR-based next-generation sequencing of environmental samples such as soils, roots, and leaves, three important criteria exist regarding primer selection. First, as a general requirement for primers used in the exploration of biodiversity, fungal DNA barcoding primers should amplify sequences of broad fungal taxa to accurately describe the diversity and community structures of fungal species in environ-mental samples. As reported recently, several classic primers widely used in DNA barcoding of fungi (e.g., ITS1, ITS1-F, ITS2, and ITS3) do not cover a non-negligible proportion of fungal taxa (Table 3, Fig. 2), potentially causing taxonomic bias in the data [39]. Meanwhile, the newly designed primers ITS1-F_KYO2, ITS2_KYO2, and ITS3_KYO2 are expected to match the sequences ofc. 99% of fungal LTUs, thereby enabling thorough and unbiased DNA barcoding of ascomycete and basidiomycete fungi. Results also showed that three classic primers, ITS9mun, ITS5, and ITS4, exhibited broad coverage of fungal LTUs (Table 3, Fig. 2). In particular, the coverage of ITS4 was as broad as that of any other primer, including our newly designed primers (Table 3, Fig. 2), suggesting that the classic primer is appropriate for fungal DNA barcoding as well as the newly-designed primers targeting the 59-end of large subunit ribosomal RNA gene. Given
the relatively small number of ‘‘non-Dikarya’’ sequences in the public databases, the coverage of the newly designed primers of fungal groups other than ascomycetes and basidiomycetes remains to be evaluated. Nonetheless, inspection of sequences in the present data sets revealed that concerning the ‘‘non-Dikarya’’ mycorrhizal fungal phylum Glomeromycota, ITS1-F_KYO1, ITS1-F_KYO2, ITS2_KYO2, ITS3_KYO2, and ITS4 matched with 96.0–99.2% of the sequences examinedin silico. Thus, these primers are useful for not only DNA barcoding of ascomycetes and basidiomycetes, but also cataloging of glomeromycetes (and other ‘‘non-Dikarya’’ fungi) in the environment. In fact, pyrosequencing with the newly-designed primers successfully yielded glomeromy-cete ITS sequences in metagenomic analyses of root-tip and soil samples collected in Japanese temperate forests (Toju et al., unpubl.).
The second important criterion in selection of fungal barcoding primers is selective amplification of fungal sequences, i.e., the elimination of plant and other organismal sequences in PCR of mycorrhizal, leaf, or soil samples. Some fungi-specific primers such as ITS1-F and ITS4-B are widely used in DNA barcoding of various environmental samples (reviewed in [23]), although their low coverage of fungal taxa is expected to preclude comprehensive analyses of fungal diversity and community structures [39] (Table 3, Fig. 2). Basically, a trade-off exists between specificity for fungi (e.g., exclusion of plant taxa) and unbiased amplification within the fungal kingdom. Due to this trade-off, barcoding primer sets should be selected based on the purpose of the ecological/ microbiological study. As substitutes for the classic fungi-specific primer ITS1-F, ITS1-F_KYO1 and ITS1-F_KYO2 were de-signed for selective amplification of fungal ITS sequences.In silico
PCR showed that ITS1-F_KYO1 showed a high specificity for fungi that was comparable to that of the widely used primer ITS1-F; in contrast, ITS1-F_KYO2 might amplify sequences of diverse plant taxa under relaxed PCR conditions (e.g., low annealing temperatures). Thus, ITS1-F_KYO1 can be used as a highly specific primer for fungi at the slight expense of universality, while ITS1-F_KYO2 is a high-coverage primer, whose risk of
ing plant sequences should be mitigated by adopting relatively stringent PCR conditions. Potential matches between these fungus-specific primers and other soil eukaryotic sequences (e.g., nematodes, springtails, and protozoa) warrants further extensive
in silicoandin vitroanalyses.
The third criterion for the selection of barcoding primers is amplicon length. Next-generation sequencing is an invaluable technique for high-throughput DNA barcoding of fungi, being applied particularly to metagenomic analyses of mycorrhizal, phyllosphere, and soil fungi [9,37,50]. However, output read length is shorter in most next-generation sequencers than in Sanger sequencers (e.g., Applied Biosystems 3130 Genetic Analyzer), which has precluded DNA barcoding of fungi based on the entire ITS region. For example, since the average read length obtained from 454 pyrosequencing has until recently been 250 bp, pioneering studies on fungal metagenomics usually target the ITS1 region for DNA barcoding [9,46,51,52]. The release of the GS FLX Titanium series (454 Life Sciences), which extended the length of output sequences to 400 bp, has allowed use of the potentially more informative ITS2 region for DNA barcoding [50,53]. Given that the fungal ITS2 region can be highly variable at the species level [54], primers for amplification of this region should enable identification of fungal species and subsequent
Figure 4. Exploration of annealing temperatures.Three ascomy-cete and four basidiomyascomy-cete species were subjected to amplification of the (a) ITS1 region (ITS1-F_KYO–ITS2_KYO2), (b) ITS2 region (ITS3_-KYO2–ITS4), and the (c) entire ITS region (ITS1-F_KYO2–ITS4) at four annealing temperatures (electrophoresed on 2.2% agarose gels). See
Table 2 for the abbreviations of fungal specimens. N, negative control. doi:10.1371/journal.pone.0040863.g004
Figure 5. Taxon coverage of respective primer pairs. Seven ascomycete and seven basidioimycete species were subjected to amplification of the (a) ITS1 region (ITS1-F_KYO–ITS2_KYO2), (b) ITS2 region (ITS3_KYO2–ITS4), and the (c) entire ITS region (ITS1-F_KYO2– ITS4) at 47uC (electrophoresed on 2.2% agarose gels). See Table 2 for the abbreviations of fungal specimens. N, negative control.
analyses of fungal communities [50,53]. Therefore, DNA barcod-ing of the ITS2 region usbarcod-ing ITS3_KYO2 and ITS4 with sequencers whose read length is less than 700 bp would be sufficiently informative in the context of ecological and microbi-ological studies (Fig. 3). Meanwhile, DNA barcoding targeting the entire ITS region using ITS1-F_KYO2 and ITS4 will increase the reliability of species identification if the upgraded FLX Titanium, whose read length is up to 1,000 bp, is used.
Future Directions
We herein developed high-coverage fungal ITS primers, which facilitate investigation of the remarkable diversity of fungi. Some of the newly designed primers enable selective amplification of fungal ITS sequences and are useful for investigating fungal diversity and community structures within mycorrhizal associations, leaf, soil, and other environmental samples that potentially contain plant tissues and detritus. There can be little doubt that DNA barcoding will dramatically enhance our knowledge of fungal diversity and communities during the next decade. To further fuel use of fungal DNA barcoding in ecological and microbiological studies, the potential bias caused by primers should be quantitatively evaluated based on next-generation sequencing [46].
Although the number of ITS sequences in public sequence databases is growing rapidly [22,23], many studies use small or large subunit ribosomal RNA sequences as a DNA barcoding
marker [34–38]. ITS sequences are hypervariable in most fungal clades and are used particularly in the context of identification at species or lower levels [25], while the considerable variation in the length of this region often impedes multiple sequence alignments and subsequent phylogenetic analyses. In contrast, small or large subunit sequences are more conserved across the fungal kingdom than ITS sequences, enabling, e.g., phylogenetic investigation of novel fungal clades. Thus, the simultaneous use of ITS and small/ large subunit regions is desirable in future studies based on DNA barcoding after the read length of high-throughput sequencers is extended. To simultaneously conduct identification at species or lower levels and phylogenetic analyses, the ITS primers we report here should be paired with primers for amplification of small or large subunit ribosomal RNA sequences.
Acknowledgments
We thank two anonymous reviewers for their productive comments on the manuscript.
Author Contributions
Conceived and designed the experiments: HT AST. Performed the experiments: HT AST SY HS. Analyzed the data: HT AST. Contributed reagents/materials/analysis tools: HT AST SY HS. Wrote the paper: HT.
References
1. Hawksworth DL (2001) The magnitude of fungal diversity: the 1.5 million species estimate revisited. Mycol Res 105: 1422–1432.
2. O’Brien HE, Parrent JL, Jackson JA, Moncalvo JM, Vilgalys R (2005) Fungal community analysis by large-scale sequencing of environmental samples. Appl Env Microbiol 71: 5544–5550.
3. Kirk PM, Cannon PF, Minter DW, Stalpers JA (2008) Dictionary of the fungi, 10th
ed. Oxon: CAB International. 771 p.
4. Schmit JP, Mueller GM (2007) An estimate of the lower limit of global fungal diversity. Biodiv Conserv 16: 99–111.
5. Allen MF (1991) The ecology of mycorrhizae. New York: Cambridge University Press. 200 p.
6. Smith SE, Read DJ (2008) Mycorrhizal symbiosis, 3rd
ed. New York: Academic Press. 800 p.
7. Clay K. 1988. Fungal endophytes of grasses: a defensive mutualism between plants and fungi. Ecology 69: 10–16.
8. Santamarı´a J, Bayman P (2005) Fungal epiphytes and endophytes of coffee leaves (Coffea arabica). Microb Ecol 50: 1–8.
9. Jumpponen A, Jones KL (2009) Massively parallel 454 sequencing indicates hyperdiverse fungal communities in temperateQuercus macrocarpaphyllosphere. New Phytol 184: 438–448.
10. Kagami M, de Bruin A, Ibelings BW, Van Donk E (2007) Parasitic chytrids: their effects on phytoplankton communities and food-web dynamics. Hydro-biologia 578: 113–129.
11. Kagami M, von Elert E, Ibelings BW, de Bruin A, Van Donk E (2007) The parasitic chytrid, Zygorhizidium, facilitates the growth of the cladoceran zooplankter,Daphnia, in cultures of the inedible alga,Asterionella. Proc R Soc Lond Ser B 274: 1561–1566.
12. Robinson CH (2001) Cold adaptation in Arctic and Antarctic fungi. New Phytol 151: 341–353.
13. Berg B, McClaugherty C (2003) Plant litter: decomposition, humus formation, carbon sequestration. Berlin: Springer. 300 p.
14. Vega FE, Blackwell M (2005) Insect-fungal associations: ecology and evolution. New York: Oxford University Press. 333 p.
15. Mangan SA, Schnitzer SA, Herre EA, Mack KML, Valencia MC, et al. (2010) Negative plant-soil feedback predicts tree-species relative abundance in a tropical forest. Nature 466: 752–755.
16. Cardoso IM, Kuyper TW (2006) Mycorrhizas and tropical soil fertility. Agr Ecosyst Env 116: 72–84.
17. Sawers RJH, Gutjahr C, Paszkowski U (2008) Cereal mycorrhiza: an ancient symbiosis in modern agriculture. Trends Plant Sci 13: 93–97.
18. Kayser O, Kiderlen AF, Croft SL (2003) Natural products as antiparasitic drugs. Parasitol Res 90: 55–62.
19. Zjawiony JK (2004) Biologically active compounds from Aphyllophorales (Polypore) fungi. J Natur Prod 67: 300–310.
20. Mortimer RK (2000) Evolution and variation of the yeast (Saccharomyces) genome. Genome Res 10: 403–409.
21. Wang J, Chen C (2006) Biosorption of heavy metals bySaccharomyces cerevisiae: a review. Biotechnol Adv 24: 427–451.
22. Seifert KA (2009) Progress towards DNA barcoding of fungi. Mol Ecol Res 9: 83–89.
23. Hibbett DS, Ohman A, Glotzer D, Nuhn M, Kirk P, et al. (2011) Progress in molecular and morphological taxon discovery in Fungi and options for formal classification of environmental sequences. Fungal Biol Rev 25: 38–47. 24. Nilsson RH, Tedersoo L, Lindahl BD, Kjøller R, Carlsen T, et al. (2011)
Towards standardization of the description and publication of next-generation sequencing datasets of fungal communities. New Phytol 191: 314–318. 25. Schoch CL, Seifert KA, Huhndorf S, Robert V, Spouge JL, et al. (2012) Proc
Natl Acad Sci USA 109: 6241–6246.
26. Hebert PDN, Cywinska A, Ball SL, DeWaard JR (2003) Biological identifica-tions through DNA barcodes. Proc R Soc Lond Ser B 270: 313–321. 27. CBOL Plant Working Group (2009) A DNA barcode for land plants. Proc Natl
Acad Sci USA 106: 12794–12797.
28. Valentini A, Pompanon F, Taberlet P (2009) DNA barcoding for ecologists. Trends Ecol Evol 24: 110–117.
29. Begerow D, Nilsson H, Unterseher M, Maier W (2010) Current state and perspectives of fungal DNA barcoding and rapid identification procedures. Appl Microbiol Biotechnol 87: 99–108.
30. Corse E, Costedoat C, Chappaz R, Pech N, Martin J, Gilles A (2010) A PCR-based method for diet analysis in freshwater organisms using 18S rDNA barcoding on faeces. Mol Ecol Res 10: 96–108.
31. Kelly LJ, Hollingsworth PM, Coppins BJ, Ellis CJ, Harrold P, et al. (2011) DNA barcoding of lichenized fungi demonstrates high identification success in a floristic context. New Phytol 191: 288–300.
32. Sato H, Murakami N (2008) Reproductive isolation among cryptic species in the ectomycorrhizal genusStrobilomyces: Population-level caps marker-based genetic analysis. Mol Phyl Evol 48: 326–334.
33. Sato H, Yumoto T, Murakami N (2007) Cryptic species and host specificity in the ectomycorrhizal genus Strobilomyces (Strobilomycetaceae). Am J Bot 94: 1630–1641.
34. Lumini E, Orgiazzi A, Borriello R, Bonfante P, Bianciotto V (2009) Disclosing arbuscular mycorrhizal fungal biodiversity in soil through a land-use gradient using a pyrosequencing approach. Env Microbiol 12: 2165–2179.
35. Dumbrell AJ, Ashton PD, Aziz N, et al. (2011) Distinct seasonal assemblages of arbuscular mycorrhizal fungi revealed by massively parallel pyrosequencing. New Phytol 190: 794–804.
36. Moora M, Berger S, Davison J, O¨ pik M, Bommarco R, et al. (2011) Alien plants associate with widespread generalist arbuscular mycorrhizal fungal taxa: Evidence from a continental-scale study using massively parallel 454 sequencing. J Biogeogr 38: 1305–1317.
37. Arfi Y, Bue´e M, Marchand C, Levasseur A, Record E (2012) Multiple markers pyrosequencing reveals highly diverse and host specific fungal communities on the mangrove treesAvicennia marinaandRhizophora stylosa. FEMS Microbiol Ecol 79: 433–444.
39. Bellemain E, Carlsen T, Brochmann C, Coissac E, Taberlet P, et al. (2010) ITS as an environmental DNA barcode for fungi: an in silico approach reveals potential PCR biases. BMC Microbiol 10: 189.
40. White TJ, Bruns T, Lee S, Taylor J (1990) Amplification and direct sequencing of fungal ribosomal RNA genes for phylogenetics. In PCR protocols a guide to methods and applications, 315–322. Academic Press, San Diego.
41. Gardes M, Bruns TD (1993) ITS primers with enhanced specificity for Basidiomycetes: application to the identification of mycorrhizae and rusts. Mol Ecol 2: 113–118.
42. Egger KN (1995) Molecular analysis of ectomycorrhizal fungal communities. Canadian J Bot 73: 1415–1415.
43. Martin KJ, Rygiewicz PT (2005) Fungal-specific PCR primers developed for analysis of the ITS region of environmental DNA extracts. BMC Microbiol 5: 28.
44. Manter DK, Vivanco JM (2007) Use of the ITS primers, ITS1F and ITS4, to characterize fungal abundance and diversity in mixed-template samples by qPCR and length heterogeneity analysis. J Microbiol Methods 71: 7–14. 45. Wallander H, Johansson U, Sterkenburg E, Durling MB, Lindahl BD (2010)
Production of ectomycorrhizal mycelium peaks during canopy closure in Norway spruce forests. New Phytol 187: 1124–1134.
46. Tedersoo L, Nilsson RH, Abarenkov K, Jairus T, Sadam A, et al. (2010) 454 Pyrosequencing and Sanger sequencing of tropical mycorrhizal fungi provide similar results but reveal substantial methodological biases. New Phytol 188: 291–301.
47. Huang X, Wang J, Aluru S, Yang SP, Hillier LD (2003) PCAP: a whole-genome assembly program. Genome Res 13: 2164.
48. Huang X, Madan A (1999) CAP3: A DNA sequence assembly program. Genome Res 9: 868.
49. Katoh K, Kuma K, Toh H, Miyata T (2005) MAFFT version 5: improvement in accuracy of multiple sequence alignment. Nucleic Acids Research 33: 511–518. 50. Jumpponen A, Jones KL (2010) Seasonally dynamic fungal communities in the
Quercus macrocarpaphyllosphere differ between urban and nonurban environ-ments. New Phytol 186: 496–513.
51. Bue´e M, Reich M, Murat C, Morin E, Nilsson RH, et al. (2009) 454 Pyrosequencing analyses of forest soils reveal an unexpectedly high fungal diversity. New Phytol 184: 449–456.
52. Ghannoum MA, Jurevic RJ, Mukherjee PK, Cui F, Sikaroodi M, et al. (2010) Characterization of the oral fungal microbiome (mycobiome) in healthy individuals. PLoS Pathogens 6: e1000713.
53. Amend AS, Seifert KA, Samson R, Bruns TD (2010) Indoor fungal composition is geographically patterned and more diverse in temperate zones than in the tropics. Proc Natl Acad Sci USA 107: 13748–13753.