Early life, current socioeconomic
position and serum lipids in young
adulthood of participants in a
cohort study initiated in 1978/1979
1Departamento de Saúde Pública, 2Departamento de Medicina III,
Universidade Federal do Maranhão, São Luís, MA, Brasil
3Departamento de Puericultura e Pediatria,
Faculdade de Medicina de Ribeirão Preto, Universidade de São Paulo, Ribeirão Preto, SP, Brasil
F.P. Figueiredo1,
A.A.M. Silva1, H. Bettiol3,
M.A. Barbieri3, R.F.L. Batista1,
F. Lamy Filho2, R.A. Silva1 and
V.M.F. Aragão2
Abstract
The association between socioeconomic position (SEP) and serum lipids has been little studied and the results have been controversial. A total of 2063 young adults born in 1978/79 were evaluated at 23-25 years of age in the fourth follow-up of a cohort study carried out in Ribeirão Preto, SP, Brazil, corresponding to 31.8% of the original sample. Total serum cholesterol (TC), triglycerides, high-density cholesterol (HDL cholesterol) and low-density cholesterol (LDL cho-lesterol) were analyzed according to SEP at birth and during young adulthood. SEP was classified into tertiles of family income and a cumulative score of socioeconomic disadvantage was created. TC was 11.85 mg/100 mL lower among men of lower SEP in childhood (P < 0.01) but no difference was found in women, whereas it was 8.46 lower among men (P < 0.01) and 8.21 lower among women of lower SEP in adulthood (P < 0.05). Individuals of lower SEP had lower LDL and HDL cholesterol, with small differences between sexes and between the two times in life. There was no association between SEP and triglyceride levels. After adjustment of income at one time point in relation to the other, some associations lost significance. The greater the socioeconomic disadvantage accumulated along life, the lower the levels of TC, LDL and HDL cholesterol (P < 0.05). The socioeconomic gradient of TC and LDL cholesterol was inverse, representing a lower cardiovascular risk for individuals of lower SEP, while the socioeconomic gradient of HDL cholesterol indicated a lower cardiovascular risk for individuals of higher SEP.
Correspondence
A.A.M. Silva
Departamento de Saúde Pública, UFMA
Rua Barão de Itapary, 155 65070-020 São Luís, MA Brasil
Fax: +55-98-3232-1264 E-mail: [email protected] Research supported by CNPq, Fundação de Auxílio ao Ensino, Pesquisa e Assistência, HCFMRP-USP, and FAPESP (Nos. 93/0525-0 and 00/09508-7).
Received October 10, 2006 Accepted May 21, 2007
Key words
•Cholesterol •HDL cholesterol •LDL cholesterol •Triglycerides
•Cardiovascular diseases •Socioeconomic
circumstances
Introduction
It has long been known that socioeco-nomic circumstances are related to health (1).Several studies have been conducted in
with higher rates of obesity, arterial hyper-tension, diabetes mellitus, cigarette smok-ing, angina, bronchitis, dyslipidemia, meta-bolic syndrome, and cardiovascular disease (2-4,7-9).
The socioeconomic circumstances inter-fere with the health of an individual from childhood to adulthood (10). Thus, if socio-economic conditions are measured in only one stage of life it is difficult to determine their impact on health during adulthood (11-14). On this basis, several studies have been conducted in order to differentiate the im-pact of socioeconomic disadvantage on obe-sity (9), mortality (11), hypertension (12), adult morbidity (14,15), and myocardial infaction (16) during the different phases of life. Previous studies have concluded that individuals who ascend socioeconomically have lower rates of obesity and arterial hy-pertension during adulthood compared to those who remain in the same socioeco-nomic class, suggesting that the influence of socioeconomic position during younger ages may be partially reversible (9,12).
The association between socioeconomic circumstances and serum lipids has been little studied and the results obtained are controversial and vary with the stage of life when the socioeconomic position was meas-ured (childhood or adulthood), with lipids and with sex. Lower high-density choles-terol (HDL cholescholes-terol) values have been observed in men and women of low socio-economic level both during childhood and adulthood (17). Triglyceride (TG) levels are not associated with socioeconomic position during childhood, while during adulthood the less favored occupational classes have higher TG levels (4,17). Brunner et al. (17) observed higher total cholesterol values in individuals of low socioeconomic level, while other investigators reported higher lev-els for individuals of higher socioeconomic level (2-4,11).
The effect of social mobility or of the accumulation of experience in
underprivi-leged socioeconomic circumstances during more than one stage of life on serum lipids has also been little studied. A study of a cohort born at the beginning of the 20th century in Scotland suggested that choles-terol levels are lower among individuals of less privileged socioeconomic classes and that accumulated exposure to a low socio-economic position during various stages of life contributes to the reduction of serum cholesterol (3,11).
Today, cardiovascular diseases are the major cause of death in Brazil (18). Thus, it is essential to determine the effect of socio-economic circumstances on serum lipid lev-els, which are important risk factors for car-diovascular diseases (19). In the present study, we attempted to answer the following questions: Is there an association between socioeconomic position during childhood and adulthood and serum lipid levels of total cholesterol, TG, HDL cholesterol, and low-density cholesterol (LDL cholesterol)? Is the association between socioeconomic po-sition during childhood and lipid levels dur-ing adulthood the same as the association observed with socioeconomic position dur-ing adulthood? Does belongdur-ing to a low socioeconomic class in different phases of life modify serum lipid levels? Do these associations occur in a similar manner in men and women?
Material and Methods
not from Ribeirão Preto and did not reside in this city at the time of delivery were ex-cluded from the follow-up study. Thus, 6973 liveborns remained in the study, 6827 of them being singletons and 146 correspond-ing to twin deliveries. Of the 6827 scorrespond-ingle- single-tons, 246 died during the first year of life and 97 died by 20 years of age, for a total of 343 deaths. Consequently, 6484 persons were eligible for follow-up after excluding non-residents, multiple births and deaths.
Based on the charts of liveborns of the original cohort eligible for follow-up, which contained the name and address of the mother and the date of birth of the infant, partici-pants were located using the following sources: the Hygia system of electronic scheduling of visits for users of the medical services of the Unified Health System (SUS) in Ribeirão Preto, lists of users of private health plans, charts of evaluation of school-children of the cohort performed in 1987/89, and charts of evaluation of the military re-cruits belonging to the original cohort. A total of 5665 individuals were located, with the initial contact being made by telephone. In addition, letters containing explanations about the objectives of the study and a tele-phone number reserved for the project were mailed. Other means of dissemination of the information were used, such as television, radio and newspapers, as well as the distri-bution of explanatory posters to public health services.
Based on the geo-economic character-ization of the city, that is composed of four geographic regions defined by the income of the head of the family and classified as “poor”, “middle-poor”, “middle-rich”, and “rich”, 1 of each 3 individuals belonging to the same geographic area was contacted. In case of a refusal or of the impossibility to participate (e.g., imprisonment, death or se-rious disease) or the inability to locate an individual, contact was made with the next name on the list. In this process, 705 indi-viduals had to be replaced because of refusal
(209 cases), imprisonment (31 cases), death after 20 years of age (34 cases), and failure to appear for the interview (431 cases). Thus, 2063 young adults were contacted and ef-fectively participated in the fourth phase of the study from April 2, 2002 to May 13, 2004, corresponding to 31.8% of the origi-nal sample. Individuals of low socioeco-nomic position had lower follow-up rates (30.3% among females and 25.3% among males) compared to those of high socioeco-nomic position (36.3% for females and 36.0% for males; all P values < 0.05). Family in-come at birth was missing for 1219 subjects (18.8%) and family income during adult-hood was not reported by 151 individuals, corresponding to 7.3% of the cohort. The methodology of this study was described in detail in previous publications (21,22).
Four structured questionnaires were ap-plied to these individuals according to stan-dardized and internationally recommended techniques. In addition, a 40-mL blood sam-ple was collected from each subject for the measurement of serum levels of total choles-terol, TG, HDL cholescholes-terol, and LDL cho-lesterol by a colorimetric enzymatic method using a Dade Behring Xpand instrument (Dade Behring, Liederbach, Germany) and chemical reagents from Dade Behring Di-mension (21).
Indicator of socioeconomic position
After elimination of individuals belong-ing to families whose monthly income was not determined (N = 339), family incomes at birth and during adulthood were arranged in increasing order and categorized as tertiles.
Cumulative score of socioeconomic disadvantage
individuals with scores of 1 and 2 or 2 and 1.
Statistical analysis
The mean and standard deviations for the markers of dyslipidemia under study were calculated for men and women in each cat-egory of socioeconomic position during childhood and adulthood. Next, the coeffi-cients and their 95% confidence intervals were calculated in relation to the mean for the basal category (highest income tertiles) in simple linear regression models. We also calculated for the income tertiles in adult-hood and in childadult-hood the coefficients and their confidence intervals adjusted accord-ing to the income tertiles at the other time point. The models were stratified by sex.
In addition, to determine the cumulative effect of socioeconomic disadvantage dur-ing the life of the individuals, the coeffi-cient, 95% confidence interval and the P 2004. A score of 0 was assigned to
individu-als classified into the category of highest income, a score of 1 was assigned to indi-viduals in the intermediate category, and a score of 2 to individuals in the lowest in-come category. The sum of the two scores assigned to each individual at the two time points in life represented the cumulative score of socioeconomic disadvantage for that sub-ject. Thus, the indicator ranged from 0 to 4, with a 0 indicator being attributed to the individuals assigned to the highest income at the two time points (0 and 0) and a 4 indica-tor being attributed to the individuals as-signed to the lowest income at the two time points (2 and 2). On this basis, the 1 indicator represents individuals whose socioeconomic scores were 0 and 1 or 1 and 0 at the two time points, respectively; the 2 indicator repre-sents individuals whose scores were 0 and 2, 2 and 0 or 1 and 1, respectively, for each phase of the study; the 3 indicator represents
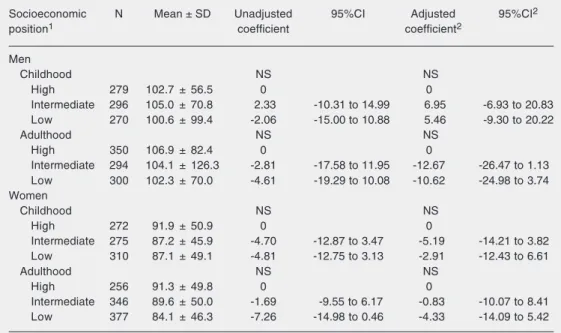
Table 1. Serum triglyceride levels of each sex according to socioeconomic position in childhood and adulthood.
Socioeconomic N Mean ± SD Unadjusted 95%CI Adjusted 95%CI2
position1 coefficient coefficient2
Men
Childhood NS NS
High 279 102.7 ± 56.5 0 0
Intermediate 296 105.0 ± 70.8 2.33 -10.31 to 14.99 6.95 -6.93 to 20.83
Low 270 100.6 ± 99.4 -2.06 -15.00 to 10.88 5.46 -9.30 to 20.22
Adulthood NS NS
High 350 106.9 ± 82.4 0 0
Intermediate 294 104.1 ± 126.3 -2.81 -17.58 to 11.95 -12.67 -26.47 to 1.13
Low 300 102.3 ± 70.0 -4.61 -19.29 to 10.08 -10.62 -24.98 to 3.74
Women
Childhood NS NS
High 272 91.9 ± 50.9 0 0
Intermediate 275 87.2 ± 45.9 -4.70 -12.87 to 3.47 -5.19 -14.21 to 3.82
Low 310 87.1 ± 49.1 -4.81 -12.75 to 3.13 -2.91 -12.43 to 6.61
Adulthood NS NS
High 256 91.3 ± 49.8 0 0
Intermediate 346 89.6 ± 50.0 -1.69 -9.55 to 6.17 -0.83 -10.07 to 8.41
Low 377 84.1 ± 46.3 -7.26 -14.98 to 0.46 -4.33 -14.09 to 5.42
Data are reported as mean ± SD. 95%CI = confidence interval at 95%.
1Individuals whose socioeconomic position was unknown were excluded. 2Adjustment according to income
Table 2. Total serum cholesterol level for each sex according to socioeconomic position during childhood and adulthood.
Socioeconomic N Mean ± SD Unadjusted 95%CI Adjusted 95%CI2
position1 coefficient coefficient2
Men
Childhood ** NS
High 279 170.9 ± 35.4 0 0
Intermediate 296 165.4 ± 40.0 -5.52 -11.81 to 0.78 -2.69 -9.50 to 4.11
Low 270 159.1 ± 39.7 -11.85 -18.29 to -5.41 -8.68 -15.92 to -1.44
Adulthood ** NS
High 350 170.8 ± 36.5 0 0
Intermediate 294 162.5 ± 39.1 -8.33 -14.24 to -2.41 -8.30 -15.07 to -1.53
Low 300 162.3 ± 38.9 -8.46 -14.34 to -2.58 -5.25 -12.30 to 1.79
Women
Childhood NS NS
High 272 173.1 ± 36.4 0 0
Intermediate 275 169.3 ± 33.9 -3.76 -9.58 to 2.05 -3.00 -9.29 to 3.29
Low 310 168.8 ± 33.7 -4.25 -9.90 to 1.40 -1.38 -8.02 to 5.25
Adulthood * NS
High 256 174.7 ± 38.4 0 0
Intermediate 346 170.8 ± 32.0 -3.86 -9.45 to 1.73 -2.14 -8.59 to 4.30
Low 377 166.5 ± 34.0 -8.21 -13.70 to -2.72 -6.12 -12.92 to 0.68
Data are reported as mean ± SD. 95%CI = confidence interval at 95%.
1Individuals whose socioeconomic position was unknown were excluded. 2Adjustment according to income
at the other time studied. NS = not statistically significant. *P < 0.05. **P < 0.01. P values estimated by the likelihood ratio test.
value for linear trend were calculated for each serum lipid. The significance of this trend represents the difference in mean se-rum lipid level according to increasing so-cioeconomic disadvantage. The calculations were performed using the Stata 8.0 statisti-cal software(23).
Results
The serum TG levels of men and women were not related to socioeconomic position in childhood or in adulthood (Table 1).
Serum cholesterol level was 11.85 mg/ 100 mL lower among men of lower socio-economic position in childhood than among those of higher position (P < 0.01), whereas it was 8.46 lower among men of lower socio-economic position in adulthood compared with their counterparts (P < 0.01). Among women, only a lower income during adult-hood was associated with lower total
choles-terol levels. Women of low socioeconomic position in adulthood had serum cholesterol levels 8.21 mg/100 mL lower than those of high position (P < 0.05). After adjustment of income at one time point in relation to the other, the associations showed a borderline level of significance in men (P values be-tween 0.05 and 0.10) whereas in women the association previously existing between in-come during adulthood and total cholesterol levels was no longer significant (Table 2).
Table 3. Serum LDL cholesterol levels for each sex according to socioeconomic position during childhood and adulthood.
Socioeconomic N Mean ± SD Unadjusted 95%CI Adjusted 95%CI2
position1 coefficient coefficient2
Men
Childhood ** **
High 278 105.6 ± 30.9 0 0
Intermediate 293 102.6 ± 34.5 -3.02 -8.46 to 2.43 -1.22 -7.10 to 4.66
Low 269 95.3 ± 33.8 -10.26 -15.83 to -4.70 -9.23 -15.49 to -2.97
Adulthood * NS
High 348 105.1 ± 32.2 0 0
Intermediate 292 99.5 ± 32.3 -5.53 -10.64 to -0.43 -5.18 -11.03 to 0.67
Low 297 99.4 ± 34.0 -5.65 -10.74 to -0.57 -1.37 -7.47 to 4.73
Women
Childhood NS NS
High 272 98.5 ± 29.5 0 0
Intermediate 275 100.5 ± 28.6 2.02 -2.89 to 6.94 1.03 -4.27 to 6.32
Low 309 100.7 ± 29.7 2.15 -2.62 to 6.93 1.68 -3.91 to 7.27
Adulthood NS NS
High 256 99.4 ± 31.7 0 0
Intermediate 345 100.2 ± 27.5 0.77 -3.96 to 5.50 1.99 -3.43 to 7.42
Low 377 100.0 ± 29.0 0.57 -4.08 to 5.21 1.27 -4.46 to 6.99
Data are reported as mean ± SD. 95%CI = confidence interval at 95%.
1Individuals whose socioeconomic position was unknown were excluded. 2Adjustment according to income
at the other time studied. NS = not statistically significant. *P < 0.05. **P < 0.01. P values estimated by the likelihood ratio test.
Table 4. Serum HDL cholesterol levels for each sex according to socioeconomic position during childhood and adulthood.
Socioeconomic N Mean ± SD Unadjusted 95%CI Adjusted 95%CI2
position1 coefficient coefficient2
Men
Childhood ** *
High 279 44.9 ± 10.8 0 0
Intermediate 296 42.3 ± 10.5 -2.64 -4.38 to -0.90 -2.42 -4.29 to -0.56
Low 270 44.0 ± 10.5 -0.92 -2.69 to 0.86 -0.21 -2.20 to 1.77
Adulthood * NS
High 350 44.7 ± 10.3 0 0
Intermediate 294 42.9 ± 11.0 -1.77 -3.41 to -0.14 -1.06 -2.92 to 0.79
Low 300 42.7 ± 10.3 -1.92 -3.55 to -0.30 -1.82 -3.75 to 0.11
Women
Childhood *** *
High 272 56.1 ± 14.1 0 0
Intermediate 275 51.3 ± 13.2 -4.80 -7.04 to -2.56 -2.94 -5.33 to -0.55
Low 310 50.6 ± 12.9 -5.52 -7.70 to -3.35 -2.59 -5.11 to -0.06
Adulthood *** ***
High 256 57.0 ± 13.6 0 0
Intermediate 346 52.6 ± 13.0 -4.37 -6.45 to -2.28 -4.04 -6.49 to -1.59
Low 377 49.7 ± 12.3 -7.34 -9.39 to -5.29 -6.50 -9.09 to -3.91
Data are reported as mean ± SD. 95%CI = confidence interval at 95%.
1Individuals whose socioeconomic position was unknown were excluded. 2Adjustment according to income
was detected in women (Table 3).
Serum HDL cholesterol level was 0.92 mg/100 mL lower among men of lower so-cioeconomic position in childhood than among those of higher position (P < 0.05), whereas it was 1.92 lower among men of lower socioeconomic position in adulthood compared with their counterparts (P < 0.05). Women of low socioeconomic position in childhood had serum HDL cholesterol lev-els 5.52 mg/100 mL lower than those of high position (P < 0.001), whereas women of low socioeconomic backgrounds in adulthood presented HDL cholesterol levels 7.34 mg/ 100 mL lower than those of high socioeco-nomic position (P < 0.001). After adjust-ment for income during childhood, only so-cioeconomic position during childhood con-tinued to be associated with HDL choles-terol levels in men (P < 0.05). In women, socioeconomic position at birth (P < 0.05) and during adult age (P < 0.001) continued to be associated with HDL cholesterol after adjustment (Table 4).
Men classified into the lower income
group at the two time points in life had lower total cholesterol (P < 0.001), LDL choles-terol (P < 0.01) and HDL cholescholes-terol levels (P < 0.05). In women, greater accumulated social disadvantage was associated with lower total cholesterol (P < 0.05) and HDL cholesterol (P < 0.001) levels but not with LDL cholesterol. Socioeconomic score was not associated with TG levels in either sex (Table 5).
Discussion
Associations between low socioeconomic position and lower serum levels of total cho-lesterol and LDL chocho-lesterol were observed in the present study, indicating that, regard-ing these risk factors, individuals of lower socioeconomic position may be at lower risk for cardiovascular disease. However, regard-ing HDL cholesterol, the lipid fraction whose levels are inversely related to cardiovascular events (19), lower levels of this lipid compo-nent were also associated with lower family income both during childhood and during
Table 5. Lipid profile for each sex according to cumulative score of socioeconomic disadvantage.
Score1 N Triglycerides Total cholesterol LDL cholesterol HDL cholesterol
Coefficient 95%CI Coefficient 95%CI Coefficient 95%CI Coefficient 95%CI
Men NS *** ** *
0 166 0 (107.0)2 0 (174.2)2 0 (107.7)2 0 (45.3)2
1 141 -6.74 -24.38 to 10.90 -6.05 -14.69 to 2.60 -3.86 -11.34 to 3.62 -0.95 -3.33 to 1.42
2 204 -2.92 -19.02 to 13.18 -10.59 -18.48 to -2.69 -6.66 -13.51 to 0.19 -2.97 -5.14 to -0.81
3 154 -4.08 -21.31 to 13.15 -13.87 -22.32 to -5.42 -10.21 -17.54 to -2.87 -2.41 -4.72 to -0.09
4 129 -8.89 -26.96 to 9.19 -13.47 -22.33 to -4.61 -10.00 -17.66 to -2.33 -1.79 -4.22 to 0.64
Women NS * NS ***
0 136 0 (97.1)2 0 (176.6)2 0 (98.7)2 0 (58.5)2
1 139 -14.61 -26.33 to -2.90 -6.59 -14.78 to 1.60 -0.37 -7.26 to 6.51 -3.27 -6.39 to -0.15
2 168 -6.61 -17.81 to 4.59 -7.46 -15.30 to 0.37 0.60 -5.98 to 7.19 -6.78 -9.76 to -3.79
3 181 -6.65 -17.67 to 4.37 -5.52 -13.23 to 2.18 4.34 -2.15 to 10.83 -8.65 -11.59 to -5.72
4 162 -13.40 -24.69 to -2.10 -10.19 -18.09 to -2.29 1.13 -5.52 to 7.77 -8.66 -11.66 to -5.65
1Individuals with unknown socioeconomic trajectory were excluded. Scores: 0, individual classified into the highest income category (third tertile)
at the two times studied (birth and adulthood); 1, individuals with middle (second tertile) and high, or high and middle income at the two times studied; 2, individuals with middle income at the two times in life or with high and low or low and high income; 3, individuals with low (first tertile) and middle, or middle and low income at the two times studied; 4, individuals classified into the lowest income category at the two times studied. 2The mean is given within parentheses. 95%CI = confidence interval at 95%.
adult life, suggesting that more advanta-geous socioeconomic positions seem to have a protective effect against cardiovascular diseases, at least with respect to HDL cho-lesterol (4,17). There was no association between socioeconomic position and serum TG levels. The longer an individual lived in a lower socioeconomic position, the lower his cholesterol, LDL cholesterol and HDL cholesterol levels, suggesting a beneficial effect of remaining in a disadvantaged social position regarding total cholesterol and LDL cholesterol and a deleterious effect regard-ing HDL cholesterol. Small differences in these risk profiles were detected regarding socioeconomic circumstances during child-hood and adult life between men and women. Higher serum total cholesterol levels were detected in individuals with less socioeco-nomic disadvantage. Among men there was a cumulative effect since income during both childhood and adult life was associated with the levels of this lipid fraction. Blane et al. (3) detected a relation similar to the present one when using as an indicator of socioeco-nomic position the occupation of the family head during the subject’s childhood and the occupation of the individual himself during adulthood. On the other hand, in the present study, only income during adult life not adjusted for income during childhood was associated with serum total cholesterol in women. When the adjustment was per-formed, this association was no longer de-tected. The same association detected here between lower total cholesterol values and lower socioeconomic position was also dem-onstrated by other investigators (2,3,11). However, other investigators (17) observed an association of worse socioeconomic con-ditions during childhood and higher total cholesterol levels in women, in contrast to the present results.
Among males, lower income during child-hood and adultchild-hood was associated with lower LDL cholesterol levels. However, the association existing with socioeconomic
position during adulthood was due to the influence of income during childhood on this association since after adjustment the association between income during adult age and LDL cholesterol levels disappeared. The absence of an association between income during adult age and LDL cholesterol level was previously demonstrated by Brunner et al. (4). However, these investigators detected a relation between lower socioeconomic po-sition and higher LDL cholesterol levels in women, a fact that once again diverges from the present results.
TG levels, in turn, were not associated with socioeconomic position at either time point in this population of young adults. In agreement with these results, Brunner et al. (17) also did not demonstrate a relation be-tween socioeconomic position during child-hood and serum TG levels. However, in that same cohort, individuals of lower socioeco-nomic position during adulthood presented higher TG levels (17).
change with age.
These disparities may also be due to dif-ferences between more developed and less developed societies. It is known that in more industrialized societies of the beginning of the 20th century (as was the case for the society to which the cohort studied by Brunner et al. (17) belonged), richer indi-viduals showed a higher prevalence of obe-sity. This relation was reversed in these soci-eties, especially among women (6). The same pattern may be repeated now for the lipid profile since the association between dysli-pidemia and obesity is well known (17).
There was agreement between the pres-ent data and those reported in a Scottish study (3,11), since in both cases lower socio-economic positions were found to be associ-ated with lower serum cholesterol levels, demonstrating that the socioeconomic gra-dient of cholesterol followed the opposite direction of cardiovascular risk. The Scot-tish study was conducted on individuals born at the beginning of the last century, between 1906 and 1938, who were working in 27 factories and offices between 1970 and 1973, ranging in age from 35 to 62 years (3). On the other hand, Brunner et al. (17) (Whitehall II), who studied London public servants born between 1928 and 1954, ranging in age from 39 to 63 years from 1991 to 1993, observed lower cholesterol levels in individuals of higher socioeconomic position. It is possible that older cohorts such as the Scottish one expressed a counter-gradient of serum cho-lesterol that was later reversed in younger cohorts studied in more developed urban nuclei such as London. In contrast, Ribeirão Preto would represent the profile of a devel-oping country that, even at the end of the last century, was more similar to that of cohorts studied at the beginning of the 20th century in developed countries. If this explanation is correct, this inversion of the counter-gradi-ent would occur in a more delayed manner in developing countries and, in the future, this socioeconomic counter-gradient of serum
cholesterol would be expected to be reversed in Ribeirão Preto.
The first lipid marker that reverses the counter-gradient may be HDL cholesterol. Thus, since the present cohort consists of young adults (23-25 years of age), perhaps the HDL cholesterol values already present the non-reversed socioeconomic gradient of higher risk for cardiovascular disease among individuals of lower socioeconomic position. In addition, the association observed be-tween socioeconomic position and HDL cho-lesterol levels may be due in part to the different alcohol consumption observed in the study population according to income. In Ribeirão Preto, individuals with better so-cioeconomic positions have a higher mean consumption of alcohol than individuals of lower position (21). According to Koppes et al. (24), alcohol consumption increases HDL cholesterol. Thus, the richer individuals in this cohort may present higher HDL choles-terol values as the consequence of greater alcohol consumption.
The differences between men and women in the associations between socioeconomic position during life and the various serum lipid markers, especially LDL cholesterol and total cholesterol, suggest that social in-equalities have a different impact according to sex. As also observed in the present study, Brunner et al. (4) demonstrated that the in-verse association between socioeconomic position and some risk factors for cardiovas-cular disease is less consistent among women than men.
the present study, especially in developing countries.
The evidence obtained in the present study suggests that socioeconomic disadvantage, both in childhood and in adulthood, inter-feres with serum lipid values in a different manner in men and women. A reversed so-cioeconomic gradient was observed with re-spect to total cholesterol and LDL
choles-terol (individuals of lower socioeconomic position have lower serum levels of these lipids, indicating a greater cardiovascular risk among richer people) and a socioeco-nomic gradient was observed regarding HDL cholesterol (individuals of lower socioeco-nomic position have lower serum levels of this lipid, indicating a higher cardiovascular risk among poorer people).
References
1. Krieger N, Williams DR, Moss NE. Measuring social class in US public health research: concepts, methodologies, and guidelines.
Annu Rev Public Health 1997; 18: 341-378.
2. Ferrie JE, Shipley MJ, Stansfeld SA, Smith GD, Marmot M. Future uncertainty and socioeconomic inequalities in health: the Whitehall II study. Soc Sci Med 2003; 57: 637-646.
3. Blane D, Hart CL, Smith GD, Gillis CR, Hole DJ, Hawthorne VM. Association of cardiovascular disease risk factors with socioeco-nomic position during childhood and during adulthood. BMJ 1996; 313: 1434-1438.
4. Brunner EJ, Marmot MG, Nanchahal K, Shipley MJ, Stansfeld SA, Juneja M, et al. Social inequality in coronary risk: central obesity and the metabolic syndrome. Evidence from the Whitehall II study. Dia-betologia 1997; 40: 1341-1349.
5. Grundy E, Holt G. Adult life experiences and health in early old age in Great Britain. Soc Sci Med 2000; 51: 1061-1074.
6. Sobal J, Stunkard AJ. Socioeconomic status and obesity: a review of the literature. Psychol Bull 1989; 105: 260-275.
7. Morrison C, Woodward M, Leslie W, Tunstall-Pedoe H. Effect of socioeconomic group on incidence of, management of, and survival after myocardial infarction and coronary death: analysis of commu-nity coronary event register. BMJ 1997; 314: 541-546.
8. Barker DJ, Forsen T, Uutela A, Osmond C, Eriksson JG. Size at birth and resilience to effects of poor living conditions in adult life: longitudinal study. BMJ 2001; 323: 1273-1276.
9. Langenberg C, Hardy R, Kuh D, Brunner E, Wadsworth M. Central and total obesity in middle aged men and women in relation to lifetime socioeconomic status: evidence from a national birth cohort.
J Epidemiol Community Health 2003; 57: 816-822.
10. Power C, Matthews S, Manor O. Inequalities in self-rated health: explanations from different stages of life. Lancet 1998; 351: 1009-1014.
11. Smith GD, Hart C, Blane D, Gillis C, Hawthorne V. Lifetime socio-economic position and mortality: prospective observational study.
BMJ 1997; 314: 547-552.
12. Matthews KA, Kiefe CI, Lewis CE, Liu K, Sidney S, Yunis C. Socio-economic trajectories and incident hypertension in a biracial cohort of young adults. Hypertension 2002; 39: 772-776.
13. Forsdahl A. Are poor living conditions in childhood and adolescence an important risk factor for arteriosclerotic heart disease? Br J Prev Soc Med 1977; 31: 91-95.
14. Marmot M, Shipley M, Brunner E, Hemingway H. Relative contribu-tion of early life and adult socioeconomic factors to adult morbidity in the Whitehall II study. J Epidemiol Community Health 2001; 55: 301-307.
15. Singh-Manoux A, Ferrie JE, Chandola T, Marmot M. Socioeconomic trajectories across the life course and health outcomes in midlife: evidence for the accumulation hypothesis? Int J Epidemiol 2004; 33: 1072-1079.
16. Hallqvist J, Lynch J, Bartley M, Lang T, Blane D. Can we disen-tangle life course processes of accumulation, critical period and social mobility? An analysis of disadvantaged socio-economic posi-tions and myocardial infarction in the Stockholm Heart Epidemiol-ogy Program. Soc Sci Med 2004; 58: 1555-1562.
17. Brunner E, Shipley MJ, Blane D, Smith GD, Marmot MG. When does cardiovascular risk start? Past and present socioeconomic circum-stances and risk factors in adulthood. J Epidemiol Community Health
1999; 53: 757-764.
18. Carmo EH, Barreto ML, Silva JB Jr. Mudanças nos padrões de morbimortalidade da população brasileira: os desafios para um novo século. Epidemiol Serv Saúde 2003; 12: 63-75.
19. Santos RD. III Brazilian Guidelines on Dyslipidemias and Guideline of Atherosclerosis Prevention from Atherosclerosis Department of Sociedade Brasileira de Cardiologia. Arq Bras Cardiol 2001; 77 (Suppl 3): 1-48.
20. Barbieri MA, Gomes UI, Barros Filho AA, Bettiol H, Almeida LEA, Silva AAM. Saúde perinatal em Ribeirão Preto, SP, Brasil: a questão do método. Cad Saúde Pública 1989; 5: 376-387.
21. Barbieri MA, Bettiol H, Silva AA, Cardoso VC, Simoes VM, Gutierrez MR, et al. Health in early adulthood: the contribution of the 1978/79 Ribeirão Preto birth cohort. Braz J Med Biol Res 2006; 39: 1041-1055.
22. Cardoso VC, Simões VMF, Barbieri MA, Silva AAM, Bettiol H, Alves MTSSB, et al. Profile of three Brazilian birth cohort studies in Ribeirão Preto, SP and São Luís, MA. Braz J Med Biol Res 2007; 40: Online Ahead of Print.
23. Stata Corporation. Stata Reference Manual release 8. [Computer program]. Texas: Stata Corporation; 2003.