A semi-automatic computerized
method to measure baroreflex-mediated
heart rate responses that reduces
interobserver variability
1Unidade de Hipertensão, 2Divisão de Bioengenharia, Instituto do Coração,
Hospital das Clínicas, Faculdade de Medicina, Universidade de São Paulo, São Paulo, SP, Brasil
P.P.S. Soares1,
M.R. Ushizima2,
E.M. Krieger1 and
M.C.C. Irigoyen1
Abstract
Arterial baroreflex sensitivity estimated by pharmacological im-pulse stimuli depends on intrinsic signal variability and usually a subjective choice of blood pressure (BP) and heart rate (HR) val-ues. We propose a semi-automatic method to estimate cardiovas-cular reflex sensitivity to bolus infusions of phenylephrine and nitroprusside. Beat-to-beat BP and HR time series for male Wistar rats (N = 13) were obtained from the digitized signal (sample fre-quency = 2 kHz) and analyzed by the proposed method (PRM) developed in Matlab language. In the PRM, time series were low-pass filtered with zero-phase distortion (3rd order Butterworth used in the forward and reverse direction) and presented graphi-cally, and parameters were selected interactively. Differences be-tween basal mean values and peak BP (∆BP) and HR (∆HR) values after drug infusions were used to calculate baroreflex sensitivity indexes, defined as the ∆HR/∆BP ratio. The PRM was compared to the method traditionally (TDM) employed by seven independent observers using files for reflex bradycardia (N = 43) and tachycar-dia (N = 61). Agreement was assessed by Bland and Altman plots. Dispersion among users, measured as the standard deviation, was higher for TDM for reflex bradycardia (0.60 ± 0.46 vs 0.21 ± 0.26 bpm/mmHg for PRM, P < 0.001) and tachycardia (0.83 ± 0.62 vs 0.28 ± 0.28 bpm/mmHg for PRM, P < 0.001). The advantage of the present method is related to its objectivity, since the routine auto-matically calculates the desired parameters according to previous software instructions. This is an objective, robust and easy-to-use tool for cardiovascular reflex studies.
Correspondence
P.P.S. Soares
Rua Dr. Mário Viana, 438 Bloco 3, Apto. 801 24241-002 Niterói, RJ Brasil
Fax: +55-21-2629-2405 E-mail: [email protected]
Research supported by FAPESP (No. 99/07620-5).
Received February 27, 2004 Accepted February 21, 2005
Key words
•Baroreflex sensitivity
•Heart rate
•Blood pressure
•Phenylephrine
•Nitroprusside
Introduction
Baroreflex sensitivity has important prog-nostic value for the stratification of risk for several pathophysiological cardiovascular
but also in human physiological studies. BP changes have been provoked by different stimuli (5), but intravenous administration of phenylephrine (PHE) and sodium nitroprus-side (SNP) by bolus injection, ramp or steady-state infusion has been most frequently em-ployed. In fact, several laboratories have used the bolus administration of drugs as the easiest way to induce BP changes and asso-ciated changes in heart rate (HR), followed by signal processing through linear regres-sion and logistic function analysis (6) or even by calculating a mean index (4). Indepen-dently of the statistical analysis used to com-pare experimental groups, the collection of data from the experimental sessions depends on the observer, who chooses a representa-tive beat or a representarepresenta-tive time duration (1 s, for example) to obtain HR and BP values before and during the effect of vasoactive drug administration. Baroreflex indexes are calculated on the basis of these values as the HR/BP ratio. This approach has been em-ployed in different protocols in which the BP signals were stored on a sheet of polygraph paper or as digitized signals in a computer. In both situations, subjective criteria are used to select the values used in baroreflex indexes which do not consider the inherent signal variability. Therefore, systematic and ran-dom errors can occur during parameter se-lection.
We propose a method to standardize baroreflex estimation using a semi-automatic routine for cardiovascular parameters that reduces the variability induced by respiration of the subject and the interobserver variabil-ity when determining the HR and BP values used to calculate the baroreflex sensitivity index.
Material and Methods
Invasive BP signals obtained from the femoral artery of male Wistar rats (N = 13; 2 kHz of sample frequency) were digitized with an analog-to-digital converter and
the first increase in SBP after drug infusion to the first decrease in SBP returning to basal levels. The mean values for basal SBP and HR were calculated by the algorithm that automatically determined the peak values for SBP and HR and then generated the barore-flex index (BI) according to Equation 1:
____
peak ______
peak
HR HR
BI (bpm / mmHg) SBP SBP
(Eq. 1)
where HR is the mean value of HR before drug administration, HRpeak is the peak value
of HR after drug administration, SBP is the mean value of SBP before drug administra-tion, and SBPpeak is the peak value of SBP
after drug administration
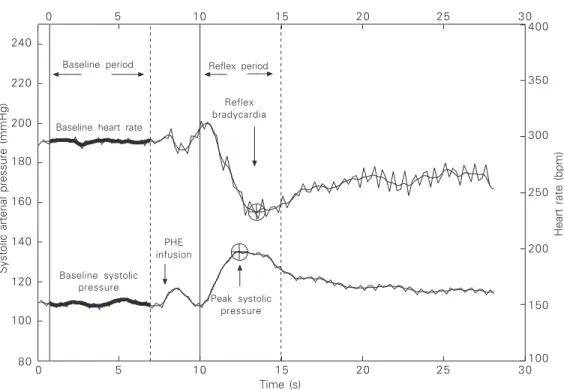
The visual output displays both basal mean values and peak values of SBP and HR superimposed to time series so that the ob-server can verify the accuracy of the method with vertical lines defining the beginning and the end of basal and reflex periods.
Figure 1 shows a typical graph of the bradycardic reflex response evoked by PHE infusion, in which a fast increase in SBP is followed by a decrease in HR. The beginning of the resting period and the reflex period are represented by continuous vertical lines, and the end of the basal and reflex periods by vertical dotted lines. The peak values of SBP (bottom line) and HR (upper line) are shown as a circle and cross on the lines. Some attention is needed to detect the HRpeak value
since it shows a clear delay in time from the SBPpeak value. This observation could not be
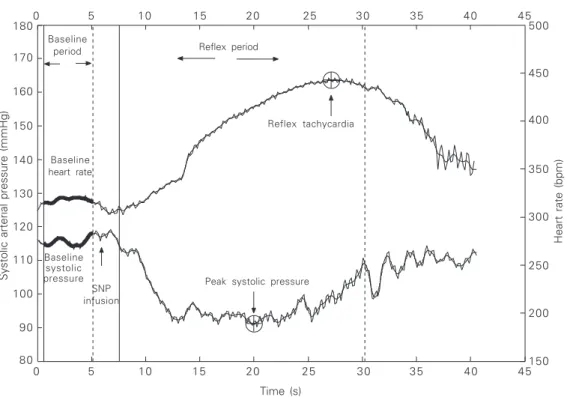
made if the temporal baseline of the signal was not preserved. The baroreflex index is shown on the top of the graph as bpm/ mmHg. The baroreflex index can also be displayed in ms/mmHg units when the pulse interval is used instead of HR. The reflex tachycardia response after SNP bolus injec-tions was obtained by the same procedure as used to evaluate the PHE-induced bradycar-dia. In this situation, the routine localizes the minimum SBP and maximum HR values
Systolic arterial pressure (mmHg)
240
Heart rate (bpm)
400
220
200
180
160
140
120
100
80
350
300
250
200
150
100
0 5 10 15 20 25 30
Time (s)
0 5 10 15 20 25 30
Reflex bradycardia for file F2412.DVW = -2.4166 bpm/mmHg
Baseline period Reflex period
Baseline heart rate
Reflex bradycardia
Baseline systolic pressure
PHE infusion
Peak systolic pressure
Systolic arterial pressure (mmHg)
160
Heart rate (bpm)
400 150
140
130
120
110
100
90
80
350
300
250
200
150
0 5 10 15 20 25 30
Time (s)
0 5 10 15 20 25 30
Reflex tachycardia for file F5490.DVW = 5.1301 bpm/mmHg
Baseline
period Reflex period
Baseline heart rate
Reflex tachycardia
Baseline systolic pressure
SNP infusion
Peak systolic pressure
35 40 45
35 40 45
450 500
170 180
obtained during drug administration. The procedures and features displayed on the graph are identical to those presented in Figure 1, except for SBP and HR responses to SNP infusion and the algorithm calcula-tions for tachycardic reflexes. Figure 2 shows a typical response of SBP and HR to a single bolus injection of SNP.
To compare the performance of the pro-posed method (PRM) with the traditional method (TDM) employed by seven research-ers from our laboratory, 43 files with brady-cardic responses to PHE infusions and 61 files with tachycardic responses to SNP infusions were analyzed. Instructions on how to use the PRM were provided to all users.
Baroreflex sensitivity indexes were cal-culated for both methods as described in Equation 1, but the values inserted in this equation depend on which method was em-ployed by the user. The TDM consists of calculating average values for BP and HR and then choosing the respective values to be
included in the baroreflex index formula. Five of the seven users (USER1 to USER5) calculated mean values from six BP and HR events, one used single values (USER7), and another one used four events (USER6). To avoid any possible bias, the study was per-formed as a blind analysis, i.e., each original file had two different codes to be analyzed by each method, so the user had no previous knowledge about the results of a specific reflex obtained by one method when analyz-ing it with the other method. There was also no information concerning the dose of PHE or SNP injected. To perform analysis with the PRM, files were presented in binary format to be processed in Matlab. Files to be analyzed by the TDM were presented as HR and SBP time series on Excel (Microsoft, Version 97) worksheets, this being the com-mon software employed by all users to quan-tify cardiovascular reflexes induced by the vasoactive drug method. A total of 104 estimates of baroreflex sensitivity from each of the seven users were pooled for the TDM
and PRM and mean values for each reflex index were computed. Dispersion among users for each reflex was calculated as the standard deviation and the coefficient of variation of the mean among the seven values obtained for each index.
To confirm that the PRM may be appli-cable to data obtained from rats with de-pressed baroreflex function, reflex brady-cardia was assessed by one of the authors in a group of 11 files from sinoaortic de-nervated (SAD) rats (7) during PHE infu-sions.
Statistical analysis
Data are reported as mean ± SD brady-cardic and tachybrady-cardic indexes and were analyzed for dispersion among users. Differ-ences in baroreflex index, the standard devia-tion and the coefficient of variadevia-tion among seven users for reflex bradycardia and reflex tachycardia obtained by the TDM and PRM were determined by the paired t-test. A P value less than 0.05 was considered signifi-cant. Linear regression analysis was calcu-lated using the TDM values as the independ-ent variable and the paired PRM values as the dependent variable for reflex bradycardia and tachycardia and the Pearson product moment correlation was computed. Differ-ences in absolute values obtained from dif-ferent methods are expected to be observed even if these two measurements show high correlation coefficients. However, in method comparison, what matters is the amount by which two methods disagree and if such disagreement is enough to cause a problem in the interpretation of physiological data (10). In the present study, agreement between methods was assessed by Bland and Altman plots (10,11). Briefly, an average value is obtained from the two methods and the difference between them is calculated. The individual difference between methods is subtracted from the mean value of all differ-ences and plotted against the average value
for each index. The limits of agreement were calculated and also plotted.
Results
The results obtained with the PRM showed higher values for reflex bradycardia when compared to the TDM (PRM = -1.88 ± 0.89
vs TDM = -1.72 ± 0.71 bpm/mmHg, P =
0.005) but did not differ between the two methods for reflex tachycardia (PRM = 3.43 ± 1.42 vs TDM = 3.33 ± 1.32 bpm/mmHg, P = 0.144). Dispersion among users as measured by the standard deviation was higher when the TDM was used for both reflex bradycardia (PRM = 0.21 ± 0.26 vs
TDM = 0.60 ± 0.46 bpm/mmHg, P < 0.001) and reflex tachycardia (PRM = 0.28 ± 0.28
vs TDM = 0.83 ± 0.62 bpm/mmHg, P <
0.001). Dispersion measured by the coeffi-cient of variation showed similar results for both reflex bradycardia (PRM = 12.10 ± 16.10 vs TDM = 37.22 ± 25.76%, P < 0.001)
and reflex tachycardia (PRM = 10.14 ± 13.57 vs TDM = 26.54 ± 18.03%, P <
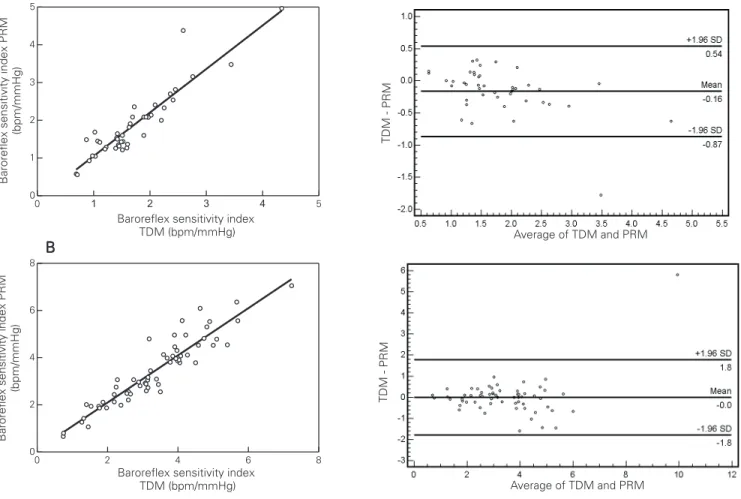
0.001). For reflex bradycardia, data ranged from -0.69 to -4.34 bpm/mmHg for the TDM and from -0.56 to -4.97 bpm/mmHg for the PRM. For reflex tachycardia, data ranged from 0.74 to 7.23 bpm/mmHg for the TDM and from 0.66 to 7.06 bpm/mmHg for the PRM. Pearson’s product moment corre-lation showed high correcorre-lation between meth-ods for reflex bradycardia (0.95) and tachy-cardia (0.89). When the PRM was used to test baroreflex function in SAD rats, the baroreflex index for reflex bradycardia ob-served was only of -0.10 bpm/mmHg on average.
differences between them. The middle hori-zontal line represents the mean difference (Mean) of the methods and the upper (+1.96 SD) and lower (-1.96 SD) lines define the limits of agreement. All differences (circles) from the Mean are distributed around this
midline, almost all inside the limits of agree-ment. More than 99% of the differences were inside the limits of agreement.
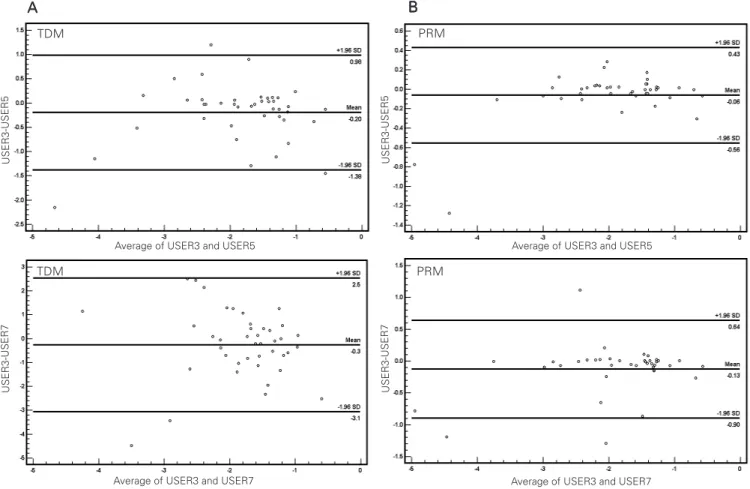
Individual results were also compared for TDM and PRM in a user-to-user manner. Figure 4 shows comparisons between two users, USER3 and USER5, who used a common criterion to select parameters for reflex bradycardia calculations (see Material and Methods for details). Bland and Altman
plots for USER3-USER5 for TDM (Figure 4A, upper panel) and for PRM (Figure 4B, upper panel) clearly show greater dispersion and wider limits of agreement when TDM is used (-1.38 to 0.98) compared to PRM (-0.56 to 0.43). Similar results were obtained when USER3 and USER7, who used a differ-ent selection criterion, were compared for TDM (Figure 4A, lower panel) and for PRM (Figure 4B, lower panel), showing greater limits of agreement for TDM (3.1 to 2.50) compared to PRM (-0.90 to 0.64). The same pattern was observed when results from all users were combined in pairs, showing that the PRM increased agreement and reduced dispersion, regardless of the criterion used
Figure 3. Regression analysis (left panels) and Bland and Altman plots (right panels) for reflex bradycardia indexes after phenylephrine bolus infusions (A) and for reflex tachycardia indexes after sodium nitroprusside bolus infusions (B). The average values from the PRM and TDM are presented on the abscissa and the ordinates show the differences between the two methods against a mean difference (Mean, middle horizontal line). Upper (+1.96 SD) and lower (-1.96 SD) limits of agreement are shown as horizontal lines. Circles represent the differences between methods subtracted from a mean (Mean) difference. PRM = proposed method; TDM = traditional method.
A A A A A
for data collection.
Discussion
Filtered signals and mean values may describe the same physiological condition, but the choice of the moment as well as the selection of the number of events to calculate mean values may be crucial and user-depen-dent, and difficult to reproduce by others. The differences observed here between the TDM and the PRM could be attributed to subjective selection of the number of events for signal averaging and/or the specific event chosen for baroreflex sensitivity index
cal-culation. The PRM avoids this interference since the observer defines only periods for analysis, and the routine calculates the values of the parameters within this time window. The importance of the use of the present tool is that, independently of previous experi-ence, one can obtain the correct values of peak changes in SBP and HR.
Another advantage of this tool is that the cut-off frequency of the filter employed is below the respiratory frequency usually found in rats, eliminating the intrinsic variability of BP and HR due to respiratory modulation, which may contribute to the higher interobserver variability when using the traditional method.
Figure 4. Bland and Altman plots for reflex bradycardia indexes after phenylephrine bolus infusions between USER3 and USER5, who had a common criterion for data collection and calculations for the TDM (A, upper panel) and the same users when using the PRM (B, upper panel). Comparison between USER3 and USER7, who had different criteria for data collection and calculations for the TDM (A, lower panel) and the same users when using the PRM (B, lower panel). Average values between users are presented on the abscissas and the ordinates show the differences between the two users against a mean difference (Mean, middle horizontal line). Upper (+1.96 SD) and lower (-1.96 SD) limits of agreement are shown as horizontal lines. Circles represent the differences between methods subtracted from a mean (Mean) difference. Note the greater agreement and narrower limits of agreement between users when the PRM is employed. TDM = traditional method; PRM = proposed method.
TDM
TDM
PRM
PRM A
AA
This low-pass filter does not introduce any distortion in evaluating baroreflex sensitivity since the cut-off frequency is above frequen-cies at which the baroreflex could exert its main influence (12). Although there was agree-ment between the methods, the PRM showed higher values for mean reflex bradycardia and also a trend to present increasing differences against the mean of the two methods as their values increased. These observations may be partially explained by the great dispersion found when the TDM was used. Comparisons of methods to quantify the baroreflex are difficult since there is no “gold standard” or reference method described in literature to obtain the parameters used in the calculations. It was not the aim of this study to quantify the difference between methods but rather to offer a fast, robust and repeatable option.
Cardiac responses to sympathetic stimu-lation are relatively slow when compared to the cardiac response to parasympathetic stimulation (13). Indeed, significant differ-ences in gain between tachycardic and brady-cardic responses have been observed in nor-mal and pathophysiological states when the HR values are analyzed by different statistical procedures. Independently of the compari-son between different groups, the algorithm in the methodology proposed here has the flexibility to quantify possible response de-lays among groups of animals, permitting the detection, for example, of minimum SBP values after SNP injections, when the sym-pathetic system may be activated and para-sympathetic activity may be reduced (vagal withdrawal).
In the present study, Pearson’s product moment correlation showed a good correla-tion between the values of reflex bradycardia (0.95) and tachycardia (0.89) obtained by the method described here and by the tradi-tional processing methodology. Although the intermethod correlations were used to deter-mine agreement between the methods, this statistical procedure does not determine if either method is correct in absolute terms
(14). In the present study, the experimental time window as well as the number of events at a given time were chosen by a laboratory researcher trained in the field of baroreflex sensitivity. Interobserver variability was re-duced among researchers when the PRM was used and, although intraobserver vari-ability was not tested, a significant reduction in this variable might be expected as well.
Agreement was also tested in a user-to-user manner between two user-to-users employing the TDM and PRM. For the TDM, five users employed a common criterion for data col-lection and two other users employed differ-ent ones, while the PRM was the same for all of them. We may speculate that these differ-ent approaches could be the reason for the greater dispersion found when the TDM was used. However, it seems that this was not the case. When individual results were com-bined and compared in pairs, dispersion was reduced and agreement improved when the PRM was used for all possible combinations between users, regardless of whether or not they had a common criterion for TDM. This strongly suggests that even when two users employ the same criterion, systematic and random errors may not be necessarily avoided. This observation reinforces the hypothesis that the PRM is superior to the TDM and may give more robust results, especially when many researchers are trying to compare quantitatively the baroreflex function from different experiments.
group showed that treatment with pyridostig-mine bromide, a reversible cholinesterase in-hibitor, increased baroreflex sensitivity in rats (15). These results suggest that the PRM has the power to identify different pathophysi-ological conditions.
Although in this study changes in BP were induced by bolus injection of vasoac-tive drugs, the present method can be used to detect changes in BP and HR produced not only by bolus injection but also by steady-state and ramp infusion (4). The developed routine is available for researchers interested in baroreflex control of the circulation and, since it can be easily modified, investigators can adjust it according to different experi-mental protocols for cardiovascular research in both animal or human studies.
In conclusion, to evaluate the sensitivity of the baroreflex control of HR in normal and pathophysiological states, independently of the statistical method used to compare the
groups and of the way BP is changed, the correct determination of BP peak changes and associated HR peak responses is crucial to determine changes in HR autonomic con-trol. The proposed method avoids the intrin-sic signal variability induced by respiration and the interobserver variability while pre-serving the oscillatory pattern of the barore-flex arch. The present study has proposed this easy-to-use semi-automatic routine to quantify hemodynamic changes and to stan-dardize baroreflex sensitivity analysis.
Acknowledgments
We thank our colleagues Rogério Wichi, Fumio Ida, Raquel De La Fuente, Rodrigo Plenz, Angela Hartmmann, Patrícia Fiorino, and Alexandre Ceroni from the Unidade de Hipertensão - Instituto do Coração (InCor-FMUSP) who devoted their time to the anal-ysis of many files.
References
1. La Rovere MT, Pinna GD, Hohnloser SH et al. (2001). Baroreflex sensitivity and heart rate variability in the identification of patients at risk for life-threatening arrhythmias: implications for clinical trials.
Circulation, 103: 2072-2077.
2. Smyth HS, Sleight P & Pickering GW (1969). Reflex regulation of arterial pressure during sleep in man. A quantitative method of assessing baroreflex sensitivity. Circulation Research, 24: 109-121. 3. Di Rienzo M, Parati G, Castiglioni P, Tordi R, Mancia G & Pedotti A (2001). Baroreflex effectiveness index: an additional measure of baroreflex control of heart rate in daily life. American Journal of
Physiology, 280: R744-R751.
4. Farah VM, Moreira ED, Pires MD, Irigoyen MC & Krieger EM (1999). Comparison of three methods for the determination of baroreflex sensitivity in conscious rats. Brazilian Journal of Medical and
Bio-logical Research, 32: 361-369.
5. Parati G, Di Rienzo M & Mancia G (2000). How to measure barore-flex sensitivity: from the cardiovascular laboratory to daily life.
Journal of Hypertension, 18: 7-19.
6. Head GA & McCarty R (1987). Vagal and sympathetic components of the heart rate range and gain of the baroreceptor-heart rate reflex in conscious rats. Journal of the Autonomic Nervous System, 21: 203-213.
7. Machado BH, Mauad H & Glass ML (1992). Transient changes in blood pressure during spontaneous deep breaths in rats with sinoaortic deafferentation. Journal of Applied Physiology, 72: 920-924.
8. Mauad H, Glass ML & Machado BH (1992). Effect of selective
denervation of baroreceptors on pulmonary ventilation and arterial pressure lability in rat. Hypertension, 19 (Suppl): II-182-II-186. 9. Perlini S, Giangregorio F, Coco M, Radaelli A, Solda PL, Bernardi L
& Ferrari AU (1995). Autonomic and ventilatory components of heart rate and blood pressure variability in freely behaving rats.
American Journal of Physiology, 269 (Part 2): H1729-H1734.
10. Bland JM & Altman DG (1986). Statistical methods for assessing agreement between two methods of clinical measurement. Lan-cet, 1: 307-310.
11. Bland JM & Altman DG (1999). Measuring agreement in method comparison studies. Statistical Methods in Medical Research, 8: 135-160.
12. Di Rienzo M, Castiglioni P, Parati G, Mancia G & Pedotti A (1996). Effects of sino-aortic denervation on spectral characteristics of blood pressure and pulse interval variability: a wide-band approach.
Medical and Biological Engineering and Computing, 34: 133-141.
13. Salata JJ & Zipes DP (1991). Autonomic nervous system control of heart rate and atrioventricular nodal conduction. In: Zucker IH & Gilmore JP (Editors), Reflex Control of Circulation. CRC Press, Boston, MA, USA, 69-104.
14. Hopp FA, Seagard JL & Kampine JP (1986). Comparison of four methods of averaging nerve activity. American Journal of Physiolo-gy, 251 (Part 2): R700-R711.
15. Soares PPS, Nóbrega ACL, Ushizima MR & Irigoyen MCC (2004). Cholinergic stimulation with pyridostigmine increases heart rate variability and baroreflex sensitivity in rats. Autonomic