Finge rprinting o f ce ll line s by dire cte d
amplificatio n o f minisate llite -re gio n
D NA (D AMD )
Centro de Pesquisa e Desenvolvimento, Fundação Ezequiel Dias (FUNED), Belo Horizonte, MG, Brasil
L.M. Silva, H. Montes de O ca, C.R. Diniz and C.L. Fortes-Dias
Abstract
The development of in vitro propagation of cells has been an extraor-dinary technical advance for several biological studies. The correct identification of the cell line used, however, is crucial, as a mistaken identity or the presence of another contaminating cell may lead to invalid and/or erroneous conclusions. We report here the application of a DNA fingerprinting procedure (directed amplification of minisatellite-region DNA), developed by Heath et al. [Nucleic Acids Research (1993) 21: 5782-5785], to the characterization of cell lines.
Genomic DNA of cells in culture was extracted and amplified by PCR in the presence of VNTR core sequences, and the amplicons were separated by agarose gel electrophoresis. After image capture with a digital camera, the banding profiles obtained were analyzed using a software (AnaGel) specially developed for the storage and analysis of electrophoretic fingerprints. The fingerprints are useful for construc-tion of a data base for identificaconstruc-tion of cell lines by comparison to reference profiles as well as comparison of similar lines from different sources and periodic follow-up of cells in culture.
Co rre spo nde nce
C.L. Fortes-Dias Centro de Pesquisa e Desenvolvimento, FUNED Rua Conde Pereira Carneiro, 80 30510-010 Belo Horizonte, MG Brasil
Fax: + 55-31-3371-9432 E-mail: consuelo@ funed.mg.gov.br
†This paper is dedicated to
H. Montes de O ca, in memoriam. Research supported by FAPEMIG L.M. Silva was the recipient of an undergraduate fellowship from FAPEMIG (TEC 995/96).
Received July 19, 2001 Accepted August 14, 2001
Ke y words
·DNA fingerprinting
·DAMD
·Cell line
·Cell culture
Intro ductio n
The development of cell culture methods has been an extraordinary technical advance for several biological studies, with the great advantage of easy standardization. Never-theless, the correct identification of the cell line used is crucial, as a mistaken identity or the presence of another contaminating cell may lead to invalid and/or erroneous conclu-sions. Eventual contamination by bacteria or fungi can be easily identified by micro- or even macroscopic examination of the cul-tures, due to the high speed at which these organisms grow in the culture media. To
Distinct molecular methods, especially those based on DNA amplification by the polymerase chain reaction (PCR), have been introduced for the identification and charac-terization of organisms in general. In cases where there is no previous knowledge of the genome sequence under investigation, am-plification techniques using arbitrary prim-ers were developed (7,8). One drawback of these randomly primed reactions, soon re-corded, was the low stringency necessary for successful amplification, which could lead to non-reproducible results (9). One alterna-tive proposed to increase reproducibility was the methodology named directed amplifica-tion of minisatellite-region DNA (DAMD), based on the amplification of minisatellite or variable number of tandem repeat (VNTR) sequences at relatively high stringencies (10). We report here the application of DAMD to the characterization of cell lines available in our cell bank. Analysis and storage of the
generated DNA fingerprints were greatly fa-cilitated by data digitalization and further evaluation with a software (AnaGel) spe-cially developed for this purpose.
Mate rial and Me thods
Ce ll line s
Twenty samples of 15 distinct cell lines (Table 1) from the cell bank in our labora-tory were grown in appropriate culture me-dia, which were prepared from individual components as described (11) and sterilized by filtration through 0.22- and 0.1-µm pore membranes.
DNA extraction
A minimum of 1.0 x 10⁸ cells were used
for extraction of genomic DNA, performed with the GenomicPrep Cells and Tissue DNA
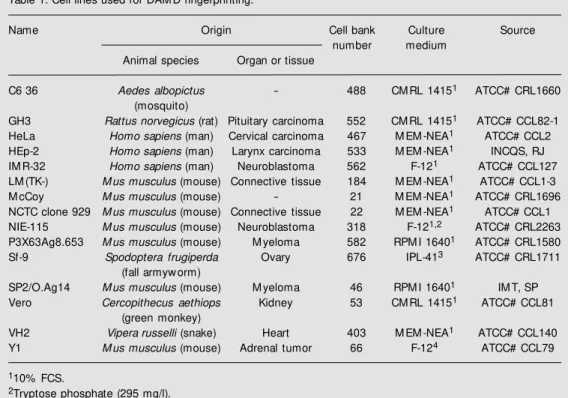
Table 1. Cell lines used for DAM D fingerprinting.
Name Origin Cell bank Culture Source
number medium
Animal species Organ or tissue
C6 36 Aedes albopictus - 488 CM RL 14151 ATCC# CRL1660
(mosquito)
GH3 Rattus norvegicus (rat) Pituitary carcinoma 552 CM RL 14151 ATCC# CCL82-1
HeLa Homo sapiens (man) Cervical carcinoma 467 M EM -NEA1 ATCC# CCL2
HEp-2 Homo sapiens (man) Larynx carcinoma 533 M EM -NEA1 INCQS, RJ
IM R-32 Homo sapiens (man) Neuroblastoma 562 F-121 ATCC# CCL127
LM (TK-) M us musculus (mouse) Connective tissue 184 M EM -NEA1 ATCC# CCL1-3
M cCoy M us musculus (mouse) - 21 M EM -NEA1 ATCC# CRL1696
NCTC clone 929 M us musculus (mouse) Connective tissue 22 M EM -NEA1 ATCC# CCL1
NIE-115 M us musculus (mouse) Neuroblastoma 318 F-121,2 ATCC# CRL2263
P3X63Ag8.653 M us musculus (mouse) M yeloma 582 RPM I 16401 ATCC# CRL1580
Sf-9 Spodoptera frugiperda Ovary 676 IPL-413 ATCC# CRL1711
(fall armyw orm)
SP2/O.Ag14 M us musculus (mouse) M yeloma 46 RPM I 16401 IM T, SP
Vero Cercopithecus aethiops Kidney 53 CM RL 14151 ATCC# CCL81
(green monkey)
VH2 Vipera russelli (snake) Heart 403 M EM -NEA1 ATCC# CCL140
Y1 M us musculus (mouse) Adrenal tumor 66 F-124 ATCC# CCL79
110% FCS.
2Tryptose phosphate (295 mg/l).
35% inactivated FCS, tryptose phosphate (295 mg/l). 415% horse serum, 2.5% FCS.
Isolation kit (Amersham Pharmacia Biotech, Uppsala, Sweden) according to manufac-turer instructions. The DNA was eluted in 100 µl of 1X TE buffer and its concentration estimated by absorbance readings at 260 and 280 nm (Gene-Quant, Amersham Pharma-cia Biotech, Uppsala, Sweden).
DNA amplification
DNA was amplified in a thermocycler (Perkin-Elmer model 2400, Foster City, CA, USA) using PCR reagents acquired from Amersham. The reaction mixture was pre-pared as follows: 10 µl PCR buffer (100 mM Tris-HCl, 500 mM KCl, 15 mM MgCl2, pH
9.0), 4.2 µl dNTPs (25 mM each), 0.75 µg primer, 6 µl (1.25 U) Taq DNA polymerase, 240 ng DNA, and ultrapure water for a total reaction volume of 60 µl. After incubation for 5 min at 94ºC, amplification was per-formed for 35 cycles of 1 min at 94ºC, 60 s at 55ºC and 90 s at 72ºC. When necessary, MgCl2 concentration was varied within
the 1.5 to 4.0 mM range. The VNTR se-quences used as primers were: INS (5’ ACA GGGGTGTGGGG 3’) and M13 (5’ GAG GGTGGNGGNTCT 3’) (10). A negative control (with no DNA) was run in all ampli-fications.
Ge l e le ctrophore sis
Twenty microliters of the amplification products was analyzed on 2% agarose gels (7 x 10 cm) in 1X TBE buffer for 60 min at 100 V, and stained with ethidium bromide. The amplified fragments were visualized under UV light. A 1-kb DNA ladder (Gibco BRL, Gaithersburg, MD, USA) was used as size marker.
Image s analysis
Gel images were digitalized using an EDA Kodak 1D system and saved as bmp files for analysis by the AnaGel software specially
developed for storage and analysis of elec-trophoretic data (12). Besides managing a generic data bank of gels and samples with traditional tools for data bank searches, the AnaGel software is able to search for simi-larity between stored records. Briefly, the images are processed after delimitation of the work area onto the gel, established by top and bottom drawing lines. The lanes to be processed are chosen and a screen form is filled with sample characteristics and run conditions. The fragment bands are normal-ized per lane according to the DNA marker on the same gel. The software allows lane comparisons and alignments within the same or two different gels, and generates a charac-teristic fingerprint that can be stored in a data bank. AnaGel software is available free at <www.sirius.cenapad.ufmg.br/anagel/ anagel.html>.
Re sults
Initially, DNA amplification of cell lines was performed in the presence of 1.5 mM
1.5 1.52.02.53.03.54.0
M 1 2 3 M 4 M
1.5 1.5 2.0 2.5 3.0 3.5 4.0
A B
C D
M
5 6 7 M 8 M
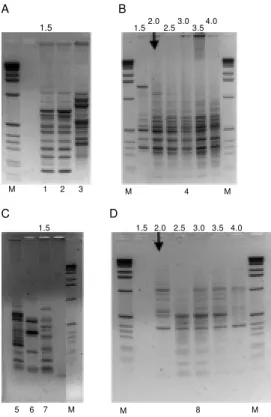
Figure 1. DNA fingerprints ob-tained for cell lines after DNA amplification w ith primers INS (A and B) and M 13 (C and D). Top of the gels, Concentration of M gCl2 (mM ) in the amplification
reaction. The arrow points to the concent rat ion of m agnesium used as the standard for DNA amplification of these cells. Lane M, 1-kb ladder; lane 1, HeLa;
lane 2, HEp-2; lane 3, M cCoy;
lane 4, NIE-115; lane 5, M cCoy;
MgCl2, with both primers. The profiles
ob-tained for seven cell lines are shown in Fig-ure 1. Similar electrophoretic profiles were obtained for distinct cell lines, as shown for HeLa and HEp-2 (Figure 1A). When ampli-fication was unsatisfactory or the number of analyzable fragments in the profile was low, a curve of magnesium concentration up to 4.0 mM was constructed in an attempt to improve the fingerprint. These magnesium curves are shown in Figure 1B and 1D for NIE-115 and VH2, with primers INS and M13, respectively. The ideal concentration of MgCl2 in the amplification reaction was
established for each cell line and primer and the results are summarized in Table 2.
Figure 2 illustrates the alignment of two fingerprints of the same cell line from inde-pendent amplifications after AnaGel pro-cessing. A straight line indicates a perfect alignment between two fingerprints. Similar electrophoretic profiles for distinct cell lines were aligned and confirmed to be identical for NCTC clone 929 and Y1, SP2/O.Ag14 and P3X63Ag8.653, HeLa and HEp-2, re-spectively, with both primers (Figure 3).
D iscussio n
DNA fingerprinting is now a well-estab-lished method to identify individuals posi-tively and has been found to be also suitable for the authentication of cell lines (for a review, see 13). In the latter case, the main motivation for the preparation of DNA fin-gerprints is to determine whether lines are the same or not, i.e., line contamination (13). The procedure used here has been devel-oped to direct PCR amplification to regions rich in VNTR (10). According to the authors who developed DAMD, one should expect differences in the fragments amplified be-tween species but little variation within a species. In our case, 15 cell lines from seven animal species were tested (Table 1). Among the three cell lines of human origin (HeLa, HEp-2 and IMR-32), only two gave similar Figure 2. Comparison of
electro-phoretic profiles and curve align-ments of DNA fingerprints ob-tained in independent experi-ments using AnaGel. A, GH3 cell line am plif ied w it h M 13; B, NCTC clone 929 cell line ampli-fied w ith INS.
Table 2. Optimal magnesium concentrations (mM ) used in the DNA amplification reaction for differ-ent cell lines.
Cell line Primer
M 13 INS
C6 36 1.5 2.0
GH3 1.5 1.5
HeLa 1.5 1.5
HEp-2 1.5 1.5
IM R-32 1.5 1.5
LM (TK-) 1.5 4.0
M cCoy 1.5 1.5
NCTC clone 929 1.5 1.5
NIE-115 1.5 2.0
P3X63Ag8.653 1.5 1.5
Sf-9 1.5 4.0
SP2/O.Ag14 1.5 1.5
Vero 1.5 2.5
VH2 2.0 3.0
Y1 1.5 1.5
A
A
B
C
Figure 3. Identical AnaGel pro-files generated from DNA finger-prints of distinct cell lines (prim-ers M 13 and INS). Cell lines: A, Y1 and NCTC clone 929; B, SP2/ O.Ag14 and P3X63Ag8.653; C, HeLa and HEp-2.
fingerprints (HeLa and HEp-2). This fact is in agreement with a previous study in which virtually identical DNA fingerprints were obtained for these lines using minisatellite probes for hypervariable genetic loci (6). According to the authors, it appears that a number of cell lines, including HEp-2, were contaminated with HeLa early in their
his-tory and that the cultures subsequently de-posited with the American Type Culture Collection (ATCC) for distribution were sim-ply HeLa lines. Even prolonged culturing under a variety of conditions and the mainte-nance of these derivative cell lines as sepa-rate cultures did not change the DNA finger-print, demonstrating its stability and
table character, even after continuous in vi-tro passages.
Four of seven cell lines from the mice tested gave very similar profiles: P3X63 Ag8.653 and SP2/O.Ag14, Y1 and NCTC clone 929. The fingerprints were compared in pairs with a perfect alignment (Figure 3). Unfortunately, AnaGel does not compare more than two images at a time when they come from different gels. For other cell lines from mice tested here, distinct profiles were obtained and the question remains whether or not the similarity observed in the first case would be due to the fact that they came from the same animal species.
DAMD is a simple and easy method to
perform and the fingerprints could be used in the construction of a data base for cell line control. Availability of this base to laborato-ries involved in cell culturing would allow easy identification of individual lines by parison to reference profiles as well as com-parison of similar lines from different sources and periodic follow-up of cells in culture.
Ackno wle dgm e nts
We are grateful to O.S.F. Carvalho and E.Q. Moreira, Department of Computer Sci-ence, UFMG, for valuable help with the AnaGel software.
Re fe re nce s
1. Chen TR (1977). In situ demonstration of mycoplasma contamination in cell cul-tures by fluorescent Hoechst 33258 stain.
Experimental Cell Research, 104: 255-262.
2. Barile M F (1979). M ycoplasma-tissue cell interactions. In: Tully JG & Whitcomb RF (Editors), The M ycoplasmas. Vol. II. Aca-demic Press, New York, NY, USA. 3. Wong-Lee JG & Lovett M (1993). Rapid
and sensitive PCR method for identifica-tion of M ycoplasma species in tissue cul-ture. In: Persing DH, Smith TF, Tenover FC & White TJ (Editors), Diagnostic M o-lecular M icrobiology. Principles and Appli-cations. American Society for M icrobiol-ogy, Washington DC, USA.
4. Gartler SM (1967). Genetic markers as tracers in cell culture. Second Decennial Review Conference on Cell Tissue and Organ Culture. National Cancer Institute
M onograph, 26: 167-195.
5. Gartler SM (1968). Apparent HeLa cell contamination of human heteroploid cell lines. Nature, 217: 750-751.
6. Gilbert DA, Reid YA, Gail M H, Pee D, White C, Hay RJ & O’Brien SJ (1990). Application of DNA fingerprints for cell line individualization. American Journal of Human Genetics, 47: 499-514.
7. Welsh J & M cClelland M (1990). Finger-printing genomes using PCR w ith arbi-trary primers. Nucleic Acids Research, 18: 7213-7218.
8. Williams JG, Kubelik AR, Livak KJ, Rafalski JA & Tingey SV (1990). DNA polymor-phisms amplified by arbitrary primers as useful genetic markers. Nucleic Acids Re-search, 18: 6531-6535.
9. Riedy M F, Hamilton III WJ & Aquadro CF (1992). Excess of non-parental bands in offspring from know n primate pedigrees
assayed using RAPD PCR. Nucleic Acids Research, 25: 918-922.
10. Heath DD, Iw ama GK & Devlin RH (1993). PCR primed w ith VNTR core sequences yields species specific patterns and hy-pervariable probes. Nucleic Acids Re-search, 21: 5782-5785.
11. M orton HJ (1970). A survey of commer-cially available tissue culture media. In Vi-tro, 6: 89-108.
12. Pimenta M LA (1996). AnaGel: um sistema de análise de registros eletroforéticos. M aster thesis, Department of Computer Science, Federal University of M inas Gerais, Belo Horizonte, M G, Brazil. 13. Webb M BT & Debenham PG (1992). Cell