Agro-morphological characterization of upland rice accessions
Wellington Ferreira do Nascimento
1, Edson Ferreira da Silva
2, Elizabeth Ann Veasey
3*
–1USP/ESALQ – Programa de Pós-Graduação em Genética e Melhoramento de Plantas, Piracicaba, SP – Brasil. 2UFRPE – Depto. de Biologia, Av. Dom Manoel de Medeiros – 52171-900 – Recife, PE – Brasil.
3USP/ESALQ – Depto. de Genética, C.P. 83 – 13400-970 – Piracicaba, SP – Brasil. *Corresponding author <eaveasey@esalq.usp.br>
Edited By: Leonardo Oliveira Medici
Introduction
Agro-morphological characterization of germplasm acces-sions is fundamental in order to provide information for plant breeding programs (Lin, 1991). Several researchers reported the use of agro-morphological markers in the characterization and study of rice (Oryza sativa L.) germplasm diversity. Li et al. (2000) obtained consistent results analyzing the correlation between genetic and morphological differentiation in 111 ac-cessions of rice from the Japonica and Indica groups. Yawen et al. (2003) studied the genetic diversity on 5285 accessions of indigenous rice in China and found considerable morphologi-cal variation among accessions. In India, Patra and Dhua (2003) analyzed the agro-morphological diversity of upland rice and in Vietnam, Fukuoka et al. (2006) assessed the variability in agronomic characters among landraces of aromatic rice popula-tions. Using 42 agro-morphological characters associated with 39 SSR markers, Bajracharya et al. (2006) examined the genetic relationships among 147 high altitude rice landraces from Jumla, Nepal. Seetharam et al. (2009) characterized 30 rice genotypes comprising landraces, pure lines, somaclones, breeding lines and varieties specifically adapted to costal saline environments using SSR markers and morphological characters. Yibo et al. (2010) investigated morphological and genetic diversity in 11 surviving populations of O. rufipogon Griff. from Hainan Island, China, and reported a clear morphological differentiation among or within populations.
This type of characterization has also been used on wild species in Brazil. Rosa et al. (2006) characterized eight populations of O. glumaepatula Steud. collected in different hydrographic basins and Veasey et al. (2008) analyzed the genetic variability among the four
wild rice species occurring in South America, reporting agro-mor-phological variation for O. glumaepatula, followed by O. latifolia.
The aim of the present study was to characterize 146 upland rice genotypes using agro-morphological characters and to pro-vide useful information to facilitate the choice of genitors for rice plant breeding programs.
Materials and Methods
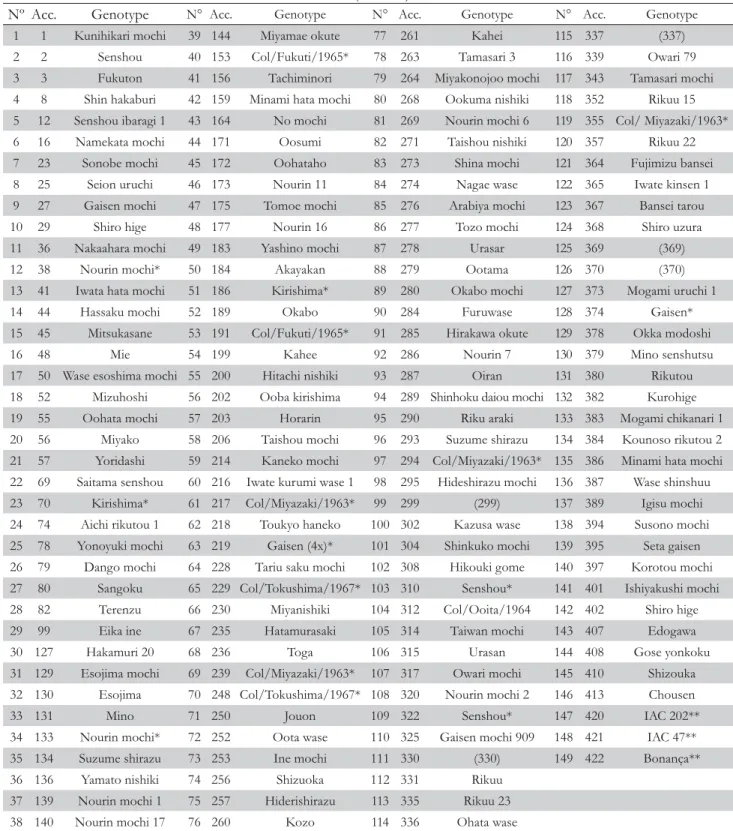
One hundred and forty-six accessions of upland rice were assessed in this study (Table 1). Three Brazilian cultivars were used as controls: IAC 202, IAC 47 and Bonança.
The experiment was carried out in Recife, state of Pernam-buco in northeast Brazil, (08°01’ S; 34°56’ W - 10.3 m altitude), from March to July 2007, during the agricultural year in the region. The mean temperature during the experiment was 23.8 °C and the index annual rainfall was 1.193 mm.
Seeds were germinated in polystyrenetrays with a substrate composed of Pinus husk, vermiculite, fine peat, macro and micro-nutrients. Twenty-eight days after emergence, the most vigorous seedlings of each genotype were transplanted to the field, follow-ing the procedure reported by Villela and Furlani Júnior (1996). The statistical experiment design was a randomized block with three replicates. Each plot consisted of a row of six plants spaced 0.15 m apart, with the rows spaced 0.40 m apart.
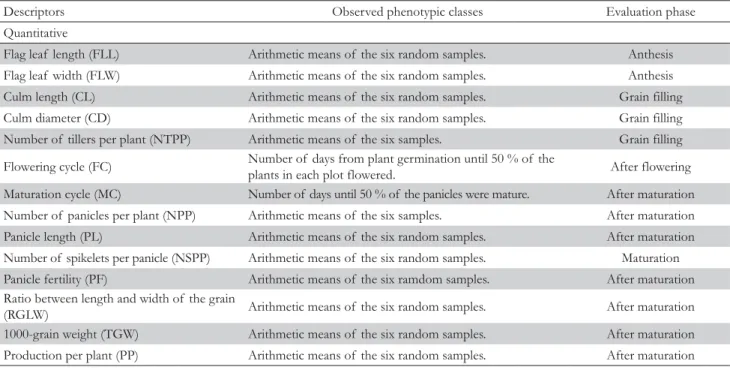
The accessions were characterizated according to descriptors established by the International Rice Research Institute and the International Board for Plant Genetic Resources (IRRI, 1980). A total of 14 qualitative (Table 2) and 14 quantitative descriptors (Table 3) were used. The qualitative descriptors were: leaf color (LC), leaf pubescence (LP), lodging resistance (LR), internode ABSTRACT: The agro-morphological characterization is fundamental in order to provide information for plant
breeding programs. The aim of the present study was to characterize 146 accessions of upland rice (Oryza sativa L.), based on qualitative and quantitative agro-morphological descriptors. The experiment was conducted in Recife, state of Pernambuco, Brazil, using a randomized block design with three replicates. Polymorphism was observed among 12 of 14 qualitative characters evaluated, whereas significant differences (p < 0.05) were observed for 11 of the 14 analysed quantitative traits. Genetic variance was higher than environmental variance and the average inheritability coefficients were above 80 % for all characters, which ensures the predominance of the genetic components in the differences observed among accessions. On the cluster analysis for qualitative traits the accessions were classified in two groups with a total of 18 duplicates, whereas for the quantitative traits three groups were obtained with few subgroups. The principal component analysis for quantitative traits showed great dispersion of the accessions. The most divergent group of accessions included the genotypes Mitsukasane, Mie, Tomoe mochi, Ooba kirishima and Nourin mochi 6, which showed a higher number of spicklets per plant. There is high variability among the rice accessions from the germplasm collection studied, which presents great importance for breeding programs or for genetic studies on this species.
Table 1 – List of accessions of upland rice from Japan from the germplasm collection of Universidade Federal Rural de Pernambuco - UFRPE and the Brazilian cultivars (controls) studied.
Nº Acc. Genotype N° Acc. Genotype N° Acc. Genotype N° Acc. Genotype
1 1 Kunihikari mochi 39 144 Miyamae okute 77 261 Kahei 115 337 (337)
2 2 Senshou 40 153 Col/Fukuti/1965* 78 263 Tamasari 3 116 339 Owari 79
3 3 Fukuton 41 156 Tachiminori 79 264 Miyakonojoo mochi 117 343 Tamasari mochi
4 8 Shin hakaburi 42 159 Minami hata mochi 80 268 Ookuma nishiki 118 352 Rikuu 15
5 12 Senshou ibaragi 1 43 164 No mochi 81 269 Nourin mochi 6 119 355 Col/ Miyazaki/1963*
6 16 Namekata mochi 44 171 Oosumi 82 271 Taishou nishiki 120 357 Rikuu 22
7 23 Sonobe mochi 45 172 Oohataho 83 273 Shina mochi 121 364 Fujimizu bansei
8 25 Seion uruchi 46 173 Nourin 11 84 274 Nagae wase 122 365 Iwate kinsen 1
9 27 Gaisen mochi 47 175 Tomoe mochi 85 276 Arabiya mochi 123 367 Bansei tarou
10 29 Shiro hige 48 177 Nourin 16 86 277 Tozo mochi 124 368 Shiro uzura
11 36 Nakaahara mochi 49 183 Yashino mochi 87 278 Urasar 125 369 (369)
12 38 Nourin mochi* 50 184 Akayakan 88 279 Ootama 126 370 (370)
13 41 Iwata hata mochi 51 186 Kirishima* 89 280 Okabo mochi 127 373 Mogami uruchi 1
14 44 Hassaku mochi 52 189 Okabo 90 284 Furuwase 128 374 Gaisen*
15 45 Mitsukasane 53 191 Col/Fukuti/1965* 91 285 Hirakawa okute 129 378 Okka modoshi
16 48 Mie 54 199 Kahee 92 286 Nourin 7 130 379 Mino senshutsu
17 50 Wase esoshima mochi 55 200 Hitachi nishiki 93 287 Oiran 131 380 Rikutou
18 52 Mizuhoshi 56 202 Ooba kirishima 94 289 Shinhoku daiou mochi 132 382 Kurohige
19 55 Oohata mochi 57 203 Horarin 95 290 Riku araki 133 383 Mogami chikanari 1
20 56 Miyako 58 206 Taishou mochi 96 293 Suzume shirazu 134 384 Kounoso rikutou 2
21 57 Yoridashi 59 214 Kaneko mochi 97 294 Col/Miyazaki/1963* 135 386 Minami hata mochi
22 69 Saitama senshou 60 216 Iwate kurumi wase 1 98 295 Hideshirazu mochi 136 387 Wase shinshuu
23 70 Kirishima* 61 217 Col/Miyazaki/1963* 99 299 (299) 137 389 Igisu mochi
24 74 Aichi rikutou 1 62 218 Toukyo haneko 100 302 Kazusa wase 138 394 Susono mochi
25 78 Yonoyuki mochi 63 219 Gaisen (4x)* 101 304 Shinkuko mochi 139 395 Seta gaisen
26 79 Dango mochi 64 228 Tariu saku mochi 102 308 Hikouki gome 140 397 Korotou mochi
27 80 Sangoku 65 229 Col/Tokushima/1967* 103 310 Senshou* 141 401 Ishiyakushi mochi
28 82 Terenzu 66 230 Miyanishiki 104 312 Col/Ooita/1964 142 402 Shiro hige
29 99 Eika ine 67 235 Hatamurasaki 105 314 Taiwan mochi 143 407 Edogawa
30 127 Hakamuri 20 68 236 Toga 106 315 Urasan 144 408 Gose yonkoku
31 129 Esojima mochi 69 239 Col/Miyazaki/1963* 107 317 Owari mochi 145 410 Shizouka
32 130 Esojima 70 248 Col/Tokushima/1967* 108 320 Nourin mochi 2 146 413 Chousen
33 131 Mino 71 250 Jouon 109 322 Senshou* 147 420 IAC 202**
34 133 Nourin mochi* 72 252 Oota wase 110 325 Gaisen mochi 909 148 421 IAC 47**
35 134 Suzume shirazu 73 253 Ine mochi 111 330 (330) 149 422 Bonança**
36 136 Yamato nishiki 74 256 Shizuoka 112 331 Rikuu
37 139 Nourin mochi 1 75 257 Hiderishirazu 113 335 Rikuu 23
38 140 Nourin mochi 17 76 260 Kozo 114 336 Ohata wase
Acc. – Accessions; *Different accessions with the same name; **Controls.
color (IC), stigma color (SC), presence and distribution of awn per panicle (PDAP), apiculus and/or awn color (AAC), lemma and palea color (LPC), glumella pubescence (GP), panicle type (PT), threshability (Th), seed coat color (SCC), endosperm type (ET), and grain shape (GS). The quantitative descriptors were: flag leaf length (FLL), flag leaf width (FLW), culm length (CL),
Table 2 – Qualitative descriptors used to evaluate 146 upland rice accessions from Japan and three Brazilian cultivars (controls).
Descriptors Observed phenotypic classes Evaluation phase
Qualitative
Leaf color (LC) 1 - light green; 2 - green; 3 - dark green; 4 – purple. Early flowering
Leaf pubescence (LP) 1 - glabrous; 2 - intermediate; 3 - pubescent. Early flowering
Lodging resistance (LR) 1 - absent; 2 - plants with moderate lodging; 3 - plants strongly lodged. After maturation
Internode color (IC) 1 - green; 2 - gilded; 3 - purple; 4 - purple stripes. Grain filling
Stigma color (SC) 1 - white; 2 - light green; 3 - yellow; 4 - purple. Flowering
Presence/distribution of awn
per panicle (PDAP) 1 - absent; 2 - awns on panicle extremity; 3 - awns throughout the panicle. After grain filling Apiculus and/or awn color
(AAC) 1 - straw color; 2 - gilded; 3 - red; 4 - purple; 5 - brown; 6 - green; 7 - black. After grain filling
Lemma and palea color (LPC) 1 - straw color; 2 - gilded or with gilded lines; 3 - straw color with brown stains; 4 -
brown; 5 - reddish; 6 - straw color with purple lines; 7 - purple; 8 - black; 9 - white. Maturation
Glumella pubescence (GP) 1 - absent/very weak; 2 - present. Flowering
Panicle type (PT) 1 - grouped; 2 - intermediate; 3 - open. Maturation
Threshability (Th)
1 - difficult (less than 25 % of the grains were removed); 2 – intermediate (from 25 % to 50 % of the grains were removed); 3 – easy (more than 50 % of the grains were removed).
After maturation
Seed coat color (SCC) 1 - white; 2 - light brown; 3 - brown; 4 - red; 5 - purple. After maturation
Endosperm type (ET) 1 - non-glutinous; 2 - intermediate; 3 - glutinous. After maturation
Grain shape (GS)
1 – round (length/width ratio was less than 1.50); 2 - semi-round (ratio ranged from 1.50 to 2.00); 3 - semi-elongated (ratio from 2.01 to 2.75); 4 – elongated (ratio from 2.76 to 3.50); 5 - very elongated (ratio larger than 3.50).
After maturation
Table 3 – Quantitative descriptors used to evaluate 146 upland rice accessions from Japan and three Brazilian cultivars (controls).
Descriptors Observed phenotypic classes Evaluation phase
Quantitative
Flag leaf length (FLL) Arithmetic means of the six random samples. Anthesis
Flag leaf width (FLW) Arithmetic means of the six random samples. Anthesis
Culm length (CL) Arithmetic means of the six random samples. Grain filling
Culm diameter (CD) Arithmetic means of the six random samples. Grain filling
Number of tillers per plant (NTPP) Arithmetic means of the six samples. Grain filling
Flowering cycle (FC) Number of days from plant germination until 50 % of the
plants in each plot flowered. After flowering
Maturation cycle (MC) Number of days until 50 % of the panicles were mature. After maturation
Number of panicles per plant (NPP) Arithmetic means of the six samples. After maturation
Panicle length (PL) Arithmetic means of the six random samples. After maturation
Number of spikelets per panicle (NSPP) Arithmetic means of the six random samples. Maturation
Panicle fertility (PF) Arithmetic means of the six ramdom samples. After maturation
Ratio between length and width of the grain
(RGLW) Arithmetic means of the six random samples. After maturation
1000-grain weight (TGW) Arithmetic means of the six random samples. After maturation
Production per plant (PP) Arithmetic means of the six random samples. After maturation
For the quantitative characters the statistical analyses were performed using the F test and in order to group the accessions, the Scott and Knott (1974) test was used. Statistical significance was set at 5 % (p < 0.05) and the GENES software was used for all tests (Cruz, 2006). The software PAST (Hammer et al., 2001) was used for the cluster and principal component analyses. Qualitative and quantitative traits data were analyzed separately.
The qualitative traits were transformed into binary data consid-ering the presence or absence (1/0) of each character state. The Jaccard similarity coefficient was estimated for qualitative traits,
Results and Discussion
Polymorphism was found in 12 of the 14 qualitative traits studied; the non-polymorphic traits were the internode color (light green) and panicle type (intermediate). Panicle type (PT) is generally affected by water deficiency before flowering, because this condition changes the angle of the panicle branches and the density of the grains (Bonow et al., 2007). Internode color (IC) often shows variation on color tonality depending on the age of the plants and the soil fertility conditions. Plants usually present a dark green tonality on high soil fertility and a light green one on low soil fertility (Fonseca et al., 2002), which agrees with the soil type used in this study, a franc-clay and low fertility one.
For the traits stigma color (SC) and glumella pubescence (GP), two alternative forms or types were observed. White (65 %) and purple (35 %) genotypes were observed for SC, while presence (76 %) and absence (24 %) of the pubescence were found in GP. Veasey et al. (2008) reported variation within and among populations of O. glumaepatula for stigma color, with three populations 100 % white, four populations 100 % purple, and the others with varying degrees for each color, while white was the only color found on the other South American wild rice species (O. latifolia, O. grandiglumis and O. alta).
The characters showing higher variability were leaf pubes-cence (74 % pubescent, 20 % glabrous and 6 % intermediate), lodging resistance (37.5 % absent, 37.5 % few lodged and 25 % moderate), presence and distribution of awn per panicle (PDAP) (55 % absent, 23 % present only at the end of the panicle and 22 % present on all panicle), threshability (73 % easy threshability, 21 % intermediate and 6 % difficult), endosperm
type (31 % glutinous endosperm, 42 % intermediate and 27 % not glutinous), and grain shape (74 % semi-long, 20 % long, 5 % tightly long and 1 % semi-rounded grain shape). The grain shape character also showed the highest variation in studies conducted in Pakistan by Siddiqui et al. (2007). Although this character is mentioned as qualitative, its evaluation is carried out as a quantitative trait, according to the grain dimentions. The major variation observed was probably due to polygene action and the influence of environmental causes. In relation to PDAP, while the awn is present its length should be influenced by the soil fertilization and plant density (Fonseca et al., 2002). Studies carried by Bisne and Sarawgi (2008) to characterize 32 aromatic rice accessions of Badshah Bhog group from IGKV, Raipur, Chhattisgarh germplasm, found the highest variation among ac-cessions for the traits leaf blade colour, lemma and palea colour, apiculus colour, and lemma and palea pubescence.
The cluster analysisfor the qualitative traits using the Jaccard similarity coefficient classified the accessions into two groups (Figure 1). However, the scatter graph from agro-morphological qualitative traits obtained by principal components showed that the accessions did not form distinct groups, with a wide dis-persion among the accessions (Figure 2). The first and second components represented 21.1 % and 11.5 % of total variation observed among accessions, respectively. A total of 18 dupli-cates were found in the cluster analysis (Figure 1), including the following accessions: 14-125, 5-8, 44-128, 27-28, 25-83, 133-142, 78-144, 51-109-118-138, 61-91, 33-48, 85-104, 110-111-112, 89-101-132, 65-77-78-87-120-121-140, 143-145, 8-10-39-49, 7-102 and 88-105. None of these duplicates included accessions with the same genotype name. However, Fukuoka et al. (2006), in
studies with aromatic rice landraces, concluded that significant variation may be found among genotypes with the same name.
Considering the 14 quantitative traits analyzed in this study, differences among accessions (p < 0.05) were found for 11 traits (Table 4). The non-significant traits were flag leaf width, culm diameter and the ratio culm/width of the grain. Veasey et al. (2008) also found significant differences and high variability for 11 populations of O. glumaepatula, mainly for the characters number of tillers, plant height at flowering, leaf length and width, culm length, days to heading, panicle number, panicle height, flag leaf length, spikelet length and awn length.
The coefficients of variance (CV%) showed an optimum experiment precision, with values below 11 % for all characters,
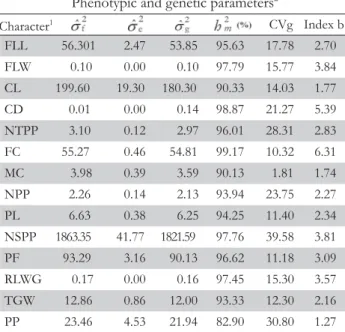
except for PPP (CV = 24.2 %). The analysis performed by Patra and Dhua (2003) had CV values below 27.1 % for all agronomic traits evaluated, except for the character number of panicles, di-rectly related to grain production, showing a CV value of 30.7. Results concerning the estimates of variance components among accessions indicate that the variance observed was due to genetic factors, as the values obtained for the b index (CVg/CVe) were above 1 for all characters (Table 5). When the b index is higher than 1, there are favorable conditions for selecting superior genotypes considering the predominance of genetic factors rather than environmental factors (Vencovsky and Barriga, 1992). The traits number of spikelets per panicle, culm length, panicle fertility, flowering cycle and flag leaf length Figure 2 – Scatter graph of 146 accessions of Japanese rice upland germplasm collection of the Universidade Federal Rural de Pernambuco -
UFRPE and cultivars (controls) used in the experiment from 14 qualitative agro-morphological traits.
Table 4 – Analysis of variance for 14 quantitative traits1
for 146 upland rice accessions from Japan and three Brazilian cultivars (controls).
Mean squares3
Sources of
variation DF FLL FLW CL CD NTPP FC MC NPP PL NSPP PF RGLW TGW PP
Replications 2 11.93 0.02 297.57 0.01 6.30 13.83 92.24 2.42 0.47 74.68 5.38 0.07 25.13 71.47
Treatments 148 168.92* 0.30ns 598.80* 0.04ns 9.29* 165.81* 11.94* 6.79* 19.88* 5590.06* 279.86* 0.50ns 38.57* 79.38*
CV (%)2 6.59 4.11 7.95 3.95 9.99 1.64 1.04 10.45 4.88 10.38 3.62 4.29 5.70 24.23
Average 41.28 1.98 95.68 0.56 6.09 71.72 104.90 6.14 21.93 107.83 84.94 2.63 28.17 15.21
1FLL-fl ag leaf length; FLW-fl ag leaf width; CL-culm length; CD-culm diameter; NTPP-number of tillers per plant; FC-fl owering cycle;
MC-maturation cycle; NPP-number of panicles per plant; PL-panicle length; NSPP-number of spikelets per panicle; PF-panicle fertility; RGLW-ratio grain length/width; TGW-1000-grain weight; PP-production per plant; DF – degrees of freedom. 2CV – coeffi cient of variation. 3*Signifi cant
showed higher genetic variance values, 1821.59, 180.30, 90.13, 54.81 and 53.85, respectively (Table 5). The estimate of the aver-age inheritability among accessions was high, over 82 % for all quantitative traits. The better prediction of the environmental component of phenotypic variance, helps the more realiable estimation of both broad and narrow sense heritability, and so the better planning program for cross and self pollinated plants improvement (Fahliani et al., 2010).
The Scott and Knott (1974) (p < 0.05) analysis allowed the formation of several groups among accessions for all characters (not shown data). The flag leaf length character classified the accessions in eight groups. The group with the highest average showed a variation from 58.2 cm (accession 121) to 64.3 cm (accession 147), while the group with the lowest average varied from 25.9 cm (accession 10) to 30.5 cm (accession 90). Eight groups were obtained for the character flag leaf width, varying from 2.52 cm (accession 6) to 2.7 cm (accession 99) for the group with higher scores and from 1.36 cm (accession 91) to 1.63 cm (accession 137) for the group with lower scores.
The culm length (CL) trait, related to plant height, classified the accessions in five groups. The higher values varied from 131.1 cm (accession 137) to 139.3 cm (accession 125), while the lower values varied from 58.5 cm (accession 127) to 86.8 cm (accession 114). The accessions presenting higher means for CL were 125 (369 – without denomination), 148 (IAC 47), 68 (Toga)
and 137 (Igisu mochi), with 139.3 cm, 132.5 cm, 132.2 cm and 131.1 cm, respectively, all considered of an intermediate height. However, 10.7 % of the accessions [25 (Yonoyuki mochi), 35 (Suzume shirazu), 58 (Taishou mochi), 59 (Kaneko mochi), 60 (Iwate kurumi wase 1), 66 (Miyanishiki), 69 (Col/Miyaza-ki/1963), 75 (Hiderishirazu), 90 (Furuwase), 100 (Kazusa wase), 103 (Senshou) and 127 (Mogami uruchi 1)] showed CL means below 80 cm, which is why they were considered semi-dwarf plants. The character culm diameter classified the accessions into 14 groups, which shows the high variability among acces-sions for this trait. The highest value was presented by accession 117 (Tamasari mochi), with 0.97 cm, followed by accessions 123 (Bansei tarou), 5 (Senshou ibaragi 1), 131 (Rikutou), 42 (Minami hata mochi), 14 (Hassaku mochi), 81 (Nourin mochi 6) and 37 (Nourin mochi 1), all with means above 0.8 cm. The group with the lower values showed a variation from 0.38 cm (accession 79) to 0.42 cm (accession 108).
Ten groups were obtained for the character number of tillers per plant, with accession 10 (Shiro hige) presenting the highest mean, 14.8 cm, followed by accessions 110 (Gaisen mochi 909), 145 (Shizuoka), 59 (Kaneko mochi), 111 (330-with-out denomination) and 87 (Urasar), with means above 10 tillers per plant. The accessions that had the lowest means for this trait varied from 3.1 (accession 11) to 4.3 (accession 99). As for the number of panicles per plant, eight groups were obtained, with accessions 140 (Korotou mochi), 110 (Gaisen mochi 909), 59 (Kaneko mochi) and 85 (Arabiya mochi) producing the higher number of panicles, around 10 panicles per plant. The lower means, between 3.1 to 4 panicles per plant, were presented by accessions 133 (Mogami chikanari 1), 131 (Rikutou), 95 (Riku araki), 40 (Col/Fukuti/1965), 82 (Taishou nishiki), 5 (Senshou ibaragi 1), 19 (Oohata mochi) and 83 (Shina mochi). Sarhadi et al. (2009), studying native aromatic rice cultivars from north, east and northeast of Afghanistan, and check cultivars from Japan, Thailand and India, found panicle number per plant ranging from 8 ± 1.5 to 13 ± 1.3, and observed that this trait was not correlated with grain number per panicle.
The trait panicle length classified the accessions in seven groups. Accessions 147 (IAC 202), 47 (Tomoe mochi), 137 (Igisu mochi), 36 (Yamato nishiki) and 11 (Nakaahara mochi) presented the higher means, 28.7 cm, 28.2 cm, 27.3 cm, 27.0 cm and 26.8 cm, respectively. Accessions 35 (Suzume shirazu), 48 (Nourin 16) and 100 (Kazusa wase) showed the lower means for this character, 16.5 cm, 16.0 cm and 15.7 cm, respectively.
Plant yield, number of panicles per plant and amount of fertile spicklets are some of the main components of rice production. The trait number of spicklets per plant classified the accessions in ten groups. The accession that showed the highest mean, 302 spicklets, was 81 (Nourin mochi 6), followed by accessions 56 (Ooba kirishima), 147 (IAC 202), 16 (Mie), 47 (Tomoe mochi), 149 (Bonança) and 15 (Mitsukasane), with 267.5, 264.9, 219.2, 218.5, 212.3 and 205.0 spicklets, respectively. The lowest means for this trait showed a variation from 40.4 (accession 58) to 73.9 spicklets (accession 49). Grain number per panicle in Afghan native rice cul-tivars ranged from 69 to 169 with most Afghan culcul-tivars showing more than 100 grains per panicle (Sarhadi et al., 2009), which is a desirable character for breeding programs. Therefore, the accessions in our study showed much higher values for this trait.
FLL 56.301 2.47 53.85 95.63 17.78 2.70
FLW 0.10 0.00 0.10 97.79 15.77 3.84
CL 199.60 19.30 180.30 90.33 14.03 1.77
CD 0.01 0.00 0.14 98.87 21.27 5.39
NTPP 3.10 0.12 2.97 96.01 28.31 2.83
FC 55.27 0.46 54.81 99.17 10.32 6.31
MC 3.98 0.39 3.59 90.13 1.81 1.74
NPP 2.26 0.14 2.13 93.94 23.75 2.27
PL 6.63 0.38 6.25 94.25 11.40 2.34
NSPP 1863.35 41.77 1821.59 97.76 39.58 3.81
PF 93.29 3.16 90.13 96.62 11.18 3.09
RLWG 0.17 0.00 0.16 97.45 15.30 3.57
TGW 12.86 0.86 12.00 93.33 12.30 2.16
PP 23.46 4.53 21.94 82.90 30.80 1.27
Table 5 – Estimates of the variance components, phenotypic and genetic parameters of 14 quantitative traits for 146 upland rice accessions from Japan and three Brazilian cultivars (controls).
Phenotypic and genetic parameters2
1FLL-fl ag leaf length; FLW-fl ag leaf width; CL-culm length;
CD-culm diameter; NTPP-number of tillers per plant; FC-fl owering cycle; MC-maturation cycle; NPP-number of panicles per plant; PL-panicle length; NSPP-number of spikelets per panicle; PF-panicle fertility; RLWG-ratio grain length/width; TGW-1000-grain weight; PP-production per plant.2
= phenotypic variance; = environmental variance; = genetic variance; = average heritability coeffi cient; CVg = coeffi cient of genetic variance; CVe = coeffi cient of experimental variation; Index b = CVg/CVe.
As for the character panicle fertility, the accessions were clas-sified in eight groups: genotypes Col/Miyazaki/1963 (accession 97), Shiro hige (accession 10), Bansei tarou (accession 123), Kahee (accession 54), Nourin mochi (accession 12) and Oosumi (acces-sion 44) showed the higher means, 97 %, 96.6 %, 96.5 %, 96.5 %, 96.2 % and 96.1 %, respectively; all of them resulted in fertility values above 90 %. Six groups were obtained for the trait 1000-grain weight. The higher means varied from 33.7 g (accession 86) to 36.2 g (accession 72), while the lower means varied from 19.5 g (accession 56) to 21.5 g (accession 96). This trait ranged from 20 to 32 g in the Afghan cultivars (Sarhadi et al., 2009).
Finally, character plant production classified the accessions in four groups. The genotypes that presented the higher means for this trait were Oota wase (accession 72), 35.6 g per plant, Bansei tarou (accession 123), 33.8 g per plant, Jouon (accession 71), 31.1 g per plant and Nourin mochi 1 (accession 37), 31.0 g per plant. The group that showed the lower means varied from 4.6 g per plant (accession 35) to 13.0 g per plant (accession 38). These same traits showed variation among 147 rice accessions in studies conducted by Bajracharya et al. (2006). In studies of ecogeografic and genetic diversity based on morphologi-cal characters of indigenous rice in China, Yawen et al. (2003) found wide variations for characters related to production, such as length of the panicle (10-36 cm) and grain number per panicle (30-340).
Considering the crop development period, the flowering cycle (FC), which is very important in the definition of the maturation cycle (MC) and was the most efficient trait in dis-criminating the accessions, varied considerably among acces-sions. It allowed 17 groups to be formed. Accession 53 (Col/
Fukuti/1965) showed the highest mean, a flowering cycle of 95.3 days, followed by accessions 48 (Nourin 16) and 129 (Okka modoshi), 88.3 and 88 days, respectively. Accessions 136 (Wase shinshuu), 76 (Kozo) and 45 (Oohataho), 55 days, and accession 75 (Hiderishirazu), 54 days, showed flowering cycles shorter than the other accessions. Seven groups were obtained for char-acter MC: the longer cycle was presented by genotype Tamasari mochi (accession 117), an average of 115 days, followed by ac-cessions 81 (Nourin mochi 6), 53 (Col/Fukuti/1965), 48 (Nou-rin 16) and 55 (Hitachi nishiki), 115, 112.7, 112, 112 and 110.7 days, respectively. The genotypes that presented shorter cycles varied from 100.7 days (accession 62) to 103.3 days (accession 133). Variations in the cycle can occur due to season sowing and weather conditions (Fonseca et al., 2002).
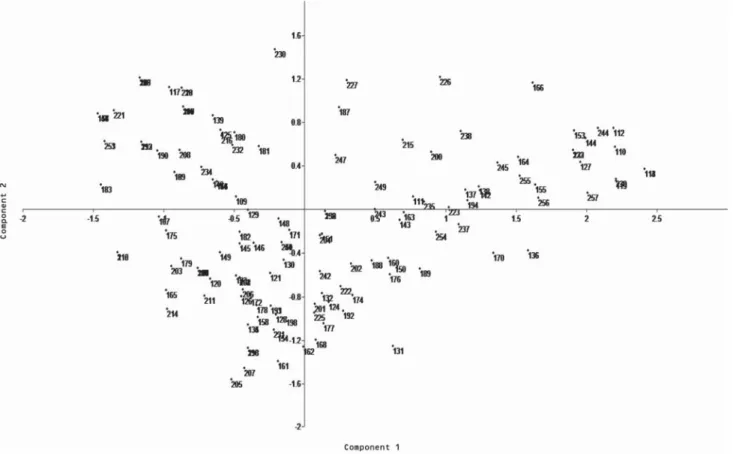
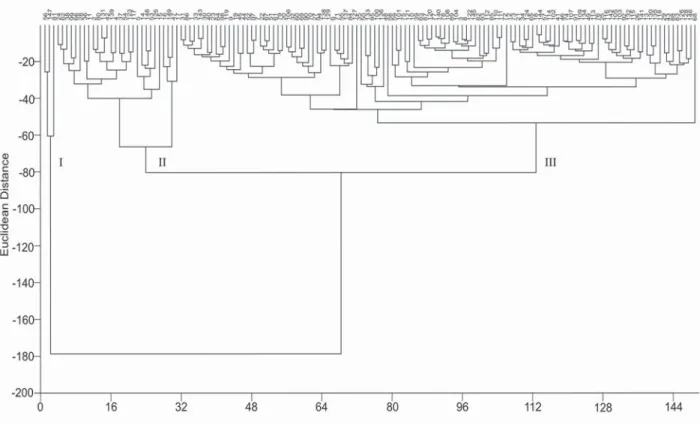
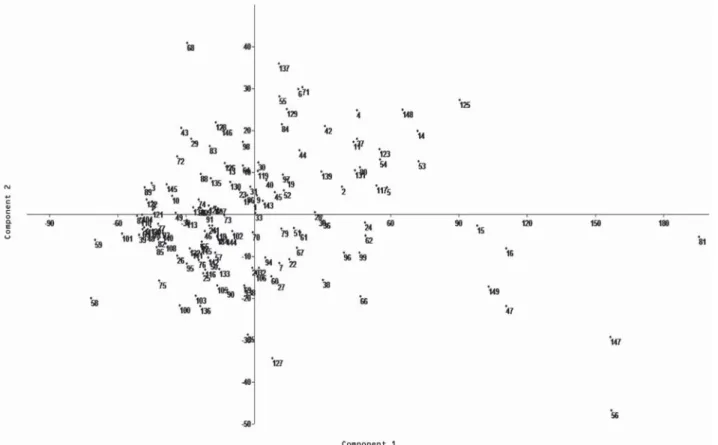
In the cluster analysis for the quantitative traits using the Euclidean distance, three groups were formed (Figure 3). One of the groups (group I) classified the accessions 56, 147 and 81 as more divergent than the others, for presenting higher number of panicles, fertile spikelets and plant produc-tion, which are important agronomic characters. The analysis of the descriptors used showed that the number of panicles per plant was the most important character in the group classification. The scatter graph considering the quantitative traits showed that accessions 56 (Ooba kirishima), 81 (Nou-rin mochi 6) and 147 (IAC 202, control), belonging to the most divergent group in the cluster analysis (group I), were also more divergent for the principal component analysis (PCA), followed by accessions 15 (Mitsukasane), 16 (Mie), 47 (Tomoe mochi) and 149 (Bonança, control) (Figure 4), which belong to a subgroup in group 2 of the cluster
sis. These seven accessions had high number of spicklets per plant, while accessions 47 and 147 showed high panicle lengths; accession 147 showed high flag leaf lengths as well. This last accession is the genotype IAC 202, one of the con-trols used in this study. The first and second components in the PCA represented 83.1 % and 8.4 % of the total variation among accessions. If the initial components accumulate a relatively high percentage of total variation, generally above 80 %, they satisfactorily explain the variability among indi-viduals (Madia et al., 1979).
No duplicates were identified among the studied accessions for quantitative traits in the cluster analysis (Figure 3), which means there is a high diversity among the accessions for these traits. Cluster analysis based on agro-morphological diversity assessment in rice was also reported in several studies, such as Ghalain (2006), Naik et al. (2006), Hien et al. (2007), Sarawgi and Bhisne (2007), Mathure et al. (2010), Li et al. (2010) and Zhang et al. (2010). Seetharam et al. (2009) characterized 30 rice genotypes comprising landraces, pure lines, somaclones, breeding lines and varieties by SSR markers and morphological characters. At Euclidian distances the genotypes were grouped into five clusters and the PCA components explained 38.4 % of total variation. Therefore, all data presented in this study allowed the identification of cultivars with distinct morpho-logical traits that could be used as potential parents to facilitate high resolution QTL mapping and validate candidate genes responsible for quantitatively agronomic characters (Li et al., 2010).
Acknowledgements
To Dr. Akihiko Ando and Dr. José Baldin Pinheiro from the
Genetics Department of “Luiz de Queiroz” College of
Agri-culture (ESALQ/USP) for providing the genotypes of Japanese upland rice used in this study.
References
Bajracharya, J.; Steele, K.A.; Jarvis, D.I.; Sthapit, B.R,; Witcombe, J.R. 2006. Rice landrace diversity in Nepal: variability of agro-morphological traits and SSR markers in landraces from a high-altitude site. Fields Crop Research 95: 327-335.
Bisne, R.; Sarawgi, A.K. 2008. Agro-morphological and quality characterization of Badshah Bhog group from aromatic rice germplasm of Chhattisgarh. Bangladesh Journal of Agricultural Research 33: 479-492.
Bonow, S.; Pinho, E.V.R.V.; Soares, A.A.; Siécola Júnior, S. 2007. Morphological characteristics of rice cultivars application for variety purity certifi cation. Ciência Agrotecnológica 31: 619-627 (in Portuguese,
with abstract in English).
Cruz, C.D. 2006. Program Genes: a software in the area of genetics and experimental statistics. UFV, Viçosa, MG, Brazil (in Portuguese). Fahliani, R.A.; Khodambashi, M.; Houshmand, S. 2010. Estimation of the
heritability of agro-morfological traits in rice (Oryza sativa L.) using F2:3 families. African Journal of Agricultural Research 5: 1297-1303. Fonseca, J.R.; Cutrim, V.A.; Rangel, P.H.N. 2002. Morpho-Agronomic
Descriptors and Phenology of the Lowland Rice Cultivars. Embrapa, Brasília, DF, Brazil (in Portuguese).
Fukuoka, S.; Suu, T.D.; Ebanna, K.; Trinh, L.N. 2006. Diversity in phenotypic profi les in landraces populations of Vietnamese rice: a case study of
agronomic characters for conserving crop genetic diversity on farm. Genetic Resources and Crop Evolution 53: 753-761.
Ghalain, S.S. 2006. Genetic divergence in rice (Oryza sativa L.) genotypes grown in Kamaun Himalaya. Indian Journal of Genetics 66: 37-38. Hammer, Ø.; Harper, D.A.T.; Ryan, P.D. 2001. PAST: paleontological
statistics software package for education and data analysis. Available at: http://palaeo-electronica.org/2001_1/past/issue1_01.htm. [Accessed Aug. 20, 2009]
Hien, N.L.; Sarhadi, W.A.; Hirata, Y.; Oikawa, Y. 2007. Genetic diversity of morphological responses and relationships among Asia aromatic rice (Oryza sativa L.) cultivars. Tropics 16: 343-355.
International Rice Research Institute [IRRI]. 1980. Descriptors for Rice Oryza sativa L. The International Rice Research Institute, Manila, Philippines. Li, R.; Jiang, T.B.; Xu, C.G.; Li, X.H.; Wang, X.K. 2000. Relationship
between morphological and genetic differentiation in rice (Oryza sativa L.). Euphytica 114: 1-8.
Li, X.; Yan, W.; Agrama, H.; Hu, B.; Jia, L.; Jia, M.; Jackson, A. Moldenhauer, K.; McClung, A.; Wu, D. 2010. Genotypic and phenotypic characterization on genetic differentiation and diversity in the USDA rice mini-core collection. Genetica 138: 1221-1230.
Lin, M.S. 1991. Genetic base of japonica rice varieties released in Taiwan. Euphytica 56: 43-46.
Madia, K.V.; Kent, J.T.; Bibby, J.M. 1979. Multivariate Analysis. Academic Press, London, UK.
Mathure, S.; Shaikh, A. Renuka, N. Wakte, K.; Jawali, N.; Thengane, R.; Nadaf, A. 2010. Characterization of aromatic rice (Oryza sativa L.) germplasm and correlation between their agronomic and quality traits. Euphytica DOI: 10.1007/S10681-010-0294-9.
Naik, D.; Sao, A.; Sarawgi, A.K.; Singh, P. 2006. Genetic divergence studies in some indigenous scented rice (Oryza sativa L.) accessions of Central India. Asian Journal of Plant Sciences 2: 197-200.
Patra, B.C.; Dhua, S.R. 2003. Agro-morphological diversity scenario in upland rice germplasm of Jeypore tract. Genetic Resources and Crop Evolution 50: 825-828.
Rosa, M.S.; Santos, P.P.; Veasey, E.A. 2006. Interpopulational agro-morphological characterization of Oryza glumaepatula. Bragantia 65: 1-10 (in Portuguese, with abstract in English).
Sarawgi, A.K.; Bisne, R. 2007. Studies on genetic divergence of aromatic rice germplasm for agro-morphological and quality characters. Oryza 44: 74-76.
Sarhadi, W.A.; Ookawa, T.; Yoshihashi, T.; Madadi, A.K.; Yosofzai, W.; Oikawa, Y.; Hirata, Y. 2009. Characterization of aroma and agronomic traits in Afghan native rice cultivars. Plant Production Science 12: 63-69. Scott, A.J.; Knott, M.A.A. 1974. Cluster analysis method for grouping means
in the analysis of variance. Biometrics 30: 507-512.
Seetharam, U.; Thirumeni, S.; Paramasivam, K. 2009. Estimation of genetic diversity in rice (Oryza sativa L.) genotypes using SSR markers and morphological characters. African Journal of Biotechnology 8: 2050-2059. Siddiqui, S.U.; Kumamaru, T.; Satoh, H. 2007. Pakistan rice genetic
resources.I. Grain morphological diversity and its distribution. Pakistan Journal of Botany 39: 841-848.
Veasey, E.A.; Silva, E.F.; Schammass, E.A.; Oliveira, G.C.X.; Ando, A. 2008. Morphoagronomic genetic diversity in American wild rice. Brazilian Archives of Biology Technology 51: 99-108.
Vencovsky, R.; Barriga, P. 1992. Biometrics in plant breeding genetics. Sociedade Brasileira de Genética, Ribeirão Preto, SP, Brazil (in Portuguese).
Villela, O.V.; Furlani Júnior, E. 1996. Seedling age on rice cultivar development. Bragantia 55: 329-339 (in Portuguese, with abstract in English). Yawen, Z.; Shiquani, S.; Zichao, L.; Zhongyi, Y.; Xiangkun, W.; Hongliang,
Z.; Guosong, W. 2003. Ecogeographic and genetic diversity based on morphological characters of indigenous rice (Oryza sativa L.) in Yunnan, China. Genetic Resources and Crop Evolution 50: 567-577.
Yibo, D.; Xinwu, P.; Qianhua, Y.; Hongjin, W.; Xujing, W.; Shirong, J.; Yufa, P. 2010. Ecological, morphological and genetic diversity in Oryza rufipogon Griff (Poaceae) from Hainan Island, China. Genetic Resources and Crop Evolution 57: 915-926.
Zhang, C.H.; Li, J.Z.; Zhu, Z.; Zhang, Y.D.; Zhao, L.; Wang, C.L. 2010. Cluster analysis on japonica rice (Oryza sativa L.) with good eating quality based on SSR markers and phenotypic traits. Rice Science 17: 111-121.
