Use of the Wasserman equation in optimization of the
duration of the power ramp in a cardiopulmonary
exercise test: a study of Brazilian men
D.C. Costa, G.L. De Santi, J.C. Crescêncio, L.P. Seabra, E.E.V. Carvalho, V. Papa, F. Marques,
L. Gallo Junior and A. Schmidt
Laboratório de Fisiologia do Exercício, Divisão de Cardiologia, Departamento de Clínica Médica, Hospital das Clínicas, Faculdade de Medicina de Ribeirão Preto, Universidade de São Paulo, Ribeirão Preto, SP, Brasil
Abstract
This study aimed to analyze the agreement between measurements of unloaded oxygen uptake and peak oxygen uptake based on equations proposed by Wasserman and on real measurements directly obtained with the ergospirometry system. We performed an incremental cardiopulmonary exercise test (CPET), which was applied to two groups of sedentary male subjects: one apparently healthy group (HG, n=12) and the other had stable coronary artery disease (n=16). The mean age in the HG was 47±4 years and that in the coronary artery disease group (CG) was 57±8 years. Both groups performed CPET on a cycle ergometer with a ramp-type protocol at an intensity that was calculated according to the Wasserman equation. In the HG, there was no significant difference between measurements predicted by the formula and real measurements obtained in CPET in the unloaded condition. However, at peak effort, a significant difference was observed between oxygen uptake ðV:O2ÞpeakðpredictedÞ and V
:
O2peakðrealÞ (nonparametric Wilcoxon test). In the CG, there was a significant difference of
116.26 mL/min between the predicted values by the formula and the real values obtained in the unloaded condition. A significant difference in peak effort was found, where V:O2peakðrealÞ was 40% lower than V
:
O2peakðpredictedÞ (nonparametric
Wilcoxon test). There was no agreement between the real and predicted measurements as analyzed by Lin’s coefficient or the Bland and Altman model. The Wasserman formula does not appear to be appropriate for prediction of functional capacity of volunteers. Therefore, this formula cannot precisely predict the increase in power in incremental CPET on a cycle ergometer.
Key words: Wasserman equation; Cardiopulmonary exercise test; Coronary artery disease; Cardiovascular diagnostic techniques
Introduction
The cardiopulmonary exercise test (CPET) has greatly changed the approach to functional evaluation by relating physical fitness and physiological parameters to the underlying metabolic substrate and by providing highly reproducible descriptors of effort capacity. The CPET provides an accurate and objective measurement of functional capacity and of the integrity of the cardio-vascular and respiratory systems. Therefore, the CPET has been indicated for assessment of functional capacity in high-performance athletes, for diagnostic purposes, and for evaluation of pharmacological or non-pharmacological therapies, preoperative risk, and for risk stratification. Variables, such as oxygen uptake
ðV:O2Þ represent an objective measure of functional capacity and reflect the severity of diseases, such as myocardial ischemia, heart failure, hypertrophic
cardiomyopathy, and pulmonary artery hypertension secondary to interstitial or chronic obstructive pulmon-ary disease (1,2).
The CPET is considered to be the most accurate method for assessment of aerobic power. However, different values may be obtained for the same individual when different modalities of the test are used (3,4). From a methodological point of view, two aspects crucially interfere with the quality of the test and the reproducibility of the response of the variables: the type of protocol and the duration of the effort tests.
Ramp protocols have become popular because they permit individualized tests. This is possible because load increment occurs constantly and continuously at a rate that can be individualized according to the capacity of the individual (5–8).
Correspondence: D.C. Costa:<[email protected]>.
The Wasserman equation (9) has been routinely used for many years in the Laboratório de Fisiologia do Exercício, Faculdade de Medicina de Ribeirão Preto. This equation is used for the choice of progressive load increment on a cycle ergometer during the CPET, and is applied to healthy individuals and to those with ischemic myocardial disease. This practice is based on the search for a less empirical and subjective manner of choosing the intensity of the power ramp to be applied to incremental effort tests on a cycle ergometer.
Elaboration of a formula for the calculation of load increment in a ramp-type incremental CPET by Wasser-man et al. (9) proved to be helpful for choosing the most appropriate intensity for optimization of the quality of the CPET. However, in many cases, a simple estimate of the power increment according to this formula can under-estimate or overunder-estimate the real functional capacity of a healthy individual or a patient. Marked characteristics of health status, as well as disease status, directly interfere with the performance and homeostasis of the cardiopul-monary and musculoskeletal systems during exercise.
The present study aimed to analyze the agree-ment between measurements of unloaded oxygen uptake ðV:O2unloadedðpredictedÞÞ and peak oxygen uptake
ðV:O2peakðpredictedÞÞpredicted from the equations proposed by Wasserman and real measurementsðV:O2unloadedðrealÞ; V:O2peakðrealÞÞ, which were directly obtained in an incre-mental ramp-type CPET. We studied a sample of apparently healthy sedentary males and a sample of sedentary males with coronary artery disease (CAD).
Material and Methods
Two groups of sedentary males were selected. The healthy group (HG) consisted of 12 apparently healthy sedentary volunteers, aged 47±4 years, who were recruited through the media. For inclusion in the study, all of the subjects were submitted to clinical evaluation and to a resting electrocardiogram to exclude asymptomatic heart disease or a history of cardiac or pulmonary disease or any orthopedic limitation. Current smokers and/or alcoholics, and subjects taking antihyper-tensive drugs or beta-blockers, or any other medication that would alter the response of the subject to physical effort were excluded.
The other group was the coronary artery disease group (CG). This group consisted of 16 sedentary individuals, aged 57±8 years, who were recruited at the outpatient clinic of the institution. The subjects met at least one of the following inclusion criteria: a history of acute myocardial infarction that was clinically confirmed and/or by complementary exams, previous coronary angiography with documentation of coronary injury with more than 70% obstruction of the luminal diameter, and a previous noninvasive exam (stress echocardiogram or myocardial perfusion scintigraphy) with documentation of effort
ischemia. All of the patients had been clinically stable for at least the last 3 months, with optimized pharmacological treatment and no indication of new revascularization procedures.
The study was approved by the Research Ethics Committee of the Hospital das Clínicas, Faculdade de Medicina de Ribeirão Preto, Universidade de São Paulo, (protocol #1593/2009). All of the subjects gave written informed consent to participate.
CPET
The formula proposed by Wasserman (9) was calcu-lated for each individual for performance of the CPET as follows:
V:O2unloadedðmL=minÞ ¼150þ ð6weight;kgÞ
V:O2peak ðmL=minÞ ¼ ðheight : cm; age : yearsÞ 20 Rampðw=minÞ ¼ V
:
O2peak − V :
O2unloaded=100
For subjects in the HG, only a decimal approximation of the final result of the formula, in watts/minute, was added by rounding the value to the nearest decimal point. For subjects in the CG, this correction was made based on clinical evaluation and disease conditions, with an average 4.84 watts reduction of the final result. These corrections needed to be applied so that each individual achieved maximum effort, satisfying one or more of the criteria that define V:O2max, such as a respiratory exchange ratio (RER) 41.15, heart rate at peak effort above 85% of maximum, and a plateau of oxygen uptake, which was defined as a variation in increase between 1.0 and 2.0 mL/kg/min within 8 to 12 min (3,7,10).
Calculation of variables obtained with CPET
After stabilization of pedaling velocity at approximately 60 rpm, a segment of approximately 2 min was selected for calculation of V:O2unloadedðrealÞ during the 4 min of the unloaded period. The last 10 values plotted by the metabolic system were selected for peak effort and the mean V:O2peakðrealÞwas calculated.
Statistical analysis
Data are reported as mean±SD and are presented graphically in box plots. The nonparametric Wilcoxon test was used to compare intragroup means of V:O2unloadedðpredictedÞ;V
:
O2unloadedðrealÞ; V :
O2peakðpredictedÞ; and V:O2peakðrealÞ. The nonparametric Mann-Whitney test was used to compare intergroup means for duration of effort, V:O2unloadedðrealÞ; V
:
O2peakðrealÞ; RER unloaded, RER peak, power (peak), and ventilation ðV:Þ peak. The agreement between means was determined using the Lin and Bland and Altman models, with calculation of the mean difference between methods (bias) and the 95% confidence intervals (CIs) for the limits of agreement.
Lin’s concordance coefficient was used to determine whether the measurements that were predicted by the formula and the real measurements that were obtained in the CPET significantly deviated from the perfect concor-dance line (a 45° line with origin at 0 of the x and y axes). Excellent concordance was defined as Lin 40.90, satisfactory concordance as Lin 0.6–0.9, and unsatisfac-tory concordance as Lin o0.6. The level of significance was set at 5%.
Results
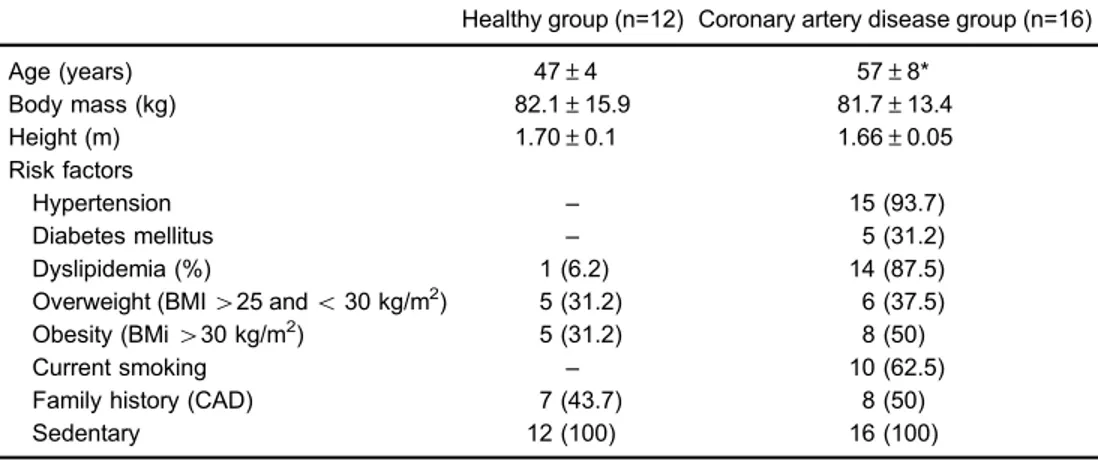
The anthropometric characteristics and risks factors of both groups are shown in Table 1. Previous events and
interventions, distribution of the left ventricular ejection fraction, and medications used are shown in Table 2.
The duration of effort was 620±140 s in the CG, corresponding to 10±2 min, and 552±75 s in the HG, corresponding to 9±1 min, with no significant difference between the groups (P=0.09).
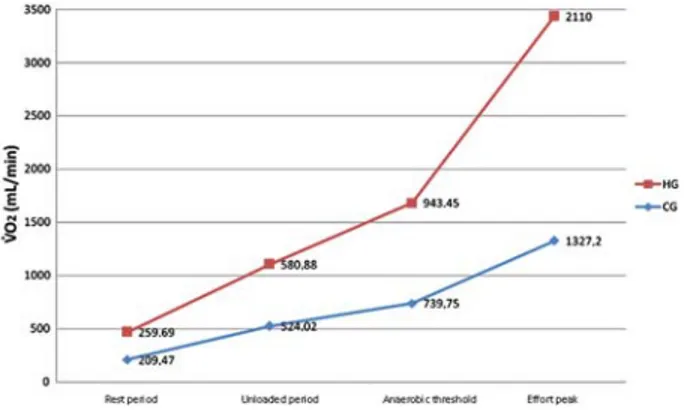
With regard to the functional capacity of the two groups, during the unloaded period, V:O2unloadedðrealÞwas significantly lower in the CG compared with the HG (524±67 vs 581±68 mL/min; P=0.02). At peak effort, V:O2peakðrealÞ was significantly lower in the CG compared with the HG (1327±287 vs 2110±336 mL/min; Po0.0001). A similar finding was observed when V:O2peakðrealÞ was corrected for weight (mLkg–1min–1), with a lower value in the CG compared with the HG (16±3 vs26±6; Po0.0001; Figure 1 and Table 3).
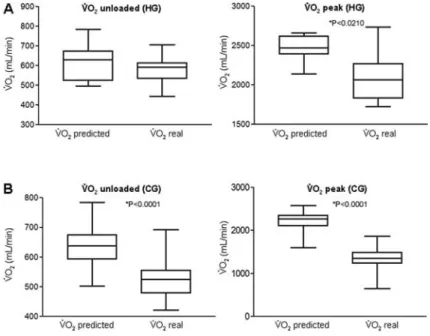
When the measurements that were predicted by the formula and the real measurements that were obtained in the CPET were compared in the HG, the difference of 39 mL/min detected in the unloaded condition between V:O2unloadedðpredictedÞ and V
:
O2unloadedðrealÞ (620±91 vs 581±68 mL/min [6% difference]) was not significant (P=0.10). However, at peak effort, a significant difference was observed between V:O2peak ðpredictedÞand V
:
O2peakðrealÞ values (2467±174 vs 2110±336 mL/min [14% differ-ence]; P=0.02; Figure 2A).
In the CG, there was a significant difference between the values that were predicted by the Wasserman (9) formula and the real values that were obtained in the unloaded condition in the CPET (116 mL/min, Po0.0001), where V:O2unloadedðpredictedÞ was 640±80 mL/min and V:O2unloadedðrealÞ was 524±67 mL/min (18% difference). A significant difference was also detected at peak effort, where V:O2peakðpredictedÞ was 2217±241 and V
:
O2peakðrealÞ was 1327±287 mL/min (Po0.0001; 40% difference; Figure 2B).
Table 1.Anthropometric characteristics and prevalence of risk factors in the healthy and coronary artery disease groups.
Healthy group (n=12) Coronary artery disease group (n=16)
Age (years) 47±4 57±8*
Body mass (kg) 82.1±15.9 81.7±13.4
Height (m) 1.70±0.1 1.66±0.05
Risk factors
Hypertension – 15 (93.7)
Diabetes mellitus – 5 (31.2)
Dyslipidemia (%) 1 (6.2) 14 (87.5)
Overweight (BMI425 ando30 kg/m2) 5 (31.2) 6 (37.5)
Obesity (BMi430 kg/m2) 5 (31.2) 8 (50)
Current smoking – 10 (62.5)
Family history (CAD) 7 (43.7) 8 (50)
Sedentary 12 (100) 16 (100)
Analysis of agreement between the methods during the unloaded period in the HG showed a Lin’s con-cordance coefficient of 0.42 (95% CI=0.01–0.61) between the values that were predicted by the formula and the real values that were obtained in the CPET (Figure 3A). According to the Bland and Altman model, the mean difference ðV:O2unloadedðpredictedÞ V
:
O2unloadedðrealÞÞ was 39 mL/min (95% CI=–127.08–204.92; Figure 3B). At peak effort, Lin’s concordance coefficient was 0.08 (95% CI=–0.18–0.11; Figure 3C). According to the Bland and Altman model, the mean difference ðV:O2peakðpredictedÞ V:O2unloadedðrealÞÞ was 357 mL/min (95% CI=–454.82– 1168.07; Figure 3D).
In contrast, in the CG, during the unloaded condition, Lin’s concordance coefficient between the values that were predicted by the formula and the real values that were obtained in the CPET was 0.33 (95% CI=0.15–0.51; Figure 4A). According to the Bland and Altman model, the mean difference ðV:O2unloadedðpredictedÞ V
:
O2unloadedðrealÞÞ was 116 mL/min (95% CI=16.4–216.12; Figure 4B). At peak effort, Lin’s concordance coefficient was 0.04 (95% CI=–0.03–0.13; Figure 4C). According to
the Bland and Altman model, the mean difference
ðV:O2unloadedðpredictedÞ V :
O2unloadedðrealÞÞ was 890 mL/min (95% CI=238.59–1541.95; Figure 4D).
Discussion
The Wasserman formula (9) has been routinely used in our institution for the choice of progressive load increment (power) applied to the cycle ergometer during the CPET for healthy individuals and those with CAD. Use of this method is based on an attempt to use a less empirical and subjective method of choosing the intensity of the power ramp to be applied during incremental effort tests on a cycle ergometer.
Tests of short duration with intense power increments generate an insufficient quantity of data, thus impairing their interpretation. In addition, a relatively large proportion of the energy that is generated in these tests is based on anaerobic sources. This fact compromises the response of the O2transport variables and the quality and reliability of the exam because the individual may interrupt the test early because of muscle fatigue. Conversely, long tests with small power increments can prolong the period of effort. In these situations, measurements of O2transport at submaximal effort are also compromised because of early termination of the exam. This termination is due to the discomfort caused by the mouthpiece of the system for metabolic analysis, by discomfort of the cycle ergometer’s seat, lack of motivation, and even muscle fatigue (7,9).
Some investigators have been searching for new methods to accurately estimate the cardiovascular func-tional reserve, using CPET individualized protocols capa-ble of reaching the maximum aerobic power. Myers et al. (11) developed a questionnaire on daily life activities in elderly subjects that took into consideration chest pain, dyspnea, and fatigue (Veteran’s Specific Activity Ques-tionnaire). Using multivariable analysis, they observed that age and the responses to the questionnaire were able Figure 1. V:O2 under conditions of rest and effort. V
: O2 was directly obtained by a metabolic analysis system during the CPET in the healthy group (HG) and coronary artery disease group (CG). V:O2: oxygen uptake.
Table 2. Events and previous interventions, distribution of left ventricular ejection fraction, and medications being used in the coronary artery disease group.
Events and previous interventions
Coronary artery disease group (n=16)
AMI 9 (56.2)
PTCA 9 (56.2)
CABG 3 (18.7)
Ejection fraction of the left ventricle
Normal EF (450%) 12 (75)
Reduced EF (o50%) 4 (25)
Medications
Beta-blockers 16 (100)
ACE inhibitors 11 (68.7)
Antagonists of angiotensin II receptor 1 (6.2) Calcium channel blockers 8 (50)
Nitrate 9 (56.2)
Acetylsalicylic acid 12 (75)
Statins 13 (81.2)
Ticlopidine/clopidogrel 3 (18.7)
Oral anticoagulants 2 (12.5)
Diuretics 7 (43.7)
Oral hypoglycemic 3 (18.7)
Insulin 1 (6.2)
Fibrate 1 (6.2)
a-2 adrenergic antagonist 1 (6.2)
to predict exercise tolerance. They proposed a nomogram that predicted the peak metabolic equivalent and the ramp load increment on a treadmill. In 1996, another group studying patients with heart disease developed a new questionnaire based on daily life activities (12). Using multiple regression analysis, the authors observed that age, height, body mass, and the responses to the questionnaire were able to predict V:O2peakfor effort tests on a treadmill. However, most of the studies published in the literature did not detail the choice of the protocol that was used for individualization and performance of the effort tests, as concluded by Huggett et al. (10) in a review of maximum aerobic capacity in elderly people.
Thefirst recommendation on the ideal duration of effort tests needed to reach maximum aerobic power was
published in 1983 (3). This controversial study involved only five healthy male volunteers, who performed three incremental effort tests on a treadmill and three tests on a cycle ergometer. The authors concluded that, to obtain the highest V:O2max during an incremental effort test, a load increment needs to be selected that will permit a volunteer to reach the limit of his/her effort tolerance within 10±2 min. Two other studies published in 1998 and 2003 demonstrated that reaching V:O2max is possible in incremental effort tests of prolonged duration (25–26 min) in trained and untrained individuals (13,14). However, slightly longer tests with a mean duration of 28 min resulted in a significantly lower V:O2max compared with tests with a mean duration of 11 min (15). Three subsequent studies (16–18) also
Figure 2. Box plots of V:O2unloaded ðpredictedÞ,
V:O2unloadedðrealÞ, V
:
O2peak ðpredictedÞand V
:
O2peak ðrealÞ
in the healthy group (HG) (A) and the coronary artery disease group (CG) (B). The nonparametric Wilcoxon test was used for statistical analysis. V:O2: oxygen uptake.
Table 3.Ventilatory variables that were obtained in the unloaded period and peak effort in the healthy and coronary artery disease groups.
Unloaded period (real) Coronary artery disease group (n=16) Healthy group (n=12) :
VO2unloadedðrealÞðmL=minÞ 524.02±66.76* 580.88±67.98
RER 0.91±0.08* 0.81±0.06
:
VO: 2unloadedðrealÞðmL=minÞ 1327.2±287.15* 2110±335.83
VO2unloadedðrealÞðmL=kg=minÞ 16.38±3.46* 26.54±6.45
HR (bpm) 117±17* 164±12
Work (watts) 113.64±29.21* 177.28±22.63
RER 1.28±0.10* 1.16±0.08
:
VðL=minÞ 57.04±14.13* 75.39±13.06
Figure 4. Lin’s concordance coefficients and Bland and Altman analysis in the coronary artery disease group. Lin’s concordance coefficient for V:O2unloaded ðpredictedÞvsV
:
O2unloadedðrealÞðAÞ and
Bland and Altman analysis of V:O2unloaded ðpredictedÞvs
V:O2unloadedðrealÞðBÞin the unloaded condition. Lin’s
concordance coefficient for (V:O2peakðpredictedÞvs
V:O2unloadedðrealÞÞ ðCÞand Bland and Altman analysis
of V:O2peakðpredictedÞand V
:
O2unloadedðrealÞðDÞat peak
effort. V:O2: oxygen uptake. Dotted lines: mean±2SD. Figure 3.Lin’s concordance coefficients and Bland and Altman analysis in the healthy group. Lin’s concordance coefficient for V:O2unloaded ðpredictedÞvs
V:O2unloadedðrealÞðAÞand Bland and Altman analysis
of V:O2unloadedðpredictedÞvsV
:
O2unloadedðrealÞðBÞin the
unloaded condition. Lin’s concordance coefficient for (V:O2peakðpredictedÞvsV
:
O2unloaded ðrealÞÞ ðCÞ and
Bland and Altman analysis of V:O2peakðpredictedÞand
V:O2unloaded ðrealÞðDÞat peak effort. V
:
reported significantly lower V:O2maxvalues for tests with a mean time to exhaustion of 20–27 min compared with tests lasting 8–12 min.
However, another two studies showed that untrained men and women who were submitted to protocols with a mean time to exhaustion of 6.6–7.4 min were able to reach significantly higher V:O2max values than those who were submitted to protocols with a duration of 8–12 min (17,19). Kang et al. (20) also supported findings that recommend tests of short duration. The authors demon-strated that incremental effort tests lasting approximately 5 min enable V:O2maxvalues to be reached that are similar to those obtained with tests lasting 8–12 min.
Incremental effort tests of short duration can be particularly appropriate for trained individuals because of a greater efficiency in the kinetics of oxygen transport (21). However, these short duration protocols may not be appropriate for patients with cardiorespiratory dysfunction. Agostoni et al. (22) reported significantly higher V:O2max values in protocols of incremental effort with a mean duration of 9.7±0.8 min compared with tests of 5.3±0.5 min in patients with heart failure.
Risk factors for CAD have been documented in men older than 45 years, especially in those with known CAD (23,24). Therefore, the age of subjects in the HG was an average of 10 years less than that of subjects in the CG because most of the risk factors (arterial hypertension, diabetes mellitus, and smoking) excluded HG volunteers. The remaining anthropometric character-istics, including body mass and height, were similar in the two groups.
HG
HG volunteers were selected to permit inclusion of subjects who were considered ‘‘healthy’’. However, they could be overweight and/or have dyslipidemia. This criterion was adopted because of the difficulty in finding sedentary men older than 40 years with no regular medications and without risk factors that were considered to be modifiable (25).
In our study, the difference detected between V:O2unloadedðpredictedÞ and V
:
O2unloadedðrealÞ was only 6%, and did not reach significance. This result indicates that this component of the Wasserman formula may be appropriate for predicting VO2: during the unloaded period in this Brazilian sample of healthy volunteers. However, a significant difference was observed for peak effort, where V:O2peakðrealÞwas 14% lower than V
:
O2peakðpredictedÞ. In this case, the formula overestimated the real capacity of an individual. Because of this difference, the ability of the formula to predict power increment (ramp) is impaired. Bland and Altman analysis also showed low agreement between the predicted and real V:O2. There are few data to compare with our results. Recently, another study (26) created and validated a formula that calculates V:O2peakðpredictedÞin Brazilian healthy subjects. This previous
study also showed that the Wassermann equation may not be suitable in our population.
CG
Despite the presence of impaired cardiac function, subjects in the CG were unable to achieve maximum effort when the load increment indicated by the Wasserman formula (9) was applied. Subjective adjustments were necessary according to the clinical conditions and degree of physical activity existing at the time of performing the CPET.
The differences detected in the analysis of the CG were of greater magnitude than those in the HG. In the unloaded condition, V:O2unloadedðrealÞwas 18% lower than V:O2unloadedðpredictedÞ, which was a significant difference. For peak effort, this difference was further increased and V:O2unloadedðrealÞ was 40% lower than V
:
O2peakðpredictedÞ. Therefore, in the CG, the measurements that were predicted by the Wasserman equation always overesti-mated the real aerobic capacity of the individuals. This fact indicates the need to continue to use a correction factor for power increment (ramp) in subjects with CAD who are evaluated by a routine CPET. Analysis of the agreement between VO2: measurements also showed an even more marked disagreement than that observed in the HG.
Wasserman et al. (9) made an important contribution to scientific knowledge and their work was the basis of our clinical application. However, our results suggest that there is variation related to the experimental design and the individual characteristics involved in the formula.
When we compared the behavior of cardiorespiratory variables during the CPET, we demonstrated a difference in functional capacity between patients with CAD and healthy individuals. The routine use of b-blockers is recommended in patients with CAD. The beneficial effects of this class of medications on improvement of symptom-limited effort capacity have been well established. These effects include a reduction in myocardial ischemia due to effort, an increase in the ischemic threshold, and an improvement in autonomic modulation (27,28).
However,b-adrenoceptor blockade strongly influences metabolic and hemodynamic adaptations and ion balance during dynamic exercise. One of the main effects of the use of ab-blocker is a reduction of heart rate at rest and during dynamic exercise (27–31), as we observed in the present study. A lower heart rate was observed in subjects in the CG during the rest phase and during the various effort phases (unloaded, load increment, and peak effort) compared with subjects in the HG, who did not use medications.
territories during exercise because cardiac output, and consequently muscle blood flow, are reduced. Therefore, although there is evidence that muscle fatigue is also caused by neuromuscular mechanisms (33,34), this reduced bloodflow may explain, at least in part, early fatigue.
Finally, lower V:O2 values were observed in the CG during rest and during the different phases of effort compared with the HG. This reduction, which has already been observed in other studies that evaluated the effect of administration ofb-blockers on O2transport (30,31), may partially explain the reduction in V:O2in the CG.
For a prediction or estimation equation, understanding the structural and local characteristics of the population for which the equation is created or validated is important. Predicting V:O2peakis challenging, mainly because factors, such as genetic differences, ethnicity, habits, body size, and physical activity levels of a particular population, may differ from the population in which the equation was initially tested.
Study limitations
As in other seminal studies (3,9), our study has several limitations. Our sample size was small in both groups, but our strict selection criteria enabled the groups to be uniform.
The present study provides initial evidence that the Wasserman formula does not appear to be appropriate for prediction of functional capacity of Brazilian volunteers, regardless of whether they are apparently healthy or have CAD. Therefore, we cannot precisely predict the power increment (ramp) in incremental CPET on a cycle ergometer. When healthy subjects are compared with those with CAD, the disagreement between measure-ments is much more marked in the latter than the former.
Acknowledgments
This study was supported by CAPES and FAEPA-HCFMRP-USP.
References
1. Gibbons RJ, Balady GJ, Bricker JT, Chaitman BR, Fletcher GF, Froelicher VF, et al. ACC/AHA 2002 guideline update for exercise testing: summary article. A report of the American College of Cardiology/American Heart Asso-ciation Task Force on Practice Guidelines (Committee to Update the 1997 Exercise Testing Guidelines).J Am Coll
Cardiol2002; 40: 1531–1540, doi: 10.1016/S0735-1097(02)
02164-2.
2. Guazzi M, Adams V, Conraads V, Halle M, Mezzani A, Vanhees L, et al. EACPR/AHA Scientific Statement. Clinical recommendations for cardiopulmonary exercise testing data assessment in specific patient populations.
Circulation2012; 126: 2261–2274, doi: 10.1161/CIR.0b013e
31826fb946.
3. Buchfuhrer MJ, Hansen JE, Robinson TE, Sue DY, Wasser-man K, Whipp BJ. Optimizing the exercise protocol for cardiopulmonary assessment.J Appl Physiol Respir Environ
Exerc Physiol1983; 55: 1558–1564.
4. Huggett DL, Connelly DM, Overend TJ. Maximal aerobic capacity testing of older adults: a critical review.
J Gerontol A Biol Sci Med Sci 2005; 60: 57–66, doi:
10.1093/gerona/60.1.57.
5. Albouaini K, Egred M, Alahmar A, Wright DJ. Cardiopul-monary exercise testing and its application.Postgrad Med J 2007; 83: 675–682, doi: 10.1136/hrt.2007.121558. 6. Milani RV, Lavie CJ, Mehra MR, Ventura HO. Understanding
the basics of cardiopulmonary exercise testing.Mayo Clin Proc2006; 81: 1603–1611, doi: 10.4065/81.12.1603. 7. Myers J, Bellin D. Ramp exercise protocols for clinical and
cardiopulmonary exercise testing. Sports Med 2000; 30: 23–29, doi: 10.2165/00007256-200030010-00003. 8. Romer LM. Cardiopulmonary exercise testing in patients
with ventilatory disorders. In: Winter EM, Jones AM, Davison R, et al. (Editors),Sports and exercise physiology testing guidelines: exercise and clinical testing. London: Routledge; 2007. p 179–188.
9. Wasserman K, Hansen JE, Sue D, Whipp BJ, Casaburi R. Principles of exercise testing and interpretation. 4th edn. Philadelphia: Lippincott Williams and Wilkins; 2004. 10. Huggett DL, Connelly DM, Overend TJ. Maximal aerobic
capacity testing of older adults: a critical review.
J Gerontol A Biol Sci Med Sci 2005; 60: 57–66, doi:
10.1093/gerona/60.1.57.
11. Myers J, Do D, Herbert W, Ribisl P, Froelicher VF. A nomogram to predict exercise capacity from a specific activity questionnaire and clinical data.Am J Cardiol1994; 73: 591–596, doi: 10.1016/0002-9149(94)90340-9. 12. Rankin SL, Briffa TG, Morton AR, Hung J. A specific activity
questionnaire to measure the functional capacity of cardiac patients.Am J Cardiol1996; 77: 1220–1223, doi: 10.1016/ S0002-9149(97)89157-6.
13. Bentley DJ, McNaughton LR. Comparison of W(peak), VO2(peak) and the ventilation threshold from two different incremental exercise tests: relationship to endurance per-formance.J Sci Med Sport2003; 6: 422–435, doi: 10.1016/ S1440-2440(03)80268-2.
14. Bishop D, Jenkins DG, Mackinnon LT. The effect of stage duration on the calculation of peak VO2 during cycle ergometry.J Sci Med Sport1998; 1: 171–178, doi: 10.1016/ S1440-2440(98)80012-1.
15. Weston SB, Gray AB, Schneider DA, Gass GC. Effect of ramp slope on ventilation thresholds and VO2peak in male cyclists.Int J Sports Med2002; 23: 22–27.
16. Froelicher VF Jr, Brammell H, Davis G, Noguera I, Stewart A, Lancaster MC. A comparison of three maximal treadmill exercise protocols.J Appl Physiol1974; 36: 720–725. 17. Pollock ML, Bohannon RL, Cooper KH, Ayres JJ, Ward A,
White SR, et al. A comparative analysis of four protocols for maximal treadmill stress testing. Am Heart J 1976; 92: 39–46, doi: 10.1016/S0002-8703(76)80401-2.
three different maximal graded exercise test protocols in healthy women. Am Heart J 1982; 103: 363–373, doi: 10.1016/0002-8703(82)90275-7.
19. Myers J, Buchanan N, Walsh D, Kraemer M, McAuley P, Hamilton-Wessler M, et al. Comparison of the ramp versus standard exercise protocols. J Am Coll Cardiol 1991; 17: 1334–1342, doi: 10.1016/S0735-1097(10)80144-5. 20. Kang J, Chaloupka EC, Mastrangelo MA, Biren GB,
Robertson RJ. Physiological comparisons among three maximal treadmill exercise protocols in trained and untrained individuals.Eur J Appl Physiol2001; 84: 291–295. 21. Caputo F, Mello MT, Denadai BS. Oxygen uptake kinetics and time to exhaustion in cycling and running: a comparison between trained and untrained subjects.Arch Physiol Biochem 2003; 111: 461–466, doi: 10.3109/13813450312331342337. 22. Agostoni P, Bianchi M, Moraschi A, Palermo P, Cattadori G,
La Goia R, et al. Work-rate affects cardiopulmonary exercise test results in heart failure. Eur J Heart Fail 2005; 7: 498–504.
23. Klecha A, Kawecka-Jaszcz K, Bacior B, Kubinyi A, Pasowicz M, Klimeczek P, et al. Physical training in patients with chronic heart failure of ischemic origin: effect on exercise capacity and left ventricular remodeling.Eur J Cardiovasc
Prev Rehabil2007; 14: 85–91, doi: 10.1097/HJR.0b013e32
80114f12.
24. Milani M, Kozuki RT, Crescêncio JC, Papa V, Santos MDB, Bertini CQ, et al. Efeito do treinamento físico aeróbico em coronariopatas submetidos a um programa de reabilitac¸ão cardiovascular.Medicina2007; 40: 403–411.
25. Yusuf S, Hawken S, Ounpuu S, Dans T, Avezum A, Lanas F, et al. Effect of potentially modifiable risk factors associated with myocardial infarction in 52 countries (the INTERHEART study): case-control study.Lancet2004; 364: 937–952, doi: 10.1016/S0140-6736(04)17018-9.
26. Almeida AEM, Stefani CM, Nascimento AG, Almeida NM, Santos AC, Ribeiro JP, et al. A equation for the prediction of oxygen consumption in a Brazilian population. Arq Bras
Cardiol2014; 103: 299–307.
27. Gibbons RJ, Abrams J, Chatterjee K, Daley J, Deedwania PC, Douglas JS, et al. ACC/AHA 2002 guideline update for the management of patients with chronic stable angina–summary article: a report of the American College of Cardiology/American Heart Association Task Force on Practice Guidelines (Committee on the Man-agement of Patients With Chronic Stable Angina). Circula-tion2003; 107: 149–158, doi: 10.1161/01.CIR.0000047041. 66447.29.
28. César LAM, et al. Diretriz de angina estável. Arq Bras
Cardiol2004; 83 (Supl 2): 6–43.
29. Hawkins MN, Barnes Q, Purkayastha S, Eubank W, Ogoh S, Raven PB. The effects of aerobic fitness and beta1-adrenergic receptor blockade on cardiac work during dynamic exercise.J Appl Physiol2009; 106: 486–493. 30. Pearson SB, Banks DC, Patrick JM. The effect of
beta-adrenoceptor blockade on factors affecting exercise toler-ance in normal man.Br J Clin Pharmacol1979; 8: 143–148. 31. Tesch PA, Kaiser P. Effects of beta-adrenergic blockade on O2uptake during submaximal and maximal exercise.J Appl
Physiol Respir Environ Exerc Physiol1983; 54: 901–905.
32. Mier CM, Domenick MA, Wilmore JH. Changes in stroke volume with beta-blockade before and after 10 days of exercise training in men and women.J Appl Physiol1997; 83: 1660–1665.
33. Asmussen E. Muscle fatigue. June 1979.Med Sci Sports
Exerc1993; 25: 411–420.