Systematic Review and Meta-Analysis of Observational
Studies
Paulo Mascarenhas1, Bruno Fatela2, Isabel Barahona1*
1 Centro de Investigac¸a˜o Interdisciplinar Egas Moniz, Instituto Superior de Cieˆncias da Sau´de Egas Moniz, Monte de Caparica, Portugal, 2 Servic¸o de Ana´lises Clinicas -Centro Hospitalar de Setu´bal (CHS), Setu´bal, Portugal
Abstract
Background:Early screening of type 2 diabetes mellitus (DM) is essential for improved prognosis and effective delay of clinical complications. However, testing for high glycemia often requires invasive and painful blood testing, limiting its large-scale applicability. We have combined new, unpublished data with published data comparing salivary glucose levels in type 2 DM patients and controls and/or looked at the correlation between salivary glucose and glycemia/HbA1c to systematically review the effectiveness of salivary glucose to estimate glycemia and HbA1c. We further discuss salivary glucose as a biomarker for large-scale screening of diabetes or developing type 2 DM.
Methods and Findings:We conducted a meta-analysis of peer-reviewed published articles that reported data regarding mean salivary glucose levels and/or correlation between salivary glucose levels and glycemia or HbA1c for type 2 DM and non-diabetic individuals and combined them with our own unpublished results. Our global meta-analysis of standardized mean differences on salivary glucose levels shows an overall large positive effect of type 2 DM over salivary glucose (Hedge’s g = 1.37). The global correlation coefficient (r) between salivary glucose and glycemia was large (r = 0.49), with subgroups ranging from medium (r = 0.30 in non-diabetics) to very large (r = 0.67 in diabetics). Meta-analysis of the global correlation between salivary glucose and HbA1c showed an overall association of medium strength (r = 0.37).
Conclusions:Our systematic review reports an overall meaningful salivary glucose concentration increase in type 2 DM and a significant overall relationship between salivary glucose concentration and associated glycemia/HbA1c values, with the strength of the correlation increasing for higher glycemia/HbA1c values. These results support the potential of salivary glucose levels as a biomarker for type 2 DM, providing a less painful/invasive method for screening type 2 DM, as well as for monitoring blood glucose levels in large cohorts of DM patients.
Citation: Mascarenhas P, Fatela B, Barahona I (2014) Effect of Diabetes Mellitus Type 2 on Salivary Glucose – A Systematic Review and Meta-Analysis of Observational Studies. PLoS ONE 9(7): e101706. doi:10.1371/journal.pone.0101706
Editor: Yan Gong, University of Florida, United States of America
Received February 12, 2014; Accepted June 10, 2014; Published July 15, 2014
Copyright: ß 2014 Mascarenhas et al. This is an open-access article distributed under the terms of the Creative Commons Attribution License, which permits unrestricted use, distribution, and reproduction in any medium, provided the original author and source are credited.
Funding: This work was supported by Egas Moniz grant # EMIB 2003-01 (http://www.egasmoniz.com.pt/pt-pt.aspx). The funders had no role in study design, data collection and analysis, decision to publish, or preparation of the manuscript.
Competing Interests: The authors have declared that no competing interests exist. * Email: [email protected]
Introduction
Early screening of type 2 diabetes mellitus (DM) is essential for improved prognosis and effective delay of clinical complications associated with diabetes, and has been suggested as an important strategy to lower the incidence of this disease worldwide [1–3]. To date, urine and blood tests are available for screening type 2 DM. However, urine tests suffer from several drawbacks. First, increases in blood sugar levels need to be large to be detected in urine. Second, urine accumulates over time, and is therefore more difficult to collect under ‘‘fasting’’ conditions than blood. For these reasons, blood testing, by needle finger pricks or blood draw, remains the standard for screening, monitoring and diagnosing diabetes, despite being invasive and painful. Moreover, these inconvenient techniques perturb daily life, cause anxiety and are difficult to do in long-term diabetics due to development of finger calluses, poor peripheral circulation and risk of infection. Recent studies have focused on the development of saliva-based tests for
screening or monitoring systemic diseases, including diabetes mellitus [4–6]. Saliva testing could potentially bypass the issues associated with both urine and blood tests: it is non-invasive and painless, and can be performed with ease at any time. Such an approach would be particularly useful in the young, in the elderly, and for large-scale screening or epidemiological interventions [7,8]. However, the effectiveness of saliva-based tests is still under debate.
Several primary studies have explored the use of salivary glucose to measure glycemia, with varying success [9]. In general, salivary glucose levels in type 2 DM patients seem to be higher than in non-diabetic controls [10–22]; however, this finding remains controversial, as in other studies no significant differences were detected [23–25], or only detected in DM patients that had poor metabolic control [26,27].
The correlation between salivary glucose and blood variables like glycemia or glycated hemoglobin (HbA1c) across type 2 DM and non-diabetic studies also shows some inconsistency in the
available bibliography. Among type 2 DM patients, some studies point to a high to medium strength correlation of salivary glucose with glycemia [9,13,20,21] despite other studies not finding any meaningful association [12,24,25,28] or, at most, a very weak one [18] and sometimes only significant in type 2 DM patients with a bad metabolic control of the disease [11,19]. Only a few studies have examined the correlation between salivary glucose and HbA1c, in type 2 DM patients, and found a medium strength correlation [13,21]. Finally, in non-diabetic individuals, some studies report that salivary glucose levels do not seem to be clearly correlated with glycemia or HbA1c [18,28,29] although others claim the opposite [20] or, at least, show a medium strength correlation between salivary glucose and glycemia [13,21,30]. These results have led some authors to suggest that monitoring the salivary glucose level can be useful to evaluate the glycemic status of type 2 diabetic patients [9,13,20,21,30] and potentially to screen for early diabetes [13,20], while others support that type 2 DM has an effect on salivary glucose but reject the idea of a consistent and direct relationship between unstimulated salivary glucose and glycemia [12,19,25,28,29].
With the latter in mind, we have performed a meta-analysis by combining published data on comparisons of mean salivary glucose levels in type 2 DM and healthy individuals, correlation studies between saliva glucose levels and glycemia/HbA1c, as well as our own unpublished results, to systematically assess whether salivary glucose can be used effectively to estimate blood glucose levels. We further discuss the potential of this approach for the diagnosis of early and late type 2 DM, and its possible use as a biomarker for diabetes or developing diabetes type 2 in large cohorts.
Materials and Methods
The unpublished results included in this systematic review and meta-analysis came from an original cross-sectional observational study performed at our dental clinic campus. Population, saliva collection and processing, salivary glucose measurement, blood collection and measurements, and statistical analysis sections below refer to our original study.
Population
Ethical permission for conducting this study was obtained from Egas Moniz Ethic Committee of Egas Moniz Cooperativa de Ensino Superior. Each participant signed the approved written informed consent where the purpose of the research was clearly stated; participation was entirely voluntary. Participants were divided in two different groups (Table 1): The first group consisted of 45 adult individuals of both sexes with a previous diagnosis of type 2 DM who were randomly selected from the Egas Moniz campus dental clinic patient’s population, Monte de Caparica, Portugal. The second group included 16 adult individuals of both sexes without the disease (control) randomly selected from the Monte de Caparica population, Portugal. Subjects with any other pathology/disease that could affect salivary glands function or with gingivitis at the time of the study were not included. Other exclusion criteria were pregnancy and alcoholism. Participants were asked to fast and abstain from smoking in the night and in the morning prior to the sampling.
Saliva collection and processing
Total unstimulated saliva was collected in the early morning from fasting subjects using the spitting method. Once the collected saliva filled at least 2 ml of a sterile standard container, it was centrifuged at 10.000 rpm for 30 minutes at 4uC. The sediment Table
1. Groups characteristics: number, average age, sex ratios, mean HbA1c, mean glycemia and poor metabolic control ratio of type 2 D M subjects. N = 30 N Average AGE AGE range Sex ratios Mean HbA1c (%) Mean glycemia (mg/dl) Poor metabolic control (HbA1c . 7,5%) Type 2 DM 45 66 [27–88] 2 2M,23F 7.3% 167.7 40% Control 1 6 6 0 [32–84] 7 M,9F 5.6% 107.4 NA NA: Not applicable; M: male; F : female doi:10.1371/journal.pone. 0101706.t001
was discarded and the samples were kept on ice and measured for glucose.
Salivary glucose measurement
Salivary glucose determination was performed with the colorimetric kit Glucose (GO) Assay (Sigma-Aldrich, Inc.) based on glucose-oxidase reaction. The standard protocol was adapted for 300ml microplates wells and five glucose solutions with the following concentrations: 0, 5, 10, 15 and 20mg/ml being used as standards. Absorbance values were measured at 540 nm (Bio-Rad microplate reader M680) as suggested in the manufacturer’s protocol.
Blood collection and measurements
A venous blood sample was obtained from each subject immediately after saliva collection and kept in a tube containing EDTA. Glycemia and HbA1c were measured through the following methods: Glycemia: electrochemical coulometry using a glucosimeter (Freestyle Precision - Abbots Diabetes Care Inc), yielding blood glucose in milligrams per deciliter (mg/dL), HbA1c: High Pressure Liquid Chromatography (D-10 Hemoglobin testing system – Bio-Rad Inc.), which gives the % of HbA1c fraction.
Statistical analysis
The normal distribution of the variables was confirmed by Kolmogorov-Smirnov test before the use of a Student t test for independent samples. Summary statistics obtained from the data included the mean and standard deviation (SD), and differences between samples were considered significant when p#0.05. Calculations were done using the statistical software SPSS version 19.0 (IBM, USA).
Literature search strategy
We performed a systematic search of PubMed (title search), Google Scholar (title search) and http://b-on.pt (title and keyword search) for peer-reviewed articles about comparisons of salivary glucose values on healthy/type 2 DM subjects and for peer-reviewed articles containing data on the correlation of salivary glucose with glycemia or HbA1c, published and available online as full text before July 2013. A complementary search was performed within the references cited by selected articles.
Mean salivary glucose levels. The search terms used to
screen for articles about the effect of diabetes mellitus type 2 on salivary glucose were ‘‘salivary and glucose’’, ‘‘glucose and saliva’’, ‘‘salivary and diabetic’’, ‘‘salivary and diabetes’’, ‘‘diabetes and salivary and glucose’’ and ‘‘diabetes and saliva and glucose’’.
Correlations with salivary glucose levels. The search
terms applied to retrieve articles relevant to salivary glucose correlation with glycemia or HbA1c issue were ‘‘saliva and blood and glucose’’, ‘‘salivary and glucose and correlation’’, ‘‘salivary and glucose and glycemia’’, ‘‘glucose and saliva and A1c’’, ‘‘glucose and saliva and correlation’’, ‘‘sugar and saliva and correlation’’, ‘‘glucose and saliva and association’’ and ‘‘sugar and saliva and association’’.
Literature screening
Papers were evaluated for their relevance first by assessing the title and second by abstract evaluation. The selected titles were then fully assessed for eligibility. Salivary glucose results in both concentration (e.g. mg/dl) and excretion rate (e.g. mg/dl/min) were accepted. Importance was given to saliva being collected as a whole (mixed saliva) after fasting for at least one hour (except for the salivary glucose/glycemia correlation data) and in an
unstimulated way, since previous saliva experiments performed in our lab without these constraints had yielded inconsistent results. Abstracts and papers in languages other than English were excluded and author(s) were asked for an English copy if possible. Two studies [11,15] with the same relevant data also present in posterior published reports [19,22] were excluded in favor of respective posterior reports. Records were also excluded if the full-text articles were not available online and the author(s) failed to send a copy or did not supply required supplementary data. Two studies [16,18] were rejected because the diabetic group was a mixture of type 2 and type 1 diabetic patients, potentially creating biases and heterogeneity in the diabetic sample that could skew the meta-analysis.
Mean salivary glucose levels. Studies were excluded unless
they consisted strictly of diabetes mellitus type 2 data versus healthy controls and were about unstimulated whole saliva collected under fasting conditions, with a fasting period of at least 1 hour.
Correlations with salivary glucose levels. Studies were
excluded unless they contained correlation data between glycemia or HbA1c and salivary glucose from unstimulated whole saliva collected from strict diabetic type 2 patients or in a healthy group of individuals. A fasting period of at least 1 hour was required prior to blood and saliva collection for studies to be included, if the correlation involved HbA1c. No fasting period was required for the inclusion of studies looking at correlations with glycemia.
Critical evaluation of data
Mean salivary glucose levels. Using the approach outlined
in the previous section, nine studies were selected, and combined with our own unpublished results. Means, standard deviations and sample sizes were collected from each study for the diabetic and control groups. In studies in which the diabetic group was split into two subsets, for instance controlled and uncontrolled diabetes [14,19], with periodontitis and without it [22], or obese and non-obese diabetics [10], the two were pooled and combined (or composite) sample sizes, means and standard deviations were calculated. Composite standard deviations were obtained as reported by Headrick [31], through the square root of the composite variance. Therefore, in studies with subsets some characteristics of diabetes may be distributed in the diabetic group in a non-random fashion. Although those studies were not removed from the review, they were classified as studies with increased risk of bias and treated as a subgroup in meta-analysis.
Correlations with salivary glucose levels. Six studies were
selected to assess the correlation between salivary glucose levels and glycemia (totaling seven studies with our unpublished data). Only two studies were selected from the screening for correlation with HbA1c, three after including our data. Correlation coeffi-cients, associated significance and sample sizes were collected from each study in order to perform the meta-analysis.
Power analysis
Post hoc power analysis for t test and ANOVA were undertaken using G*Power 3.1.5 software [32].
Meta-analysis
Meta-analysis calculations and graphical plots, except for forest plots, were performed with R version 3.0.0 [33] specific packages described below. Forest plots and associated calculations were made with OpenMeta[Analyst] 6.7.13 program [34] from studies results after effect sizes and associated 95% confidence intervals (CI) calculations. Quantity I2was measured to assess the degree of dispersion of effect sizes and the overall homogeneity statistical significance was calculated through the x2 test [35]. All tests were
two-tailed with alpha set at 0.05 except for homogeneity test whose significance level cutoff was considered to be 0.10 due to the low power of the x2 test with a limited amount of studies.
Mean salivary glucose levels. Since not all reported means
were using the same units for salivary glucose, a Hedge’s standardized mean difference g was first calculated as effect size (ES). Hedge’s g is a group difference ES index used to measure the magnitude of difference between two groups. It is resilient to variation in sample sizes, and allows for a standardized compar-ison across studies using different measures for the same variable. Calculation of this index is important since large g values indicate a better clinical applicability of the identified differences. We followed Cohen’s [36] conservative conventions for Hedge’s g effects: small $0.20, medium $0.50 and large $0.80. Confidence Intervals (CI) associated with each g ES index were used to assess the reliability of the effect, since a wide CI are an important way to evaluate the precision of a study’s findings by providing a range of likely values around the obtained g ES. To further evaluate and discuss g ES results we followed Coe’s interpretation table for ES [37]. For Hedge’s g calculations and for graphical plot generation, salivary glucose means, standard deviations and sample sizes were inserted in R version 3.0.0 as raw data, and fed to the R packages ‘MAd’ for Hedge’s g ES and CI calculation and to ‘Metafor’ to build the random effects aggregation model (DerSimonian-Laird
method) followed by graphical plotting. Diabetic group allocation (with subsets, without subsets) was used as grouping factor in the model, since sample allocation heterogeneity can be an important source of bias in meta-analysis [38]. The following moderator candidates were evaluated through a mixed-effects meta-regres-sion model: mean age difference between the two groups (type 2 DM versus control), mean age of the diabetic group and fasting hours prior to sample collection, and statistical power of the study. The possibility of publication bias was evaluated using a Begg’s contour-enhanced funnel plot corrected with the trimfill function of R ‘‘Metafor’’ package.
Correlations with salivary glucose levels. To evaluate the
global correlation strength between salivary glucose level and glycemia or HbA1c, Pearson correlation coefficients (r) and sample size values were collected from each study and used to calculate ES estimates as transformed Fisher-z coefficients and associated standard errors through the respective formulas. This is a necessary step because although r is the most commonly used strength of association ES index, calculating standard errors for such correlation coefficients is difficult. Moreover, the distribution of r becomes skewed as the population value of r deviates from zero, and converting r to Fisher’s z corrects for this skew [39]. Finally, we ran our normalized Fisher-z data through the R package ‘meta’ metagen function to calculate an overall normal-ized Fisher-z, using a random effects model (DerSimonian-Laird method), and through the ‘metafor’ R package for graphical plot generation. The data from diabetic and non-diabetic studies were aggregated both as a whole and as subgroups in the analysis. Finally, in order to place the overall ES back in a correlation framework, we converted the aggregated Fisher-z data back to Pearson’s r correlation coefficients running the R package ‘psych’ fisherz2r transformation function, and applied Cohen’s conven-tions [36] for r effect evaluation: small $0.10, medium $0.30 and large $0.50. High r values indicate a stronger correlation.
To evaluate if the strength of the association between salivary glucose and glycemia/HbA1c increased with the higher values of glycemia/HbA1c typically associated with type 2 DM we applied again an r to z Fisher transformation to the correlation data and calculated respective standard errors from each study containing estimates for both diabetic and control groups. Afterwards we estimated Cohen’s q ES statistic [36], a measure of the difference between Fisher-z results across the diabetic and control groups. Cohen’s q ES standard errors were calculated using standard error propagation estimations from Fisher-z data standard errors. Aggregated Cohen’s q ES were calculated as previously reported for overall Fisher-z values. To evaluate these overall ES we followed Cohen’s conventions for q effects [36]: small $0.10, medium $0.30, large $0.50. If the associated CI did not overlap with zero, the effect was considered significant, as this suggests that Cohen’s q scores are likely to represent a true difference. High q values indicate a meaningful difference between two correlations.
Results
Flow of study selection
Mean salivary glucose levels. The flow of study selection
for the mean salivary levels is displayed in Figure 1. Our database search initially retrieved 4040 records. After screening for relevant titles, we excluded 3982 records that were either not relevant or duplicated, and identified 63 potentially relevant studies that were assigned for abstract level evaluation. Four additional non-duplicated relevant records were identified through references found in the selected articles, and pooled with the other 63 potentially relevant studies. Among these, 9 records were selected Figure 1. Flow of study selection for mean salivary glucose
levels. *Studies were excluded unless contained salivary glucose data (means, standard deviations and sample size) obtained from strictly diabetes mellitus type 2 patients and non-diabetic controls unstimu-lated whole saliva collected after a minimum fast period of 2 hours. Were also excluded if the full-text article were not available and the author(s) failed in sending a copy after contact request or failed in giving back supplementary required data inexistent in the original article. Records containing data already published in other article were also excluded.
Table 2. Characteristics of studies included in the salivary glucose means and correlation meta-analysis. Data S tudy Country Type 2 D M population Control population Study population exclusion criteria Fasting o n collection Salivary g lucose measurement Outcome Salivary glucose correlation w ith glycemia in healthy individuals ¥ Yamaguchi 1998 Japan The subjects in the study were six healthy y oung local men m easured along 3 d ays Affected with pyorrhea alveolavis . Overnight GOD-POD method F ound a significant low correlation b etween salivary glucose level and g lycemia ¥ Salivary glucose correlation w ith glycemia in type 2 D M individuals Amer 2001 P akistan 135 D M p atients at the Diabetic OPD clinic of the Liaquat N ational Hospital 25 healthy local individuals Unknown Not reported GOD-PAP method A significant correlation w as found between salivary glucose and g lycemia in the diabetic group. Salivary glucose in obese and non-obese** type 2 diabetics and controls Aydin 2 007 Turkey 40 patients referred by the Endocrinology Service of the Firat Medical Center equally divided in two subsets**: obese (BMI . 30 kg/m2) and n on-obese (BMI , 25 kg/m2) 22 clinically healthy humans Pregnancy, alcohol consumption, tobacco products (former and current), other chronic medical illness, history of drug treatment or therapy w ithin the previous months Overnight GOD-POD method S alivary glucose levels w ere significantly higher in obese a nd non-obese** diabetic subjects than in controls Salivary glucose correlation w ith glycemia in healthy individuals Soares 2009 Brazil 63 healthy p atients at the dental clinic of the Federal University of Paraı ´ba Smokers and taking any medication, oral pathology At least 90 min GOD-POD method D id not found a significant correlation b etween salivary glucose a nd glycemia in healthy individuals Salivary glucose in type 2 diabetics and controls Vaziri 2010 Iran 40 patients from the Hamadan C enter of Diabetes Research 20 healthy subjects From Besat Hospital without medication o ther than vitamins or occasional analgesics Pregnancy, alcoholism, smoking, any o ther chronic d isease Overnight GOD-POD method N o significant d ifferences in salivary glucose concentrations between type 2 diabetic patients and control subjects Salivary glucose in type 2 diabetics and controls Hegde 2010 India 2 6 D M subjects attending Kasturba medical college hospital 21 healthy subjects attending Kasturba medical college hospital Any other systemic disease Overnight GOD-POD method S alivary glucose d id not d iffer between the two g roups Salivary glucose in type 2 diabetics and controls Vasconcelos 2010 B razil 40 patients from Paraiba university clinic centers 40 local healthy volunteers Smoking, alcoholism, pregnancy, head and neck radiotherapy, autoimmune disease At least 90 min GOD-POD method S alivary glucose level were significantly higher in diabetic subjects than in controls and correlation w ith glycemia were not significant in both D M a nd control g roups D Salivary glucose values and correlation w ith glycemia data £ from two different studies** regarding type 2 diabetics and controls Panchbhai 2 012 India T wo studies with the sum of 180 patients from W ardha college and hospital equally divided in two subsets**: controlled and u ncontrolled Two studies with the sum o f 9 0 local healthy subjects Any other systemic disease, severe DM complications At least 2 hours GOD-POD method S alivary glucose levels w ere significantly higher in controlled and u ncontrolled d iabetic** subjects than in controls, no significant d ifferences between in uncontrolled and controlled diabetic subjects. Correlation coefficients with glycemia were low and only significant in u ncontrolled DM patients £
Table 2. Cont. Data S tudy Country Type 2 D M population Control population Study population exclusion criteria Fasting o n collection Salivary g lucose measurement Outcome Salivary glucose in type 2 diabetics and controls 1and correlation d ata with glycemia/ HbA1c Mahdavi 2012 Iran 52 patients at central laboratory of Yazd 47 subjects patients at central laboratory of Yazd Chemotherapy o r head and neck radiotherapy, dry mouth, Sjogren syndrome, heart disease, pregnancy, severe periodontitis , drug abuse, gland surgery. Overnight GOD-PAP method Salivary glucose v alues were higher among d iabetics than in controls. Found a significant m edium strength correlation b etween salivary glucose a nd glycemia and a medium strength o ne between salivary glucose and HbA 1c in diabetics. In non-diabetics, it was found a medium strength correlation between salivary glucose a nd glycemia. Salivary glucose in type 2 diabetics and controls and correlation d ata with glycemia/ HbA1c Abikshyeet 2012 India 1 06 patients newly diagnosed attending diabetic clinic 15 local healthy volunteers Any other systemic disease, smoking, alcoholism Overnight GOD-POD method S alivary glucose v alues were higher a mong diabetics than in the controls. Authors found a h ighly significant correlation b etween salivary glucose level and g lycemia/ HbA1c Salivary glucose in controlled and uncontrolled type 2 diabetics** and controls Al-Zahawi 2012 Iraq 60 patients from Erbil city health center equally divided in two subsets**: controlled and u ncontrolled 30 non-diabetic patients from Erbil city health center Any other systemic disease, severe DM complications, medication o ther than for d iabetes At least 2 hours GOD-POD method F ound significant d ifferences in salivary glucose concentrations between type 2 controlled/ uncontrolled d iabetic patients** and control subjects, no significant d ifferences between uncontrolled a nd controlled diabetic subjects Salivary glucose in type 2 diabetics and controls and correlation d ata with glycemia Manjrekar 2012 India 2 3 p atients from the Clinical Biochemistry laboratory of Kasturba Medical College Hospital 23 healthy controls with no family history of diabetes history of infection in the p ast three months, chronic alcoholics, pregnancy Overnight GOD-POD method S alivary glucose d id not d iffer significantly between the two groups neither correlation w ith glycemia were meaningful Salivary glucose in type 2 diabetics with and w ithout periodontitis **and controls with* a nd without periodontitis Lasisi 2012 Nigeria 20 diabetic patients at university of Ibadan hospital equally divided in two subsets**: with periodontitis ,a n d without it 20 non-diabetics from University of Ibadan equally divided in two subsets: with periodontitis *, and without it Not reported Overnight GOD-POD method S alivary glucose level of diabetic patients was found to be significantly higher compared w ith non diabetic subjects irrespective o f periodontal d isease, n o significant d ifferences between d iabetic subjects with or without periodontitis .
after full-text article assessment and combined with our unpub-lished data, adding up to a final cluster of 10 studies.
Correlations with salivary glucose levels. A new
elec-tronic search was made following a similar procedure as the previous one, producing 3286 references. The examination of the titles allowed us to reject 3270 records that were not relevant, and retrieve a preliminary list of 16 potentially relevant studies. Of these, 4 were selected after abstract and full-text assessment, to which we added one non-duplicated eligible article identified in our previous search for ‘‘salivary glucose means’’, and our unpublished data, resulting in a final cluster of 7 studies.
Studies characteristics
Table 2 lists the main characteristics of the 14 studies, including our own. Ten of these were included in the meta-analysis of salivary glucose means (Fig. 2), adding up to a total sample of 580 type 2 DM patients and 297 non-diabetic controls. From these studies, only 7 were included in the meta-analysis of salivary glucose and glycemia/HbA1c correlation (Figs. 3 and 4). These studies included articles published between 1998 and 2012 and our own unpublished report. Four studies were based in India, two in Brazil and two in Iran. The remaining studies all took place in different countries: Turkey, Iraq, Nigeria, Japan, Pakistan and Portugal. The majority of the studies were conducted on patients of clinics or hospital centers, which allocated them into different diabetic groups. All the studies except one adopted exclusion criteria regarding the population sampling for type 2 DM and/or control groups, although the adopted criteria were not the same for all the studies. The majority of the studies complied with an overnight fasting period prior to sampling, two studies guaranteed only 2 hours of fasting before sampling, and another two studies reported a minimum of 90 minutes of fasting; in one study that information was not reported. Type 2 DM participant’s informa-tion about diabetes durainforma-tion, concomitant medicainforma-tions or addi-tional disorders was missing in all studies. In two studies salivary glucose was measured through the glucose oxidase/phenol and aminophenazone method (GOD-PAP), while in the remaining studies the glucose oxidase-peroxidase method (GOD-POD) was used. Significant differences in salivary glucose between type 2 DM and healthy controls were reported in 7 studies. Among the 7 studies that examined the correlation between salivary glucose and glycemia, 5 reported results on type 2 diabetics while 6 reported results on healthy individuals. Only 3 studies reported glucose/ HbA1c correlation data in type 2 diabetics, of which only 2 also examined healthy individuals.
Data analysis
Mean salivary glucose levels. Initially we established which salivary glucose sampling conditions (e.g. minimum fasting period) were needed to obtain consistent salivary glucose measurements in our experiment, an essential step for the detection of differences in salivary glucose levels between type 2 DM and non-diabetics. Table 3 shows the salivary glucose measurements taken from 45 diabetics and 16 controls, all of them fasting individuals. These results were included in the standardized mean difference meta-analysis and show a very significant difference (p,0.01) between the salivary glucose values obtained from diabetic and control groups.
We evaluated test significance, power, Hedge’s g and ES interpretation according to Cohen’s conventions for each of the studies included in the meta-analysis (including our own, Table 4). Three studies failed to detect significant differences between the type 2 DM and control groups (p.0.1) [23–25], probably because they used samples of small or medium sizes, and were likely to be
Table 2. Cont. Data S tudy Country Type 2 D M population Control population Study population exclusion criteria Fasting o n collection Salivary g lucose measurement Outcome Salivary glucose in type 2 diabetics and controls and correlation d ata with glycemia/ HbA1c Own unpublished data 2013 Portugal 4 5 subjects selected from the Egas Moniz campus dental clinic, adult p atient’s population 16 local healthy subjects Other p athology/disease that could affect salivary glands function o r w ith gingivitis at the time of the study, p regnancy and alcoholism Overnight GOD-POD method Salivary glucose values were higher among diabetics than in the controls. Found a significant m edium strength correlation between salivary glucose level a nd glycemia/ HbA1c only in diabetics. DM: diabetes mellitus ; GOD-POD: glucose o xidase-peroxidase method for g lucose estimation; GOD-PAP: glucose o xidase/phenol + aminophenazone. *These d ata were not included in the meta-analysis; **this sets of data were combined (merged) before inclusion in the meta-analysis as a subgroup of studies; £not included in meta-analysis, since salivary glucose/glycem ia correlation g lobal values for type 2 DM (for both controlled and uncontrolled subje cts and for both studies) and controls (for both studies) were not available o n the article, and the author failed to provide that information after request; Dnot included in m eta-analysis, since no correlation a nd significance values on salivary glucose a nd/or glycemia correlation w ere posted on the arti cle, and the author failed to provide that information a fter request; 1not included in m eta-analysis, since no standard deviation d ata were p resent o n salivary glucose m ean results on the article, and the author failed to provide that information after request; ¥The correlation coefficient w ere obtained from 3 days o f measurements on six individuals. doi:10.1371/journal.p one.0101706.t002
underpowered (i.e. power ,0.80), which may account for the lack of statistically significant effects identified in ANOVA and t tests. The other seven studies, where significant differences were found (p,0.05), were all well-powered studies (power .0.80), with the exception of Vasconcelos study [12] with 75% of power. All studies except one [25] found an increase in salivary glucose concentration/secretion in type 2 diabetics, yielding an estimated medium to large positive effect. Furthermore, the overall positive large Hedge’s g ES (1.37), obtained by applying a random effects model to the combined results of the studies of mean salivary
glucose, also suggests a meaningful difference between the DM results and those from non-diabetic controls.
To have an historical perspective of this effect we plotted a cumulative forest plot. In Fig. 5 we can observe that earlier studies suggested a larger positive effect than the one obtained from analyzing the whole available dataset but also had lesser precision (represented by an increased CI) than the actual overall aggregated studies.
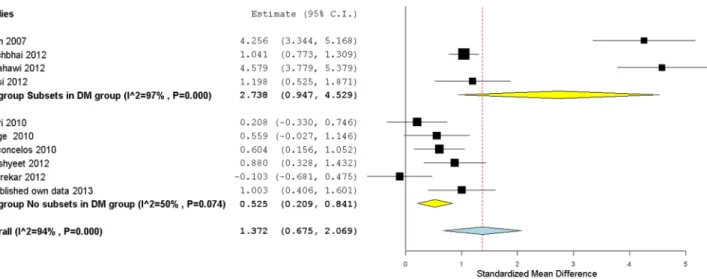
To acknowledge for the possible contribution of a selection bias to heterogeneity in the overall model regarding DM sample allocation type (with and without subsets), we performed a subgroup meta-analysis (Fig. 2) using the Hedge’s g data from all selected studies (including our own) grouped in two clusters: one containing studies with subsets in the DM group (mixture of DM patients previously allocated to two groups) and the other one without subsets in the DM group. We verified that there was significant heterogeneity among all studies (I2= 94%, p,0.10) but also within subgroups (p,0.10). The subgroup analysis (Fig. 2) showed that a substantial fraction of the heterogeneity came from studies with DM group subsets. If we look at the other subgroup of studies (without subsets), the heterogeneity value decreases to 50%. Furthermore, the latter shows an overall effect value of 0.52 (medium effect), with a [0.21,0.84] CI, which is smaller than the aggregated ES value for the combined dataset (1.37[0.67,2.07]; large effect), and also smaller than the value obtained for the subgroup with subsets of type 2 DM, which presents the largest ES (2.74[0.95,4.53]). The precision of the estimates of ES, all non-overlapping with zero CI, also differed between the subgroups, with the subgroup containing subsets of type 2 DM patients showing the widest CI. Therefore, results show that randomization in type 2 DM sampling is an important factor that affects the reliability of salivary glucose levels.
Since significant heterogeneity was detected even in the subgroup without subsets of DM patients, we further investigated the potential contribution of some candidate moderators: mean age difference between the two groups, mean age of the diabetic group, fasting hours prior to sample collection and study statistical power. To do so, we included them in a mixed-effects meta-regression model, which failed to detect a significant effect for any Figure 2. Subgroup forest plot of type 2 DM mean salivary glucose levels studies. Studies have been grouped according to the type 2 DM group allocation: with or without subsets. Hedge’s g (standardized mean difference) effect size estimates have been calculated with 95% confidence intervals and are shown in the figure. Area of squares represents sample size, continuous horizontal lines and diamonds width represents 95% confidence interval. Yellow diamonds center indicates the subgroup pooled estimates while the blue diamond center and the vertical red dotted line both point to the overall pooled estimate. For more detailed results see Table 2 and 4.
doi:10.1371/journal.pone.0101706.g002
Figure 3. Contour-enhanced funnel plot with publication bias correction for the studies without type 2 DM subsets. Under the sensitivity analysis of the results to publication bias a trim and fill white dot was added and the plot was horizontally adjusted to maximize the dots distribution symmetry. The white region in the middle corresponds to values greater than 0.1, the gray-shaded region corresponds to p-values between 0.1 and 0.05, the dark gray-shaded region corresponds to p-values between 0.05 and 0.01, and the region outside of the funnel corresponds to p-values below 0.01.
of them. Finally, we tested for an eventual publication bias among the subgroup of studies with no subsets of type 2 DM (Fig. 3) by applying the trim and fill correction [39]. This adjustment, with the addition of one virtual ‘‘no effect’’ study, decreased the overall ES in this subgroup from 0.52 (medium effect) to 0.44 (small-medium effect) and increased I2from 50% to 58%.
Correlations with Salivary glucose levels. The results
from our meta-analysis of mean glucose levels prompted us to further analyze the correlation between salivary glucose and glycemia (Table 5) or HbA1c (Table 6). Our own unpublished results, posted in Table 3, yield significant correlations (p,0.05) between salivary glucose and glycemia/HbA1c only in the type 2 DM group, and even then only a low strength correlation was found.
Glycemia. Table 5 summarizes the correlations reported
between salivary glucose levels and glycemia for the type 2 DM group: three studies found a high correlation [9,13,21], one study reported no correlation [25] and our own study detected a medium-strength one. In the control group, the values were on average lower, with half of the studies (including our own) reporting no correlation, while the other half found medium to weak correlations.
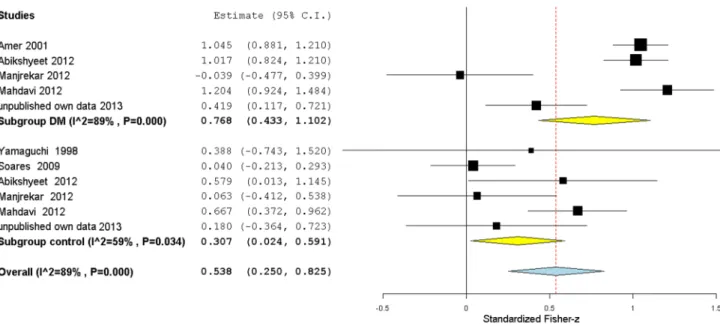
To assess the general ES of the correlation between glycemia and salivary glucose, we performed a subgroup meta-analysis (Fig 4) using the correlation coefficients data from all the selected studies (including our own), transformed into Fisher-z ES estimates (see Methods for more details), and grouped into two clusters: one containing studies of type 2 DM patients and the other one containing studies that included non-diabetic subjects. The overall Fisher-z results were again converted to the more intuitive Pearson’s r correlation coefficients.
There was significantly high heterogeneity amount among all studies (I2= 89%, p,0.10) and within the DM subgroup (I2= 89%, p,0.10), while in the control subgroup heterogeneity, while still significant, was lower (I2= 59%, p,0.10). The diabetic subgroup included four published reports and our own results and showed a large overall correlation (r = 0.67/z = 0.77[0.43,1.10]) between salivary glucose and blood glucose, while for the control group the combined correlation was smaller (r = 0.30/ z = 0.31[0.02,0.59], medium effect). The overall correlation coefficient when both subgroups were included, was 0.49 (z = 0.54[0.25,0.82]) (medium-large effect). All these three corre-lation coefficients came from Fisher-z values, and had CI similar in precision and non-overlapping with zero. The larger correlation observed for the DM subgroup suggests that, in type 2 diabetic Figure 4. Subgroup forest plot of salivary glucose levels correlations with glycemia. Studies have been grouped according to the sample group type: type 2 diabetics or non-diabetics (control). Standardized Fisher-z effect size estimates have been calculated with 95% confidence intervals and have been aggregated (random effects model). Area of squares represents sample size, continuous horizontal lines and diamonds width represents 95% confidence interval. Yellow diamonds center indicates the subgroup pooled estimates while the blue diamond center and the vertical red dotted line both point to the overall pooled estimate. For more detailed results see Table 2 and 5.
doi:10.1371/journal.pone.0101706.g004
Table 3. Salivary glucose correlations, means and standard deviation (sd) results in type 2 DM group versus control.
Type 2 DM (mean±sd) N = 45 Control (mean±sd) N = 16
Salivary glucosemg/ml 0.8860.24* 0.5660.47
Salivary glucose/glycemia correlation 0.40** 0.17
Salivary glucose/HbA1c correlation 0.34** 0.08
N- sample size. *significantly different from control group (p,0.01); **medium strength significant correlations (p,0.05). according to Cohen’s convention [36] for r effects.
patients, increases in glycemia are paired with a stronger positive effect on the level of salivary glucose compared with non-diabetic individuals. The correlation appears to be stronger for higher values of glycemia. To further support this possibility we tested the effect of type 2 DM (i.e. glycemia increase) on r strength applying the Cohen’s q statistic.
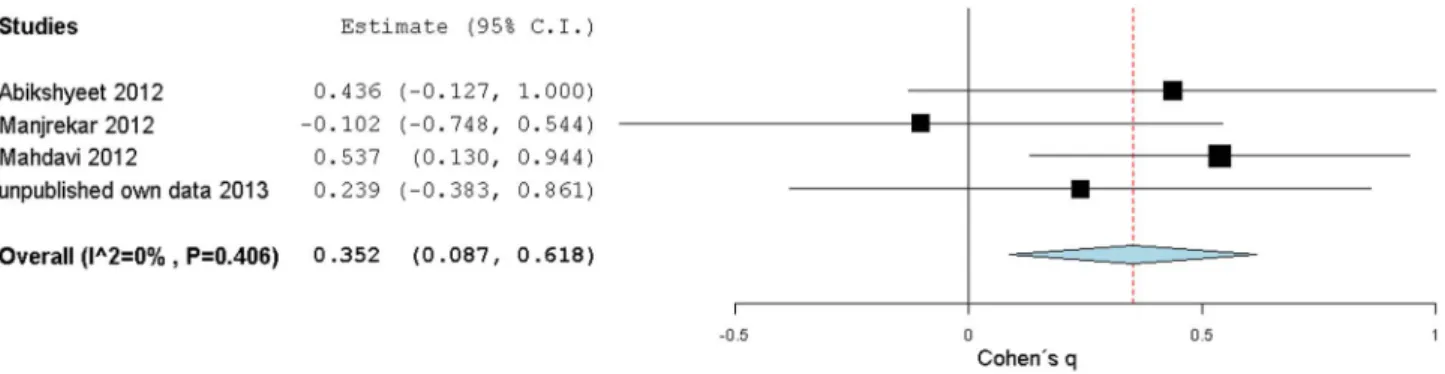
In four studies, it was possible to calculate Cohen’s q statistic. Cohen’s q results were not consistent, and varied from a large ES to an absence of meaningful effect. These q values were used as ES estimates to build a random effects model, as shown in Fig. 6. Overall, the Cohen’s q results estimated a significant medium strength 0.35[0.09,0.62] ES, with a non-overlapping zero CI, confirming a stronger correlation between salivary glucose and glycemia in type 2 DM relative to the non-diabetic control.
HbA1c. A summary of the meta-analysis of the correlation
between salivary glucose and HbA1c is presented in Fig. 4. It included two published reports, in addition to our own results, for the diabetic subgroup, and only one published report, as well as our own data, for the non-diabetic control subgroup. All studies reported a medium correlation in the diabetic subgroup, while for the non-diabetic subgroup both studies failed to detect a significant correlation (Table 6).
It should be noted that, given their more straightforward physiological link, the correlation between salivary glucose and glycemia is expected to be stronger than between salivary glucose and HbA1c, and so it is unsurprising that the correlation values present in Table 5 are in average higher than the one’s present in Table 6.
Table 4. Total sample size (N), significance (Sig.), power, Hedge’s g and effect size evaluation of 10 salivary glucose observational studies in type 2 DM subjects and controls.
Study N DM/control Sig. Power Hedge’sg Effect size evaluation
Aydin 2007 * 40/22 ,0.0001£,D 99.99% 4.256 large Vaziri 2010 40/20 0.1900£ 11.77% 0.208 small Hegde 2010 26/21 0.28301 47.54% 0.559 medium Vasconcelos 2010 40/40 0.0360£,D 74.88% 0.604 medium Panchbhai 2012 * 180/90 ,0.0001£,D 99.99% 1.041 large Abikshyeet 2012 106/15 0.0017£,D 88.54% 0.880 large Al-Zahawi 2012 * 60/30 ,0.0001£,D 99.99% 4.579 large Manjrekar 2012 23/23 0.7241£ 6.39% 20.103 no effect Lasisi 2012 * 20/20 0.0004£,D 96.44% 1.198 large
Own unpublished data 2013 45/16 0.0009£,D
96.10% 1.003 large
Aggregated data (random effects model) 580/297 ,0.0001** 99.99% 1,372 large
Power values are relative to Hedge’s g effect sizes for each study and aggregated data. Effect size evaluation was made following Cohen’s conventions [36] for Hedge’s g effects: small $0.20, medium $0.50, large $0.80.
£
t test significance,1
ANOVA significance, * combined data from type 2 DM subsets, ** omnibus random effects model significance,D
zsignificant (p,0.05). doi:10.1371/journal.pone.0101706.t004
Figure 5. Cumulative forest plot of type 2 DM mean salivary glucose levels studies. Ten studies have been added and aggregated (random effects model). Hedge’s g (standardized mean difference) effect size estimates have been calculated with 95% confidence intervals in a cumulative and chronological way. Area of squares represents sample size, continuous horizontal lines represents 95% confidence interval and the vertical red dotted line indicates the pooled random effect weighted estimate.
Table 5. Results on correlation (R) between salivary glucose and glycemia with Cohen’s q effect size assessment. Glycemia versus salivary glucose D iabetic sample Control Cohen’s q ± SE Effect size evaluation N R Sig N R Sig -Yamaguchi 1 998 -6 0 ,370 , 0,05 -Amer 2001 135 0.780 , 0.01 -Soares 2009 -6 3 0 .004 . 0.05 -Abikshyeet 2012 106 0.768 , 0.01 15 0.522 , 0.01 0.44 6 0.30 medium Manjrekar 2012 23 2 0.039 . 0.05 20 0.063 . 0.05 0.10 6 0.33 no effect Mahdavi 2012 52 0.835 , 0.05 47 0.583 , 0.05 0.54 6 0.21 large Own unpublished data 2013 4 5 0.396 , 0.05 16 0.178 . 0.05 0.24 6 0.32 small Aggregated data (random effects model) 361 0.67 , 0.0001** 167 0.30 , 0.0001** 0.35 ± 0.14 medium Total sample size (N), correlation coefficients (R) and correlation coefficients significance (Sig). Type 2 DM effect on correlation assessment w a s made through Cohen’s q statistic. ** omnibus random effects model significance. doi:10.1371/journal.pone. 0101706.t005 Table 6. Results on correlation (R) between salivary glucose and HbA1c with Cohen’s q effect size assessment. HbA1c versus salivary g lucose Diabetic sample Control Cohen’s q ± SE Effect size evaluation N R Sig N R Sig -Abikshyeet 2012 96 0.566 , 0.01 -Mahdavi 2012 52 0.516 , 0.05 47 0.112 . 0.05 0.46 6 0.21 medium Own unpublished data 2013 4 5 0.341 , 0.05 16 0.082 . 0.05 0.27 6 0.32 small Aggregated data (random effects model) 193 0.55 , 0.0001** 6 3 0 .11 , 0.0001** 0 .40 ± 0.17 medium Total sample size (N), correlation coefficients (R) and correlation coefficients significance (Sig). Type 2 DM effect on correlation assessment w a s made through Cohen’s q statistic. ** omnibus random effects model significance. doi:10.1371/journal.pone. 0101706.t006
Once again, to estimate the overall correlation between HbA1c and salivary glucose, a subgroup meta-analysis was performed (Fig. 7) using Fisher-z transformed data from all selected studies (including our own) grouped into two clusters: one containing studies in type 2 DM patients and the other one containing studies that included non-diabetic control subjects. The meta-analysis yielded an overall medium correlation (r = 0.37/ z = 0.39[0.17,0.62]) between salivary glucose and HbA1c with Fisher-z CI non-overlapping with zero. In the diabetic studies subgroup the correlation was stronger (r = 0.50/ z = 0.55[0.39,0.71]) with Fisher’s z CI non-overlapping with zero while a non-significant correlation (r = 0.11/z = 0.11[20.15,0.36]) was found in the non-diabetic subgroup. Similar to what we observed for the glycemia/salivary glucose correlation, our estimates of the correlation between HbA1c and salivary glucose for type 2 DM and control subgroups (Figs. 7) suggest that, in type 2 diabetic patients, increases in HbA1c values are more strongly correlated with increases in salivary glucose than in non-diabetic control groups, where HbA1c values are on average smaller. There was overall high heterogeneity among all the studies (I2<65%, p,0.10). A subgroup analysis showed that a significant fraction of the heterogeneity originated from the diabetic studies,
while in the other subgroup of studies (without diabetics), the level of heterogeneity is low.
The correlations between HbA1c and salivary glucose for type 2 DM and control subgroups were compared using Cohen’s q statistic in two studies, in the one from Mahdavi [21] and in our own, showed a medium and a small ES, respectively. These results were used as ES estimates to build a random effects model, which yielded an overall medium strength q ES of 0.40[0.06,0.74] (CI non-overlapping with zero but with low precision, Fig. 8). Cohen’s q ES meta-analysis result shows that the correlation between salivary glucose and HbA1c mirrors the previous correlation behavior between salivary glucose and glycemia, in that correla-tions are stronger within type 2 DM groups (or for increased glycemia) then in the non-diabetic control groups.
Discussion
We have performed the first systematic review of the effect of type 2 DM on salivary glucose levels, to evaluate if the increase in salivary glucose levels associated with type 2 DM is both strong and consistent enough to substantiate salivary glucose as a potential type 2 DM biomarker. This evaluation was motivated by the historical controversy surrounding this issue, with some Figure 6. Forest plot from DM condition effect on salivary glucose levels correlations with glycemia. Cohen’s q (standardized Fisher-z difference between diabetic and control groups) effect size estimates have been calculated with 95% confidence intervals and have been aggregated (random effects model). Area of squares represents sample size, continuous horizontal lines and diamonds width represents 95% confidence interval and the diamonds centre and vertical red dotted line indicates the pooled random effect weighted estimate. For more detailed results see Table 5. doi:10.1371/journal.pone.0101706.g006
Figure 7. Subgroup forest plot of salivary glucose levels correlations with HbA1c. Studies have been grouped according to the sample group type: type 2 diabetics or non-diabetics (control). Standardized Fisher-z effect size estimates have been calculated with 95% confidence intervals and have been aggregated (random effects model). Area of squares represents sample size, continuous horizontal lines and diamonds width represents 95% confidence interval. Yellow diamonds center indicates the subgroup pooled estimates while the blue diamond center and the vertical red dotted line both point to the overall pooled estimate. For more detailed results see Table 2 and 6.
authors defending the idea that salivary glucose based tests have the potential to become an effective and non-invasive method for diagnosing or monitoring DM, and others vividly dismissing it.
A few previous reports of salivary glucose measurements in diabetic patients included reviews of this subject, but mainly from a qualitative point of view. Furthermore, strict criteria for study inclusion were not always adopted or explicit, and differences regarding sample allocation and experimental design were generally not taken into account, potentially leading to increased selection bias. These earlier reviews (see Introduction) often disagree on the size of the difference between salivary glucose levels in type 2 DM and non-diabetics based on null-hypothesis significance testing data, and on the strength of the correlation between glycemia/HbA1c and salivary glucose, all of which are essential to assess the potential of salivary glucose for screening potential diabetic patients.
We also found that, over the years, the global Hedge’s g ES of type 2 DM on salivary glucose changed from an initial imprecise but very high value to the current more precise and significant large value of 1.37. This progression may be a consequence of the legacy of a publication bias, or of non-random allocation of type 2 DM patients, with a recent adoption of a stricter glycemic control by type 2 DM patients, in combination with the increased precision in overall estimates achieved by increasing the number of studies included in meta-analysis. In this review, we tried to minimize study selection bias by including only published reports where saliva was being collected under similar conditions as the ones we used in our experiments.
The large overall ES value obtained from the standardized mean difference meta-analysis (1.37), according to Coe’s interpre-tation table for standardized mean difference ES [37], means that the probability that the salivary glucose level of a type 2 DM patient exceeds the salivary glucose level of a non-diabetic is 83%, if both are chosen at random. Accordingly, the average salivary glucose score of a type 2 DM patient exceeds 91% of control salivary glucose levels values. Global ES estimates obtained from aggregated type 2 DM and non-diabetic controls studies of the correlation between salivary glucose and glycemia/HbA1c yielded consistent medium to large effects (0.49/0.37), which increased further in strength when the correlation synthesis was limited to data from type 2 DM patients (0.67/0.50), which had, on average, higher glycemia/HbA1c values. This stronger correlation within the type 2 DM subgroup suggests that the salivary glucose secretion rate increase is somehow more strongly paired with blood glucose/HbA1c on a chronic hyperglycemia background, as previously reported by Abikshyeet [13]. It is known that DM chronic hyperglycemia leads to microvasculature structural
changes, as well as basement membrane alterations in salivary glands and soft oral tissues [40–42]. These changes result in leaky salivary glands and soft oral tissues, leading to an increase on the glucose diffusion rate from the blood to the oral cavity [13,43]. These oral physiological changes associated with DM could therefore explain the increase in the strength of the correlation between the salivary glucose and glycemia/HbA1c in the type 2 DM subgroup.
In the non-diabetic control groups, the results of our meta-analysis of the correlation of salivary glucose levels showed a medium effect with glycemia and a non-significant effect with HbA1c. This lower effect may be related with a less permeable salivary glands/oral mucosa present in healthy individuals and/or with a possible detection limit of the employed glucose measure-ment technique (GOD-POD/GOD-PAP) for very low concentra-tions of salivary glucose. If the latter is true, saliva-based tests may be of limited use to monitor blood glucose levels in non-diabetics or diabetics with very good metabolic control of the disease.
There are other potential limitations to this systematic review. One potential source of bias includes the possible misclassification of subjects into the control or DM groups. Another issue is that our findings are based on the results of observational studies and that we can therefore not exclude the presence of confounding factors, especially relevant when ES are not very high. Studies included in our systematic review did not consistently report some important sample-related potential moderators, such as mean duration of DM, and status of glycemic control and treatment, preventing these variables from being tested as sources of heterogeneity. These factors, combined with differences in the procedures used in each study, may confound the outcome and partly explain the significant amount of heterogeneity detected in the meta-analyses of salivary glucose means and correlations. Heterogeneity may also be due to the presence of subsets (obesity, bad metabolic control or periodontitis) in type 2 DM groups that may change the proportion of patients with poor metabolic control. Furthermore, the lack of statistical significance found for the effect of tested moderators on the heterogeneity should be seen with caution, because of the limited statistical power provided by the small number of studies included in the meta-regression model. Up to now, no studies have examined the sensitivity/specificity of salivary glucose testing for evaluating blood glucose or even screening or monitoring type 2 DM. In the future, it will be important to define the predictive power of salivary glucose to estimate glycemia/HbA1c levels as well as its sensitivity and specificity. Despite these limitations and the reduced number of observational studies reviewed, some of them with small sample sizes, the consistency of the overall ES of salivary glucose mean and correlation with glycemia and HbA1c Figure 8. Forest plot from DM condition effect on salivary glucose levels correlations with HbA1c. Cohen’s q (standardized Fisher-z difference between diabetic and control groups) effect size estimates have been calculated with 95% confidence intervals and have been aggregated (random effects model). Area of squares represents sample size, continuous horizontal lines and diamonds width represents 95% confidence interval and the diamonds centre and vertical red dotted line indicates the pooled random effect weighted estimate. For more detailed results see Table 6. doi:10.1371/journal.pone.0101706.g008
support the claim that type 2 DM have a positive medium to large overall effect on salivary glucose levels. This substantiates the use of this variable for type 2 DM screening, especially in large-scale studies, which could be greatly facilitated by the ease of the methodology. Furthermore, this correlation between blood and salivary glucose levels grows with increased glycemia or HbA1c, which may, in itself, be a sign of diabetes with bad metabolic control. Salivary glucose evaluation may therefore also facilitate the monitoring of metabolic status in DM patients through daily glucose self-measurements.
In conclusion, our results show that type 2 DM leads to a consistent increase in salivary glucose that remains detectable in spite of food contamination, variations in salivary flow rate or presence of local autonomic neuropathy. Our review also reports a significant overall relationship between salivary glucose concen-tration and associated glycemia/HbA1c values, with the correla-tion strength increasing as we move to higher glycemia/HbA1c values. These results, in combination with recent and old reports [13,30], support the possible use of salivary glucose as type 2 DM biomarker. If associated with the development of sensitive portable technology to measure salivary glucose [30,44,45] this will allow a less painful and invasive method for type 2 DM screening or
diabetic glucose monitoring, especially for studies of large cohorts. Even if at present, due to several limitations, salivary glucose per se may not show enough consistency to be used as an independent and autonomous DM type 2 biomarker, our results suggest that it provides valuable information, and may in the future be combined with other salivary biomarkers to create an effective high sensitivity/specificity DM type 2 large-scale screening system.
Supporting Information
Table S1 PRISMA 2009 checklist.
(DOCX)
Acknowledgments
We would like to acknowledge Beatriz Vicoso, from UC Berkeley, Berkeley, USA, for a valuable review of this manuscript.
Author Contributions
Conceived and designed the experiments: IB PM. Performed the experiments: PM BF. Analyzed the data: PM IB. Contributed reagents/ materials/analysis tools: IB BF PM. Wrote the paper: PM IB.
References
1. Vashist P, Singh S, Gupta N, Saxena R (2011) Role of early screening for diabetic retinopathy in patients with diabetes mellitus: an overview. Indian J Community Med Oct; 36(4):247–52. doi: 10.4103/0970-0218.91324. 2. U.S. Preventive Services Task Force (2008) Screening for type 2 diabetes mellitus in adults: U.S. Preventive Services Task Force recommendation statement. Ann Intern Med 148(11):846–854. doi:10.7326/0003-4819-148-11-200806030-00007.
3. Valdez R (2009) Detecting undiagnosed type 2 diabetes: family history as a risk factor and screening tool. J Diabetes Sci Technol July; 3(4): 722–726. 4. Rathnayake N, Akerman S, Klinge B, Lundegren N, Jansson H, et al. (2013)
Salivary biomarkers for detection of systemic diseases. PLoS One Apr 24; 8(4):e61356. doi:10.1371/journal.pone.0061356.
5. Rao PV, Reddy AP, Lu X, Dasari S, Krishnaprasad A, et al. (2009) Proteomic identification of salivary biomarkers of type-2 diabetes. J Proteome Res Jan; 8(1):239–45. doi: 10.1021/pr8003776.
6. Genco RJ (2012) Salivary diagnostic tests. J Am Dent Assoc 143 (10 Suppl): 3S– 5S.
7. Pfaffe T, Cooper-White J, Beyerlein P, Kostner K, Punyadeera C (2011) Diagnostic potential of saliva: current state and future applications. Clin Chem May; 57(5):675–87. doi: 10.1373/clinchem.2010.153767.
8. Hofman LF (2001) Human saliva as a diagnostic specimen. J Nutr May; 131(5):1621S–5S.
9. Amer S, Yousuf M, Siddqiui PQ, Alam J (2001) Salivary glucose concentrations in patients with diabetes mellitus—a minimally invasive technique for monitoring blood glucose levels. Pak J Pharm Sci Jan; 14(1):33–7.
10. Aydin S (2007) A comparison of ghrelin, glucose, alpha-amylase and protein levels in saliva from diabetics. J Biochem Mol Biol Jan 31; 40(1):29–35. 11. Panchbhai AS, Degwekar SS, Bhowte RR, Degweka SS (2010) Estimation of
salivary glucose, salivary amylase, salivary total protein and salivary flow rate in diabetics in India. J Oral Sci Sep; 52(3):359–68.
12. Vasconcelos ACU, Soares MSM, Almeida PC, Soares TC (2010) Comparative study of the concentration of salivary and blood glucose in type 2 diabetic patients. J Oral Sci Jun; 52(2):293–8.
13. Abikshyeet P, Ramesh V, Oza V (2012) Glucose estimation in the salivary secretion of diabetes mellitus patients. Diabetes, Metab Syndr Obes Targets Ther 5:149–54. doi: 10.2147/DMSO.S32112.
14. Al-Zahawi SM, Al-Barzenji HAM, Al-Qassab ZA (2012) Effects of diabetes mellitus types II on salivary flow rate and some salivary parameters (total protein, glucose, and amylase) in Erbil city. J Bagh Coll Dent 24(2):123–127. 15. Lasisi TJ, Fasanmade AA (2012) Salivary flow and composition in diabetic and
non-diabetic subjects. Niger J Physiol Sci Jun 7; 27(1):79–82.
16. Jurysta C, Bulur N, Oguzhan B, Satman I, Yilmaz TM, et al. (2009) Salivary glucose concentration and excretion in normal and diabetic subjects. J Biomed Biotechnol 2009: Article ID 430426, 6 pp. doi: 10.1155/2009/430426. 17. Bernardi MJ, Reis A, Loguercio AD, Kehrig R, Leite MF, et al. (2007) Study of
the buffering capacity, pH and salivary flow rate in type 2 well-controlled and poorly controlled diabetic patients. Oral Health Prev Dent 5(1):73–78. 18. Darwazeh AM, MacFarlane TW, McCuish A, Lamey PJ (1991) Mixed salivary
glucose levels and candidal carriage in patients with diabetes mellitus. J Oral Pathol Med 20(6):280–283.
19. Panchbhai AS (2012) Correlation of Salivary Glucose Level with Blood Glucose Level in Diabetes Mellitus. J Oral Maxillofac Res 3(3):e3. doi:10.5037/ jomr.2012.3303.
20. Agrawal RP, Sharma N, Rathore MS, Gupta VB, Jain S, et al. (2013) Noninvasive Method for Glucose Level Estimation by Saliva. J Diabetes Metab 4:266. doi:10.4172/2155–6156.1000266.
21. Mahdavi SO, Hashemi S, Boostani N, Zokaee H (2012) A New Method to Evaluate Fasting Plasma Glucose by Salivary Glucose Measurement. Iran J Diabetes Obes 4(3): 127–133.
22. Lasisi TJ, Fasanmade AA (2012) Comparative analysis of salivary glucose and electrolytes in diabetic individuals with periodontitis. Ann Ibadan Postgrad Med 1(10): 25–30.
23. Vaziri PB, Vahedi M, Mortazavi H, Abdollahzadeh SH, Hajilooi M (2010) Evaluation of salivary glucose, IgA and flow rate in diabetic patients: a case-control study. J Dent (Tehran) 7(1): 13–18.
24. Hegde A, Shenoy R, D’Mello P, Smitha A, Tintu A, et al. (2010) Alternative markers of glycemic status in diabetes mellitus. Biomed Res 21(3): 252–256. 25. Manjrekar PA, Hegde A, Shrilaxmi, D’souza F, Kaveeshwar V, et al. (2012)
Fructosamine in Non-diabetic First Degree Relatives of Type 2 Diabetes Patients: Risk Assessor. J Clin Diagnostic Res. June, Vol-6(5): 770–77. doi: JCDR/2012/3863:0000.
26. Carda C, Mosquera-Lloreda N, Salom L, Gomez de Ferraris ME, Peydro´ A (2006) Structural and functional salivary disorders in type 2 diabetic patients. Med Oral Patol Oral Cir Bucal Jul 1; 11(4):E309–14.
27. Reuterving CO, Reuterving G, Ha¨gg E, Ericson T (1987) Salivary flow rate and salivary glucose concentration in patients with diabetes mellitus influence of severity of diabetes. Diabete Metab Jul-Aug; 13(4):457–62.
28. Soares M-S-M, Batista-Filho M-M-V, Pimentel M-J, Passos I-A, Chimenos-Ku¨stner E (2009) Determination of salivary glucose in healthy adults. Med Oral Patol Oral Y Cir Bucal Oct 1; 14(10):e510–3.
29. Hashemipour M, Nekuii F, Amini M, Aminalroaya A, Rezvanian H, et al. (2000) A study of the relationship between blood and saliva glucose levels in healthy population to find a non-invasive method for blood glucose measurement. Iran J Endocrinol Metab 2(4): 221–226.
30. Yamaguchi M, Mitsumori M, Kano Y (1998) Noninvasively Measuring Blood Glucose Using Saliva - A Bloodless Procedure Bused on an Enzyme-Sensor System. IEEE Eng Med Biol: 59–63.
31. Headrick TC (2010) Statistical Simulation: Power Method Polynomials and other Transformations. Boca Raton, FL: Chapman & Hall/CRC.
32. Faul F, Erdfelder E, Buchner A, Lang A-G (2009) Statistical power analyses using G*Power 3.1: tests for correlation and regression analyses. Behav Res Methods 41(4): 1149–1160.
33. R Development Core Team (2008) R: A language and environment for statistical computing. R Foundation for Statistical Computing, Vienna, Austria. ISBN 3-900051-07-0. Available: http://www.R-project.org. Accessed 2014 Jun 24.
34. Wallace BC, Schmid CH, Lau J, Trikalinos TA (2009) Meta-Analyst: software for meta-analysis of binary, continuous and diagnostic data. BMC Med Res Methodol 9: 80. doi:10.1186/1471-2288-9-80.
35. Higgins JPT, Thompson SG, Deeks JJ, Altman DG (2003) Measuring inconsistency in meta-analyses. BMJ 327: 557–560. doi:10.1136/bmj.327.7414.557.
36. Cohen J (1988) Statistical power analysis for the behavioral sciences, 2nd ed. Mahwah, NJ: Erlbaum.
37. Coe R (2002) It’s the Effect Size, Stupid. What effect size is and why it is important. Presentation to the Annual Conference of the British Educational Research Association, England 2002. Available: http://www.leeds.ac.uk/ educol/documents/00002182.htm. Acessed 2014 May 3.
38. Hammer GP, du Prel J-B, Blettner M (2009) Avoiding bias in observational studies: part 8 in a series of articles on evaluation of scientific publications. Dtsch Arztebl Int Oct; 106(41):664–8. doi: 10.3238/arztebl.2009.0664.
39. Rosenthal R (1984) Meta analytic procedures for social research. In: Applied Social Science Research Methods, Vol. 6. Beverly Hills: Sage.
40. Murrah VA, Crosson JT, Sauk JJ (1985) Parotid gland basement membrane variation in diabetes mellitus. J Oral Pathol Mar; 14(3):236–46.
41. Mandel ID (1980) Sialochemistry in diseases and clinical situations affecting salivary glands. Crit Rev Clin Lab Sci 12(4): 321–366.
42. Ship JA (2003) Diabetes and oral health: an overview. J Am Dent Assoc Oct; 134 Spec No:4S–10S.
43. Ficara AJ, Levin MP, Grower MF, Kramer GD (1975) A comparison of the glucose and protein content of gingival fluid from diabetics and nondiabetics. J Periodontal Res 10(3): 171–175. doi: 10.1111/j.1600-0765.1975.tb00022.x. 44. So C-F, Choi K-S, Wong TK, Chung JW (2012) Recent advances in
noninvasive glucose monitoring. Med Devices (Auckl) 5: 45–52. doi:10.2147/ MDER.S28134.
45. Scott DA, Renaud DE, Krishnasamy S, Meric¸ P, Buduneli N, et al. (2010) Diabetes-related molecular signatures in infrared spectra of human saliva. Diabetol Metab Syndr 2: 48. doi: 10.1186/1758-5996-2-48.