doi: 10.3389/fpls.2016.00947
Edited by: Iker Aranjuelo, Instituto de Agrobiotecnología, CSIC, UPNA, Spain Reviewed by: Rubén Vicente, University of Barcelona, Spain Gorka Erice, Estación Experimental del Zaidín CSIC, Spain *Correspondence: José C. Ramalho [email protected]; [email protected] †
These authors have contributed equally to this work.
Specialty section: This article was submitted to Plant Physiology, a section of the journal Frontiers in Plant Science Received: 27 April 2016 Accepted: 14 June 2016 Published: 29 June 2016 Citation: Martins MQ, Rodrigues WP, Fortunato AS, Leitão AE, Rodrigues AP, Pais IP, Martins LD, Silva MJ, Reboredo FH, Partelli FL, Campostrini E, Tomaz MA, Scotti-Campos P, Ribeiro-Barros AI, Lidon FJC, DaMatta FM and Ramalho JC (2016) Protective Response Mechanisms to Heat Stress in Interaction with High [CO2] Conditions in Coffea spp. Front. Plant Sci. 7:947. doi: 10.3389/fpls.2016.00947
Protective Response Mechanisms to
Heat Stress in Interaction with High
[CO
2
] Conditions in Coffea spp.
Madlles Q. Martins1, 2 †, Weverton P. Rodrigues1, 3 †, Ana S. Fortunato1 †,
António E. Leitão1, 4, Ana P. Rodrigues1, Isabel P. Pais5, Lima D. Martins1, 6,
Maria J. Silva1, 4, Fernando H. Reboredo4, Fábio L. Partelli2, Eliemar Campostrini3,
Marcelo A. Tomaz6, Paula Scotti-Campos4, 5, Ana I. Ribeiro-Barros1, 4,
Fernando J. C. Lidon4, Fábio M. DaMatta7and José C. Ramalho1, 4*
1Grupo Interações Planta-Ambiente and Biodiversidade (PlantStress&Biodiversity), Departamento Recursos Naturais,
Ambiente e Território (DRAT), Linking Landscape, Environment, Agriculture and Food (LEAF), and Forest Research Center (CEF), Instituto Superior de Agronomia, Universidade de Lisboa, Oeiras, Portugal,2Departamento Ciências Agrárias e
Biológicas, Centro Universitário Norte do Espírito Santo, Universidade Federal Espírito Santo, São Mateus, Brazil,3Setor
Fisiologia Vegetal, Centro de Ciências e Tecnologias Agropecuárias, Universidade Estadual do Norte Fluminense, Rio de Janeiro, Brazil,4GeoBioTec, Faculdade Ciências Tecnologia, Universidade NOVA de Lisboa, Caparica, Portugal,5Unidade
de Investigação em Biotecnologia e Recursos Genéticos, Instituto Nacional de Investigação Agrária e Veterinária, Oeiras, Portugal,6Departamento Produção Vegetal, Centro de Ciências Agrárias, Universidade Federal do Espírito Santo, Alegre,
Brazil,7Departamento Biologia Vegetal, Universidade Federal de Viçosa, Viçosa, Brazil
Modeling studies have predicted that coffee crop will be endangered by future global warming, but recent reports highlighted that high [CO2] can mitigate heat impacts on coffee. This work aimed at identifying heat protective mechanisms promoted by CO2 in Coffea arabica(cv. Icatu and IPR108) and Coffea canephora cv. Conilon CL153. Plants were grown at 25/20◦C (day/night), under 380 or 700 µL CO −
2 L 1, and then gradually submitted to 31/25, 37/30, and 42/34◦C. Relevant heat tolerance up to 37/30◦C for both [CO2] and all coffee genotypes was observed, likely supported by the maintenance or increase of the pools of several protective molecules (neoxanthin, lutein, carotenes, α-tocopherol, HSP70, raffinose), activities of antioxidant enzymes, such as superoxide dismutase (SOD), ascorbate peroxidase (APX), glutathione reductase (GR), catalase (CAT), and the upregulated expression of some genes (ELIP, Chaperonin 20). However, at 42/34◦C a tolerance threshold was reached, mostly in the 380-plants and Icatu. Adjustments in raffinose, lutein, β-carotene, α-tocopherol and HSP70 pools, and the upregulated expression of genes related to protective (ELIPS, HSP70, Chape 20, and 60) and antioxidant (CAT, CuSOD2, APX Cyt, APX Chl) proteins were largely driven by temperature. However, enhanced [CO2] maintained higher activities of GR (Icatu) and CAT (Icatu and IPR108), kept (or even increased) the Cu,Zn-SOD, APX, and CAT activities, and promoted a greater upregulation of those enzyme genes, as well as those related to HSP70, ELIPs, Chaperonins in CL153, and Icatu. These changes likely favored the maintenance of reactive oxygen species (ROS) at controlled levels and contributed to mitigate of photosystem II photoinhibition at the highest temperature. Overall, our results highlighted the important role of enhanced [CO2] on the coffee crop acclimation and sustainability under predicted future global warming scenarios.
INTRODUCTION
Anthropogenic actions, mostly related to rising use of fossil fuels and land-use changes, have strongly contributed to the increase of atmospheric [CO2] from ca. 280 in the pre-industrial period to the actual 400 µL CO2 L−1. According to recent projections, depending on the greenhouse gas emission scenarios air [CO2] could rise to between 421 and 936 µL CO2 L−1, (or between 475 and 1313 µL CO2L−1, considering CO2-equivalent concentrations that include the predicted concentrations of CH4 and N2O) by 2100. These will be accompanied by a global surface warming between 0.3 and 1.7◦C (best scenario) and 2.6–4.8◦C (worst scenario, without additional mitigation efforts), relative to 1986–2005 (IPCC, 2013, 2014).
This [CO2] boost can affect fundamental plant processes such as photosynthesis and respiration (Woodward, 2002; Ainsworth
and Rogers, 2007; Kirschbaum, 2011), ultimately altering plant
growth, yield, and crop quality (Luo et al., 1999; DaMatta
et al., 2010). The actual atmospheric [CO2] is below the optimal
for photosynthesis of C3 crops. Therefore, enhanced [CO2] is expected to increase net photosynthesis near or often above 50%, with trees showing the largest rise (Ainsworth and Rogers, 2007). However, projected global warming, concurrent to [CO2] increase may compromise the beneficial effects of C fertilization, and affect flower viability, fruit development, and yield (Prasad
et al., 2003; Camargo, 2010), therefore constituting a major
threat for many important agricultural crops. Indeed, heat modifies the use of solar energy, alters both the gas diffusion in the leaf mesophyll (Lambers et al., 2008) and photosynthetic pigment composition and content (Haldimann and Feller, 2004;
Hasanuzzaman et al., 2013). Elevated temperatures also affect
the water relations and evaporative demand, the fluidity and stability of membrane systems, as well as hormones and primary and secondary metabolites (Wahid et al., 2007). Collectively, these alterations could potentially disrupt cellular homeostasis and impair photosynthesis and other major physiological processes (Long et al., 2006; Suzuki and Mittler, 2006;
Kirschbaum, 2011). In any case, elevated [CO2] can modify
plant responses to environmental variables (Boisvenue and
Running, 2006). Therefore, to properly predict plant responses
to rising temperatures and atmospheric [CO2], studies must be undertaken considering both variables on a long-term basis, given that their interaction can either exacerbate or cancel their single independent effects on leaf physiology (Way et al., 2015).
The harmful effects of heat stress is frequently linked to the enhanced accumulation of reactive oxygen species (ROS) (Suzuki
and Mittler, 2006; Hasanuzzaman et al., 2013). The upregulation
of mechanisms controlling the production/scavenging of highly reactive molecules is determinant to cell homeostasis and to
Abbreviations:A, antheraxanthin; APX, ascorbate peroxidase; ASC, ascorbate; Chl, chlorophyll; 3Chl∗, triplet state of Chl; Chl (a+b), Total Chl; Cu,Zn-SOD, Cu,Zn-superoxide dismutase; DHAR, dehydroascorbate reductase; GR, glutathione reductase; gs, stomatal conductance; H2O2, hydrogen peroxide;1O2, singlet oxygen; O•
2, superoxide anion radical; •OH, hydroxyl radical; PIChr, PIDyn,and PITot, chronic photoinhibition, dynamic photoinhibition, and total photoinhibition; SD, stomatal density; SI, stomatal index; ROS, reactive oxygen species; TOC, α-tocopherol; V, violaxanthin; Z, zeaxanthin.
plant survival to environmental stresses. Chloroplast (and cell) oxidative stress usually arises under conditions that reduce energy use by photochemical processes without a significant reduction in energy capture. This imbalance promotes the over-production of molecules in the excited state, both of Chl and O2 [e.g., triplet state of chl (3Chl∗), 1chl, singlet oxygen (1O
2)]. Furthermore, O2reduction in photosystems (particularly in PSI) may occur, producing O·−
2 and, thereafter, H2O2 and OH·, all of which can cause lipid peroxidation, bleaching of pigments (e.g., in P680), protein oxidation (e.g., D1), enzyme inactivation, and DNA degradation (Asada, 1994; Foyer, 2002;
Logan, 2005). The control of such highly reactive molecules can
be achieved indirectly, through the increase of energy dissipation mechanisms (e.g., photorespiration, pseudocyclic electron transport, and the synthesis of photoprotective pigments;
Logan, 2005; Smirnoff, 2005; Batista-Santos et al., 2011), or
directly, acting on their production/scavenging. The latter includes the complementary overexpression of enzymes (e.g., SOD, APX, GR), as well as the action of hydrophilic (ascorbate and glutathione) and lipophilic (e.g., zeaxanthin, β-carotene, and α-tocopherol) antioxidants (Foyer, 2002; Logan, 2005;
Munné-Bosch, 2005; Smirnoff, 2005).
Coffee, an evergreen tropical tree species, is one of the most heavily globally traded commodities. The world coffee production is based on Coffea arabica L. and C. canephora Pierre ex A. Froehner, which produce ∼2/3 and 1/3 of crop yield, respectively. The optimal annual average temperature is one of the well-known differences between C. arabica (18–23◦C) and C. canephora (22–26◦C) (DaMatta and Ramalho, 2006). Coffee crop chain of value generates an income of approximately US$ 170,000 million and involves ca. 100 million people worldwide, having a strong social and economic impact on many tropical countries (Bunn et al., 2015). Noticeably, the coffee production is mostly based on small holders that are currently facing growing challenges from climate changes; under these circumstances, both the coffee yields and beverage quality can be profoundly impacted, thus potentially affecting not only producers but also the coffee industry and consumers as a whole. In fact, over the last decade, several modeling studies anticipated remarkable climate impacts on the coffee crop (especially C. arabica), with large worldwide losses on suitable areas and productivity, although coffee production is believed to have already been affected by climate changes due to the occurrence of severe droughts and high temperatures (Bunn et al., 2015; Craparo et al., 2015; van
der Vossen et al., 2015). However, neither the positive effects
of elevated [CO2] on coffee photosynthesis (Ramalho et al.,
2013b; DaMatta et al., 2016), leaf mineral balance (Martins
et al., 2014), and bean yield (Ghini et al., 2015), nor the role
of CO2 as a key player in coffee heat tolerance (Rodrigues
et al., 2016), have been considered in those modeling studies,
probably because this information has become available only very recently.
We previously demonstrated that both C. arabica and C. canephora species are remarkably heat tolerant up to 37/30◦C, but at 42/34◦C a threshold for irreversible non-stomatal deleterious effects on photosynthesis is reached, with greater impairments on C. arabica, particularly under normal
air [CO2] (Rodrigues et al., 2016). Photosystems and thylakoid electron transport were shown to be quite heat tolerant, contrasting to the enzymes related to energy metabolism, including RuBisCO, which were the most sensitive components. We also demonstrated that elevated [CO2] does not provoke photosynthetic downregulation and remarkably mitigates the impact of temperature on both species, particularly at 42/34◦C, modifying the response to supra-optimal temperatures. Here we complement our previous studies with the central objective of exploring potential protective mechanisms against heat stress, and how these mechanisms are affected by the elevated [CO2] in coffee. To reach these goals, we firstly assessed the occurrence of PSII photoinhibition (as a marker for photodamage), followed by an in-depth characterization of protective mechanisms, including dynamics of photosynthetic pigments, enzymatic and non-enzymatic antioxidant systems, quantification of raffinose family oligosaccharides (RFOs), and heat-shock protein pools, in addition to assessing the expression of selected genes with potential roles in heat acclimation.
MATERIALS AND METHODS
Plant Material and Experimental
Conditions
The plant materials were collected from the same experiments described in Rodrigues et al. (2016), therefore, using the same experimental conditions and treatments. In brief, three widely cropped coffee genotypes from the two main producing species, C. arabica L. (cvs. Icatu and IPR108) and C. canephora Pierre ex A. Froehner (cv. Conilon Clone 153—CL153), were evaluated. Plants, ca. 1.5 years of age, were transferred into two walk-in growth chambers (EHHF 10000, ARALAB, Portugal) differing in air [CO2] supply: 380 µL CO2 L−1 (380-plants) or 700 µL CO2 L−1 (700-plants). Both groups of plants were then grown for 10 months in 28 L pots in a substrate consisting of a mixture of soil, peat, and sand (3:1:3, v/v/v), as optimized for coffee plants (Ramalho et al., 2013a), and fertilized as previously described (Ramalho et al., 2013b). Environmental conditions of temperature (25/20◦C, day/night), irradiance (ca. 700–800 µmol m−2 s−1), RH (75%), and photoperiod (12 h) were provided to the plants, and permanently monitored along the whole period. The temperature was then gradually increased from 25/20◦C up to 42/34◦C in both growth chambers at a rate of 0.5◦C day−1, with 7 days of stabilization at 31/25, 37/30, and 42/34◦C for evaluations.
All determinations were performed on newly matured leaves from the upper (illuminated) part of each plant. For biochemical evaluations, leaf material was collected after ca. 2 h of illumination from 6 to 8 plants of each genotype and used immediately or flash frozen in liquid N2 and stored at −80◦C until analysis. Each biological replicate is a pool of leaves of each plant. Along the experiment the plants were maintained without restrictions in water, nutrients, and root development, the latter evaluated by visual examination at the end of the experiment after removing the plants from their pots (Rodrigues et al., 2016).
PSII Photoinhibition Status
The PSII photoinhibition indexes were calculated according to
Werner et al. (2002), and included: (A) chronic photoinhibition
(PIChr), representing the percent reduction in Fv/Fm at each temperature relative to the maximal Fv/Fm obtained during the entire experiment; (B) dynamic photoinhibition (PIDyn), representing the decline in Fv/Fm that is fully reversible overnight, being measured as the percent reduction in midday F′
v/F′m relative to Fv/Fm at each temperature, relative to the maximal Fv/Fm from the entire experiment; (C) total photoinhibition (PITotal=PIChr+PIDyn). The Fv/Fmand F′v/F′m represented the maximal photochemical efficiency of PSII and the actual PSII efficiency of energy conversion under light exposure, respectively. Fv/Fmand F′v/F′mwere obtained under dark adapted or photosynthetic steady-state conditions, respectively, exactly as detailed inRodrigues et al. (2016).
Photosynthetic Pigment Characterization
Carotenoids (Car) were assessed from four frozen leaf discs (each 0.5 cm2). Sample processing and subsequent reverse-phase HPLC were carried out as optimized for coffee (Ramalho et al., 1997) with minor adjustments, using an end-capped (C18) 5-µm Spherisorb ODS-2 column (250 × 4.6 mm). Detection was performed at 440 nm in an HPLC system (Beckman, System Gold, Tulsa, USA) coupled to a diode-array (Model 168; Beckman) detector, and identification and quantification were performed using individual sugar standards. The de-epoxidation state, involving xanthophyll cycle components, was calculated as DEPS = (Zeaxanthin (Z) + 0.5 Antheraxanthin (A)) / (Violaxanthin(V) + A + Z).Chlorophylls (Chls) from the same samples were extracted in 80% acetone, and quantified spectrophotometrically according to
Lichtenthaler (1987).
Maximal Activities of Antioxidant Enzymes
Unless otherwise indicated, enzyme activities were determined in chloroplast extracts (obtained using 3–4 g FW of leaf tissue), as described previously (Ramalho et al., 1998). Superoxide dismutase (Cu,Zn-SOD, EC 1.15.1.1) was spectrophotometrically assessed at 550 nm. Ascorbate peroxidase (APX, EC 1.11.1.11) was assessed through ascorbate consumption (at 290 nm, 120 s, 25◦C) using an extinction coefficient of 2.8 mM−1 cm−1 for calculations. Glutathione reductase (GR, EC 1.6.4.2) was assessed through the NADPH oxidation (at 340 nm, 120 s, 25◦C). Catalase (CAT, EC 1.11.1.6) was assessed in whole-leaf extracts (prepared using 200 mg FW of leaf tissue), as described inFortunato et al.(2010). Enzyme activity was evaluated through the rate of H2O2
consumption (240 nm, 120 s, 25◦C), and a freshly made H 2O2 standard curve (0–1 M) was used for quantification.
Quantification of Non-enzymatic
Antioxidants
Ascorbate (ASC) and α-tocopherol (TOC) determinations were performed on 100 and 200 mg FW of leaf tissue, respectively, based on HPLC methods, as described in detail inFortunato et al. (2010).
HSP70 Quantification
For the heat shock protein 70 (HSP70) assays, 100 mg FW of frozen leaf tissues per plant were homogenized in 1 mL 200 mM Tris-HCl (pH 8.0), containing 20 mM β-mercaptoethanol, 2 mM dithiothreitol (DTT), 2% triton X-100, 4% (v/v) “Complete-protease inhibitor cocktail” with EDTA, 10% polyvinylpolypyrrolidone, and 10% glycerol. The homogenate was then centrifuged (10,000 g, 20 min, 4◦C) and the supernatant was used for HSP70 quantification through Enzyme Linked Immunosorbent Assay (ELISA), using Flat-bottomed micro-ELISA plates (Costar, Corning, NY, USA) as described inNjemini
et al. (2003)with minor modifications. Plates were covered with
the primary antibody (100 µL; 5 µg mL−1) diluted in 100 mM carbonate buffer (pH 9.6). After incubating the plates at 37◦C during 90 min, the coated plates were washed four times with phosphate-buffered saline (PBS) containing 0.1% Tween 20 (PBS/T) and non-specific binding sites blocked by incubation with 300 µL of PBS/T containing 0.1% BSA (PBS/T/BSA) for 60 min at 37◦C. After washing, 50 µL of the standard and samples were added and the plates incubated for 90 min at 37◦C. Plates were then washed four times and 100 µL of mouse monoclonal anti-HSP70 (1/400) diluted in PBS/T were added. After 60 min on a shaker at 37◦C, plates were washed four times and incubated with 100 µL of the diluted (1/10,000 in PBS/T/BSA) secondary antibody (anti-mouse IgG, peroxidase, Sigma-Aldrich, USA) for 60 min at 37◦C. Thereafter, plates were washed and 100 µL of ABTS (2,2′ -Azino-bis-3-ethylbenzothiazoline-6-sulfonic acid) substrate were added. After 45 min at 37◦C, the reaction was stopped with 50 µL of 1 N H2SO4 and the absorbance was determined at 405 nm using a microplate reader. HSP70 concentrations were detected by comparing sample absorbance with the absorbance of a reference purified HSP70 protein.
Total soluble protein contents of the enzyme extracts followed
Bradford (1976), using bovine serum albumin (BSA) as a
standard.
Raffinose Family Oligosaccharides
Quantification
RFOs evaluation was performed in samples of 150 mg of powdered frozen material, following the HPLC method for soluble sugars described in Ramalho et al. (2013b), with some modifications. To overcome the presence of non-pure peaks the separation of sugars was performed using a Sugar-Pak 1 column (300 × 6.5 mm, Waters) at 90◦C, with H
2O as the eluent (containing 50 mg EDTA-Ca L−1 H
2O) and a flow rate of 0.5 mL min−1. Another 20 µL aliquot of each sample was injected through a DionexCarboPac PA1 analytical column (4 × 250 mm, Thermo Scientific, USA) coupled to a DionexCarboPac PA1 Guard (4 × 50 mm) at 20◦C. Ultrapure water and 300 mM NaOH were used as eluents (water from 0 to 50 min; NaOH from 50 to 65 min; and water from 65 to 80 min for re-equilibration) at a 1 mL min−1 flow rate. A refractive index detector (Model 2414, Waters, USA) was used for sugar detection. Sugars were quantified using specific standard curves.
Expression Studies of Selected Genes
Total RNA was isolated and quantified as described inGoulaoet al. (2012). One microgram of DNA-free total RNA was used
to synthesize first-strand cDNAs using oligo-(dT)18 primers and the SuperScript II first-strand synthesis system (Invitrogen, USA).
Genes related to the antioxidative system and other protection proteins were selected for the expression studies (Tables 1, 6), with all procedures performed as described in Goulao et al.
(2012). Primers were designed using the C. canephora sequences
(http://www.coffee-genome.org/coffeacanephora) with Primer3 software. Primer length was set to 19–20 bp, with a GC content between 45 and 60% and a melting temperature (Tm value) between 62 and 65◦C. Amplicon length ranges were set to be between 80 and 150 bp. The probability of formation of hairpin structures and primer dimerization was subsequently checked using the Oligo Calculator algorithm. To determine the specificity of the primer pairs used in this study, melting/dissociation curve analysis was performed following the RT-qPCR experiment. A single peak in the obtained melting curve confirmed the specificity of the amplicon, and no signal was detected in the negative controls for all of the tested primers. All qRT-PCR reactions and relative gene expression were calculated after normalization with the reference genes ubiquitin-conjugating enzyme E2 (UbQ2) and eukaryotic initiation factor 4α(eLF-4).
Statistical Analysis
Data were analyzed using two-way ANOVAs (P < 0.05) to evaluate the differences between the two growth atmospheric [CO2] and among the several temperature treatments, as well as their interaction, followed by a Tukey’s test for mean comparisons, except when otherwise stated. Each ANOVA was performed independently for each of the studied genotypes. Overall, the [CO2] × temperature interaction for most parameters was significant. To the sake of simplicity we do not considered also the comparison between genotypes within each [CO2] and temperature.
The relative expression ratio of each target gene was computed based on its real-time PCR efficiency and the crossing point (CP) difference of a target sample vs. a control (25/20◦C, 380 µL CO2L−1air) within each genotype. Data analysis was performed using the Relative Expression Software Tool (REST 2009), available at http://www.genequantification.de/rest-2009.html. A 95% confidence level was adopted for all tests.
RESULTS
PSII Photoinhibition
Overall, dynamic PSII photoinhibition (PIDyn) was mostly unresponsive to temperature and [CO2] (Figure 1A). Even so, CL153 380-plants maintained higher PIDyn values than those of under 700 µL CO2 L−1 throughout the experiment. In contrast, chronic PSII photoinhibition (PIChr) was manifested almost exclusively at 42/34◦C (Figure 1B) and in the 380-plants, particularly in Icatu. Reflecting PIDyn and PIChr variations at 42/34◦C, the total photoinhibition (PI
TABLE 1 | Selected genes used for real-time qPCR studies, which are related to the oxidative stress control and/or repair mechanisms, homologies, primer sequences, access number on NCBI GenBank and amplicon size (bp).
Gene symbol Primer sequence (5′–3′) Gene description NCBI GenBank acess number Amplicon size (bp)
UBQ* F: AACATTGAGGGTGGTTCTGTTC Ubiquitin AF297089 200
R: CTCCAAGTGCACCTCAAACTC
HSP70 F: GGGAAGCAATTGACACCAAG Stromal 70 kDa heat shock-related protein, chloroplastic
GSCOCT00018441001;Name=Cc10_g11150 150 R: AGCCACCAGATACTGCATCC
ELIP F:GCCATGATAGGGTTTGTTGC Chloroplast early light-induced protein
GSCOCT00026140001;Name=Cc03_g04300 101 R: GTCCCAATGAACCATTGCAG
Chape 20 F: GTTAAAGCTGCCGCTGTTG Chloroplast 20 kDa chaperonin GSCOCT00041526001;Name=Cc06_g12530 150 R: CTCACCTCCTTGAGGTTTCG
Chape 60 F: GGATAGTGAAGCCCTTGC Mitochondria chaperonin CPN60 GSCOCT00026540001;Name=Cc03_g07040 80 R: CCCAGGAGCTTTTATTGCAC
CAT F: CTACTTCCCCTCGCGGTAT Catalase isozyme 1 GSCOCT00036969001;Name=Cc07_g11710 150
R: CTGTCTGGTGCAAATGAACG
CuSOD1 F: CCCTTGGAGACACAACGAAT Superoxide dismutase [Cu-Zn] GSCOCT00012962001;Name=Cc02_g32280 141 R: GGCAGTACCATCTTGACCA
CuSOD2 F: GGGGCTCTATCCAATTCCTC Superoxide dismutase [Cu-Zn] GSCOCT00040610001;Name=Cc06_g23170 150 R: GGTTAAAATGAGGCCCAGTG
FeSOD F: TGTCAACCCTCTTGTGTGGA Chloroplast superoxide dismutase [Fe]
GSCOCT00031536001;Name=Cc10_g09500 141 R: ATTGCCGCATTCCAAGATAC
APX Cyt F: TCTGGATTTGAGGGACCTTG Cytosol ascorbate peroxidase GSCOCT00023633001;Name=Cc06_g03490 108 R: GTCAGATGGAAGCCGGATAA
APX Chl F: CACCTGCTGCTCATTTACG Chloroplast ascorbate peroxidase GSCOCT00031893001;Name=Cc10_g12080 100 R: GACCTTCCCAATGTGTGTG
Toc Mt F: GCAGATGGGTCATTCGATTT Chloroplast probable tocopherol O-methyltransferase
GSCOCT00040496001;Name=Cc06_g18700 146 R: GGCGAAAGATCCCTATGAC
Toc Cy F: CCTAACTTTTGGGGAAGC Chloroplast tocopherol cyclase GSCOCT00017269001;Name=Cc08_g09240 150 R: GATGCCAAAGGGGAGTAAC
*Used to check for DNA contamination in RNA samples and positive control for cDNA synthesis.
higher values in the 380-plants of all genotypes (maximal in Icatu), as well as in the 700-plants of C. arabica genotypes (Figure 1C).
Photosynthetic Pigment
At control temperature (25/20◦C), enhanced [CO
2] promoted a consistent tendency toward higher contents of several carotenoids (Car) in CL153 (Table 2), although significantly only for neoxanthin and carotenes. No changes were observed in total Chl contents (Table 3). The C. arabica plants showed a somewhat different pattern by the maintenance or even slight lower Car contents under high [CO2], namely in the pool of xanthophyll cycle pigments (VAZ), carotenes, and total Car.
In C. canephora plants exposed to supra-optimal temperatures, decreases in most pigments (neoxanthin, VAZ pool, lutein, β-, and total carotenes) were observed in the 700-plants. Given that the 380-plants maintained or slightly increased (lutein, carotenes) their pigment contents (when compared to 25/20◦C), differences between CO
2 conditions emerged for most Car, significantly for neoxanthin, VAZ pool, lutein, and total Car under 42/34◦C.
In C. arabica genotypes, [CO2] treatment caused marginal/occasional changes in pigment composition at high temperatures. Such changes were mostly restricted to 700-plants of IPR108, which at 37/30◦C showed lower contents of neoxanthin, VAZ pool, DEPS, lutein, β- and total carotenes, total Car, and Chl (a + b) relative to their 380-counterparts.
FIGURE 1 | Leaf fluorescence parameters related to the photoinhibition status of PSII in C. canephora cv. Conilon (CL153) and C. arabica (Icatu and IPR108) plants, which were grown under 380 or 700 µL CO2L−1and submitted to control (25/20◦C, day/night) and supra-optimal temperatures of 31/25◦C, 37/30◦C, or 42/34◦C. The parameters include the calculation of (A) PI
Dyn, dynamic photoinhibition, (B) PIChr, chronic photoinhibition, and (C) PITotal, total photoinhibition. For each parameter, the mean values ± SE (n = 5–8) followed by different letters express significant differences between temperature treatments for the same CO2level, separately for each genotype (a, b), or between CO2levels for each temperature treatment, separately for each genotype (A, B).
However, no significant differences associated with [CO2] treatments could be found at 42/34◦C. In contrast to [CO
2] treatment, increasing temperature remarkably impacted the C. arabica genotypes regardless of [CO2], as denoted by the increases in total Chls and total Car, reaching maximal values at 37/30◦C or 42/34◦C. The rise in total Car was related to
increases in neoxanthin, Z and, especially, lutein and β-carotene (Table 2). In fact, at 42/34◦C, rises in lutein pools reached 84 and 105% in Icatu, and 47 and 65% in IPR108, for the 380-and 700-plants, respectively, whereas the β-carotene pools increased ca. 40% in Icatu under both [CO2] conditions. In IPR108, maximal increases in β-carotene were found at
37/30◦C, although with significance only for the 700-plants (42%).
Specifically regarding the photoprotective Z, moderately low values were maintained over the course of the experiment, but at 42/34◦C significant Z increases (in parallel with moderate increases in DEPS) were observed in Icatu and IPR108 regardless of [CO2], as well as in CL153 380-plants. Furthermore, at 42/34◦C most pigments (with the referred exceptions related to lutein and β-carotene) tended to lower concentrations than those observed at 37/30◦C.
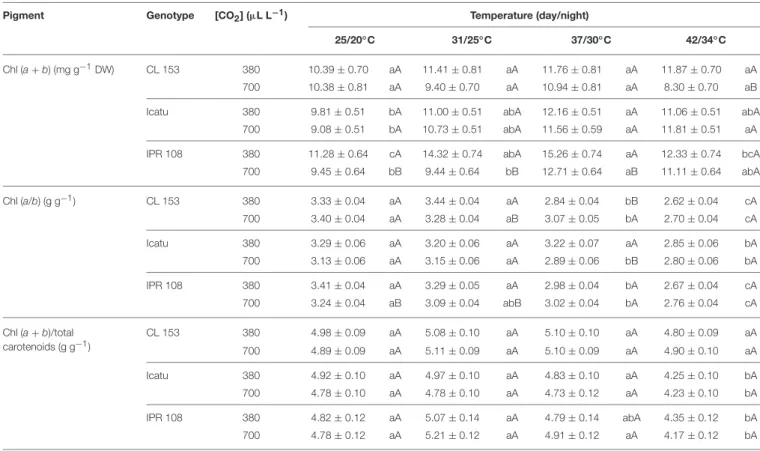
A moderate rise in total Chl was observed in C. arabica genotypes for both CO2 treatments, mostly until 37/30◦C, as compared to 25/20◦C values. In CL153 temperature rising did not provoke significantl changes in total Chl content within each [CO2]. However, at 42/34◦C the CL153 700-plants displayed lower Chl content than 380-plants, resulting from slight divergent shifts promoted by temperature in these plant groups (Table 3). The values of Chl (a/b) ratio were similar between [CO2], but decreased at the two highest temperatures in all genotypes. Finally, the total Chl-to-total Car ratio, reflecting the light capture-to-dissipation pigment ratio, was quite stable until 37/30◦C, but strongly decreased at 42/34◦C in the C. arabica genotypes. No differences were found in this ratio in response to [CO2] over the entire experiment in all genotypes.
Antioxidant Enzyme Activities
The activities of the antioxidant enzymes (Table 4) showed some differences at control temperature among genotypes in response to [CO2], although the values were maintained within the range usually observed for genotypes of both C. arabica and C. canephora (Ramalho et al., 1998; Chaves et al., 2008; Fortunato
et al., 2010; Pompelli et al., 2010). For all enzymes (Cu,Zn-SOD,
APX, GR, CAT), IPR108 700-plants showed lower activities than 380-plants. In Icatu and CL153 that same trend was observed for GR and CAT, contrasting to higher activities observed in the 700-plants for APX and Cu,Zn-SOD (significantly only for the latter).
With temperature rise to 37/30◦C, enzyme activities changed differently with respect to genotype and [CO2] conditions (Table 4). In CL153 380-plants, increases were found in APX, GR and CAT, whereas in the 700-plants only CAT activity was increased. In Icatu, increases in GR and CAT were observed under both CO2 conditions, whereas some decrease was found in Cu,Zn-SOD and APX (the latter only in the 700-plants). In IPR108, different patterns were observed related to [CO2], with activity increases in 700-plants (significantly for Cu,Zn-SOD and CAT), and decreases in 380-plants (non-significantly for CAT) in all enzymes.
Pronounced changes in enzyme activities were further noted when temperature increased from 37/30 to 42/34◦C. In CL153 plants, regardless of [CO2], Cu,Zn-SOD and GR activities remained invariant in parallel with an enhanced CAT activity (53% for 380 plants and 189% for 700-plants), whereas APX activity was remarkably reduced (46 and 66% in 380- and 700-plants, respectively). Within C. arabica genotypes, Icatu displayed reductions in APX (near to 10% of the initial value, irrespective of [CO2]), GR and CAT (380-plants) and Cu,Zn-SOD (700-plants),
in parallel with increases in both GR and CAT (700-plants) as well as in Cu,Zn-SOD (380-plants). In IPR108, the 700-plants showed increased activities of Cu,Zn-SOD (28%), APX (30%), GR (40%), and CAT, but only the activity of CAT varied significantly in response to [CO2] treatments.
In summary, APX was the most negatively affected enzyme at the highest temperature (in CL153 and Icatu), CAT activity increased or remained invariant, whereas Cu,Zn-SOD was the less responsive enzyme to heat stress.
Other Protective Molecules
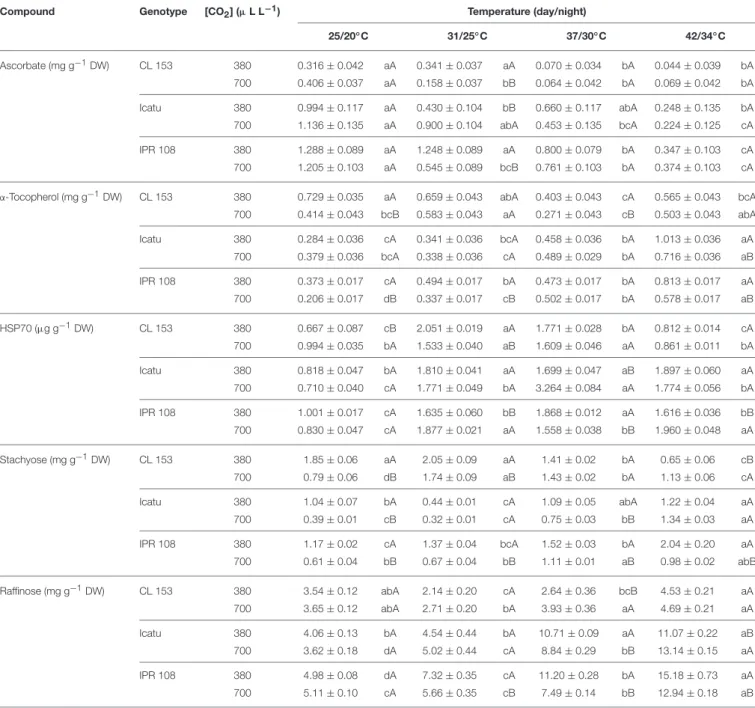
Ascorbate (ASC) content was similar between CO2 conditions within each genotype under control temperature. However, C. arabica genotypes showed ca. three-fold higher ASC contents than those in CL153 (Table 5). Overall, ASC pools were clearly reduced with increasing temperatures, beginning at 31/25◦C for CL153 and IPR108 700-plants, and for Icatu 380-plants. Remarkable decreases were observed at the two highest temperatures, ranging from 69 (IPR108-700) to 86% (CL153-380), as compared with the control temperature.
α-tocopherol (TOC) showed different trends between the two coffee species. Despite some fluctuations with rising temperatures, at 42/34◦C TOC pools changed moderately in CL153 irrespective of [CO2], with a 22% decrease in 380-plants and a 21% rise in 700-plants. In contrast, at 42/34◦C and under both CO2conditions, TOC pools increased in Icatu and IPR108, ranging from 89 (Icatu-700) to 257% (Icatu-380), with 380-plants presenting the highest contents.
At 25/20◦C the 700-plants showed similar (raffinose) or lower (stachyose) contents of RFOs than their 380-plant counterparts. Temperature rise prompted modifications in RFOs, with no clear relation with the [CO2] treatments. In CL153, significant increases were observed only for stachyose in the 700-plants from 31/25◦C onwards. On the other hand, at 42/34◦C, both stachyose and raffinose displayed greater contents in C. arabica plants, when compared to 25/20◦C, particularly raffinose whose contents increased between 153% (IPR108-700) and 263% (Icatu-700). Also, in IPR108, both RFOs content were always higher in the 380-plants at supra-optimal temperatures.
The constitutive cell HSP70 pools (25/20◦C) were similar between [CO2] in C. arabica genotypes, but presented a higher value in CL153 700-plants. Rising temperature clearly promoted HSP70 accumulation: significantly higher HSP70 contents were already observed at 31/25◦C in all genotypes, which were mostly maintained until 42/34◦C (C. arabica plants) or until 37/30◦C in CL153 (decreasing afterwards). In all genotypes, maximal HSP70 contents, relative to control temperature, were observed in CL153-380 at 31/25◦C (208%), and in the 700-plants of Icatu at 37/30◦C (360%) and IPR108 at 42/34◦C (136%).
Expression of Genes with a Potential Role
in Heat Acclimation
Several changes in gene expression patterns were imposed by enhanced [CO2] and temperature (Table 6). At 25/20◦C, the expression of genes coding for the protective proteins HSP70, ELIP, Chape 20 and Chape 60 was similar or lower in the 700-plants compared with their 380-plant counterparts in all
TABLE 2 | Changes in leaf content (mg g−1DW) of xanthophylls and carotenes, obtained through HPLC determinations in C. canephora cv. Conilon (CL153) and C. arabica (Icatu and IPR108) plants, grown under 380 or 700 µLCO2L−1, at control (25/20◦C, day/night) and supra-optimal temperatures of 31/25◦C, 37/30◦C, and 42/34◦C.
Pigment Genotype [CO2] (µL L−1) Temperature (day/night)
25/20◦C 31/25◦C 37/30◦C 42/34◦C Neoxanthin (mg g−1DW) CL 153 380 0.206 ± 0.019 aB 0.225 ± 0.019 aA 0.255 ± 0.021 aA 0.245 ± 0.019 aA 700 0.267 ± 0.019 aA 0.216 ± 0.021 abA 0.233 ± 0.021 abA 0.182 ± 0.019 bB Icatu 380 0.216 ± 0.012 aA 0.224 ± 0.010 aA 0.245 ± 0.010 aA 0.241 ± 0.010 aA 700 0.218 ± 0.012 bA 0.223 ± 0.010 bA 0.263 ± 0.010 aA 0.252 ± 0.010 abA IPR 108 380 0.276 ± 0.016 aA 0.311 ± 0.016 aA 0.322 ± 0.016 aA 0.276 ± 0.014 aA 700 0.216 ± 0.014 bB 0.291 ± 0.016 aA 0.266 ± 0.014 abB 0.239 ± 0.014 abA Zeaxanthin (mg g−1DW) CL 153 380 0.041 ± 0.007 bA 0.046 ± 0.009 bA 0.036 ± 0.007 bA 0.085 ± 0.009 aA 700 0.057 ± 0.007 aA 0.030 ± 0.007 aA 0.042 ± 0.009 aA 0.039 ± 0.009 aB Icatu 380 0.053 ± 0.009 abA 0.037 ± 0.009 bA 0.032 ± 0.010 bB 0.083 ± 0.010 aA 700 0.066 ± 0.010 abA 0.039 ± 0.009 bA 0.064 ± 0.010 abA 0.075 ± 0.009 aA IPR 108 380 0.032 ± 0.010 bA 0.028 ± 0.008 bA 0.101 ± 0.009 aA 0.080 ± 0.008 aA 700 0.040 ± 0.009 bA 0.040 ± 0.008 bA 0.041 ± 0.008 bB 0.089 ± 0.008 aA V + A + Z (mg g−1DW) CL 153 380 0.318 ± 0.022 aA 0.318 ± 0.022 aA 0.342 ± 0.026 aA 0.288 ± 0.022 aA 700 0.341 ± 0.026 aA 0.249 ± 0.026 abB 0.288 ± 0.026 abA 0.221 ± 0.022 bB Icatu 380 0.375 ± 0.019 abA 0.409 ± 0.019 aA 0.337 ± 0.019 bB 0.306 ± 0.019 bA 700 0.300 ± 0.022 bB 0.407 ± 0.019 aA 0.416 ± 0.022 aA 0.312 ± 0.019 bA IPR 108 380 0.451 ± 0.031 abA 0.482 ± 0.031 aA 0.494 ± 0.027 aA 0.348 ± 0.027 bA 700 0.338 ± 0.027 aB 0.428 ± 0.031 aA 0.392 ± 0.027 aB 0.349 ± 0.031 aA DEPS CL 153 380 0.169 ± 0.026 bA 0.198 ± 0.030 bA 0.186 ± 0.026 bA 0.359 ± 0.030 aA 700 0.214 ± 0.026 aA 0.118 ± 0.026 aB 0.224 ± 0.030 aA 0.204 ± 0.026 aB Icatu 380 0.180 ± 0.028 bA 0.103 ± 0.026 bA 0.121 ± 0.030 bA 0.337 ± 0.030 aA 700 0.248 ± 0.030 abA 0.125 ± 0.026 cA 0.178 ± 0.030 bcA 0.307 ± 0.026 aA IPR 108 380 0.084 ± 0.024 cB 0.072 ± 0.019 cB 0.219 ± 0.022 bA 0.341 ± 0.019 aA 700 0.187 ± 0.022 bA 0.136 ± 0.020 bA 0.124 ± 0.020 bB 0.337 ± 0.019 aA Lutein (mg g−1 DW) CL 153 380 0.622 ± 0.041 bA 0.709 ± 0.041 bA 0.756 ± 0.047 abA 0.886 ± 0.041 aA 700 0.719 ± 0.047 aA 0.519 ± 0.041 bB 0.674 ± 0.047 abA 0.603 ± 0.041 abB Icatu 380 0.637 ± 0.037 cA 0.704 ± 0.037 cA 0.878 ± 0.037 bA 1.17 ± 0.037 aA 700 0.560 ± 0.043 cA 0.690 ± 0.037 cA 0.911 ± 0.037 bA 1.15 ± 0.037 aA IPR 108 380 0.828 ± 0.061 bA 0.846 ± 0.053 bA 1.226 ± 0.053 aA 1.21 ± 0.053 aA 700 0.672 ± 0.053 cA 0.846 ± 0.061 bcA 0.936 ± 0.053 abB 1.11 ± 0.053 aA α-Carotene (mg g−1DW) CL 153 380 0.163 ± 0.032 bB 0.194 ± 0.032 abA 0.298 ± 0.037 aA 0.198 ± 0.032 abA 700 0.271 ± 0.032 aA 0.190 ± 0.032 aA 0.273 ± 0.037 aA 0.179 ± 0.032 aA Icatu 380 0.177 ± 0.016 bA 0.164 ± 0.016 bA 0.310 ± 0.019 aA 0.145 ± 0.016 bA 700 0.164 ± 0.019 bA 0.168 ± 0.016 bA 0.249 ± 0.016 aB 0.172 ± 0.019 bA IPR 108 380 0.243 ± 0.024 abA 0.264 ± 0.024 aA 0.256 ± 0.024 aA 0.160 ± 0.021 bA 700 0.137 ± 0.021 bB 0.241 ± 0.024 aA 0.261 ± 0.024 aA 0.147 ± 0.021 bA β-Carotene (mg g−1DW) CL 153 380 0.237 ± 0.015 aB 0.287 ± 0.015 aA 0.258 ± 0.018 aA 0.263 ± 0.015 aA 700 0.286 ± 0.015 aA 0.226 ± 0.015 bB 0.234 ± 0.018 abA 0.195 ± 0.015 bB (Continued)
TABLE 2 | Continued
Pigment Genotype [CO2] (µL L−1) Temperature (day/night)
25/20◦C 31/25◦C 37/30◦C 42/34◦C Icatu 380 0.240 ± 0.018 bA 0.294 ± 0.018 abA 0.315 ± 0.018 aA 0.330 ± 0.018 aA 700 0.227 ± 0.018 bA 0.276 ± 0.018 abA 0.310 ± 0.018 aA 0.328 ± 0.018 aA IPR 108 380 0.330 ± 0.014 abA 0.341 ± 0.014 aA 0.368 ± 0.014 aA 0.285 ± 0.012 bA 700 0.227 ± 0.012 bB 0.313 ± 0.014 aA 0.323 ± 0.012 aB 0.298 ± 0.012 aA (α + β) Carotene (mg g−1DW) CL 153 380 0.400 ± 0.022 bB 0.481 ± 0.034 abA 0.556 ± 0.019 aA 0.461 ± 0.043 abA 700 0.557 ± 0.043 aA 0.416 ± 0.037 abA 0.507 ± 0.023 aA 0.374 ± 0.041 bA Icatu 380 0.418 ± 0.025 bA 0.458 ± 0.013 bA 0.581 ± 0.030 aA 0.475 ± 0.036 abA 700 0.371 ± 0.019 bA 0.444 ± 0.030 abA 0.559 ± 0.045 aA 0.484 ± 0.012 abA IPR 108 380 0.572 ± 0.036 aA 0.605 ± 0.027 aA 0.624 ± 0.016 aA 0.446 ± 0.023 bA 700 0.364 ± 0.016 bB 0.553 ± 0.038 aA 0.550 ± 0.029 aA 0.445 ± 0.025 abA (α/β) Carotene (g g−1) CL 153 380 0.697 ± 0.089 bA 0.669 ± 0.089 bA 1.164 ± 0.102 aA 0.737 ± 0.089 bA 700 0.882 ± 0.089 aA 0.821 ± 0.089 aA 1.169 ± 0.102 aA 0.879 ± 0.089 aA Icatu 380 0.742 ± 0.073 bA 0.570 ± 0.073 bcA 1.051 ± 0.084 aA 0.432 ± 0.073 cA 700 0.639 ± 0.073 abA 0.612 ± 0.073 abA 0.855 ± 0.073 aA 0.523 ± 0.084 bA IPR 108 380 0.731 ± 0.077 aA 0.778 ± 0.077 aA 0.705 ± 0.077 aA 0.583 ± 0.067 aA 700 0.499 ± 0.077 bB 0.763 ± 0.077 abA 0.818 ± 0.077 aA 0.495 ± 0.067 bA Total carotenoids (mg g−1DW) CL 153 380 1.55 ± 0.12 aA 1.73 ± 0.12 aA 1.91 ± 0.13 aA 1.88 ± 0.12 aA 700 1.75 ± 0.13 aA 1.43 ± 0.12 aA 1.70 ± 0.13 aA 1.38 ± 0.12 aB
Icatu 380 1.63 ± 0.07 cA 1.79 ± 0.07 bcA 2.04 ± 0.07 abA 2.19 ± 0.07 aA
700 1.39 ± 0.08 cB 1.89 ± 0.08 bA 2.24 ± 0.08 aA 2.20 ± 0.07 aA IPR 108 380 2.13 ± 0.14 bA 2.29 ± 0.14 bA 2.82 ± 0.12 aA 2.36 ± 0.14 abA 700 1.59 ± 0.12 bB 2.12 ± 0.14 aA 2.14 ± 0.12 aB 2.14 ± 0.12 aA (V + A + Z)/Total carotenoids (g g−1) CL 153 380 0.205 ± 0.005 aA 0.184 ± 0.005 bB 0.179 ± 0.006 bA 0.153 ± 0.005 cA 700 0.193 ± 0.006 aA 0.201 ± 0.006 aA 0.169 ± 0.006 bA 0.159 ± 0.005 bA Icatu 380 0.230 ± 0.006 aA 0.227 ± 0.006 aA 0.165 ± 0.006 bB 0.140 ± 0.006 cA 700 0.216 ± 0.007 aA 0.232 ± 0.006 aA 0.186 ± 0.007 bA 0.143 ± 0.006 cA IPR 108 380 0.213 ± 0.006 aA 0.210 ± 0.006 aA 0.173 ± 0.005 bA 0.149 ± 0.006 cA 700 0.212 ± 0.005 aA 0.203 ± 0.005 aA 0.182 ± 0.005 bA 0.163 ± 0.005 bA
For each parameter, the mean values ± SE (n = 6) followed by different letters express significant differences between temperatures for the same CO2treatment, separately for each
genotype (a, b, c, d), or between CO2treatments for each temperature, separately for each genotype (A, B).
genotypes. With rising temperature a global gene upregulation was observed (maximal at 42/34◦C) in all genotypes and both [CO2], although stronger in the 700-plants of Icatu and CL153 and 380-plants of IPR. Notably, CL153 700-plants showed the highest increases: ca. 33- (Chape 60), 55- (ELIP), 59- (HSP70), and 145- (Chape 20) fold.
Overall, the expression patterns of genes related to antioxidative system components (CAT, SOD, APX, and TOC) tended to be lower in the 700-plants than in the 380-plants at the control temperature, mainly in the two C. arabica genotypes (except for CAT). Under rising temperatures CAT expression increased moderately (below three-fold) in most
cases, and more markedly in CL153 700-plants (10-fold). The APX transcripts (particularly APX Cyt) increased with heat, with maximal abundance at 42/34◦C, especially in Icatu and CL153 700-plants. In fact, the APX Cyt upregulation in CL153-700 (1760-fold) was, by far, the largest observed over the entire experiment for all studied genes. In contrast, CuSOD1 and FeSOD genes were mainly downregulated by temperature in all genotypes. Among the genes coding for SOD enzymes, only CuSOD2 was significantly upregulated at the two highest temperatures in both [CO2] in Icatu, and at 42/34◦C in CL153-700 and IPR-380 plants. TOC genes were mainly downregulated (except CL153 700-plants). Notably, IPR108 had the strongest
TABLE 3 | Changes in leaf content of total chlorophyll, Chl (a + b) (mg g−1DW), and in the ratios of a-to-b chlorophyll and of total chlorophyll-to-total carotenoids, obtained through spectrophotometric determinations, in C. canephora cv. Conilon (CL153) and C. arabica (Icatu and IPR108) plants, grown under 380 or 700 µLCO2L−1, at control (25/20◦C, day/night) and supra-optimal temperatures of 31/25◦C, 37/30◦C, and 42/34◦C.
Pigment Genotype [CO2] (µL L−1) Temperature (day/night)
25/20◦C 31/25◦C 37/30◦C 42/34◦C
Chl (a + b) (mg g−1DW) CL 153 380 10.39 ± 0.70 aA 11.41 ± 0.81 aA 11.76 ± 0.81 aA 11.87 ± 0.70 aA 700 10.38 ± 0.81 aA 9.40 ± 0.70 aA 10.94 ± 0.81 aA 8.30 ± 0.70 aB
Icatu 380 9.81 ± 0.51 bA 11.00 ± 0.51 abA 12.16 ± 0.51 aA 11.06 ± 0.51 abA
700 9.08 ± 0.51 bA 10.73 ± 0.51 abA 11.56 ± 0.59 aA 11.81 ± 0.51 aA
IPR 108 380 11.28 ± 0.64 cA 14.32 ± 0.74 abA 15.26 ± 0.74 aA 12.33 ± 0.74 bcA 700 9.45 ± 0.64 bB 9.44 ± 0.64 bB 12.71 ± 0.64 aB 11.11 ± 0.64 abA Chl (a/b) (g g−1) CL 153 380 3.33 ± 0.04 aA 3.44 ± 0.04 aA 2.84 ± 0.04 bB 2.62 ± 0.04 cA 700 3.40 ± 0.04 aA 3.28 ± 0.04 aB 3.07 ± 0.05 bA 2.70 ± 0.04 cA Icatu 380 3.29 ± 0.06 aA 3.20 ± 0.06 aA 3.22 ± 0.07 aA 2.85 ± 0.06 bA 700 3.13 ± 0.06 aA 3.15 ± 0.06 aA 2.89 ± 0.06 bB 2.80 ± 0.06 bA IPR 108 380 3.41 ± 0.04 aA 3.29 ± 0.05 aA 2.98 ± 0.04 bA 2.67 ± 0.04 cA 700 3.24 ± 0.04 aB 3.09 ± 0.04 abB 3.02 ± 0.04 bA 2.76 ± 0.04 cA Chl (a + b)/total carotenoids (g g−1) CL 153 380 4.98 ± 0.09 aA 5.08 ± 0.10 aA 5.10 ± 0.10 aA 4.80 ± 0.09 aA 700 4.89 ± 0.09 aA 5.11 ± 0.09 aA 5.10 ± 0.09 aA 4.90 ± 0.10 aA Icatu 380 4.92 ± 0.10 aA 4.97 ± 0.10 aA 4.83 ± 0.10 aA 4.25 ± 0.10 bA 700 4.78 ± 0.10 aA 4.78 ± 0.10 aA 4.73 ± 0.12 aA 4.23 ± 0.10 bA IPR 108 380 4.82 ± 0.12 aA 5.07 ± 0.14 aA 4.79 ± 0.14 abA 4.35 ± 0.12 bA 700 4.78 ± 0.12 aA 5.21 ± 0.12 aA 4.91 ± 0.12 aA 4.17 ± 0.12 bA
For each parameter, the mean values ± SE (n = 6) followed by different letters express significant differences between temperatures for the same CO2treatment, separately for each
genotype (a, b, c, d), or between CO2treatments for each temperature, separately for each genotype (A, B).
global downregulation for the genes related to the antioxidative system, with the exception of APX Cyt at 42/34◦C in 380-plants.
DISCUSSION
PSII Photoinhibition in Face of High CO
2and Temperature
The balance of energy use and/or dissipation capabilities, herein analyzed using the dynamic (PIDyn) and chronic (PIChr) PSII photoinhibition estimates (Figures 1A,B), remained nearly invariant until 37/30◦C, a temperature that is considered well above the optimum for both C. arabica and C. canephora
(DaMatta and Ramalho, 2006). These results evidence a
considerable heat tolerance of the coffee’s photosynthetic machinery until 37/30◦C, which is accompanied by the maintenance of photochemical energy use (Rodrigues et al., 2016). In fact, photochemical components and RuBisCO activity were strengthened (especially under high [CO2]), in contrast to what is often observed in other species even at moderately high temperature (e.g., Haldimann and Feller, 2004). In sharp contrast, increases in both PIChr (and PITotal) were evident at 42/34◦C (Figures 1B,C) in 380-plants, particularly in Icatu. This reflected a mitigatory impact of elevated [CO2] on the photochemical functioning, in line with the lower rate constant
for PSII inactivation (Fs/F′m) and non-photochemical quenching attributable to photo-inactivation and non-regulated energy dissipation in PSII (Y(NO)) observed in 700 plants at 42/34◦C (Rodrigues et al., 2016). Taking all of this information together, it is clear that tolerance to heat stress was compromised at 42/34◦C at normal [CO2], whereas at elevated [CO2] a mitigating effect against heat impacts was evident in this study. Similar findings have been reported in other species, where elevated [CO2] has been shown to preserve the photosynthetic functioning, as in the Mediterranean cork oak (Quercus suber) under the exposure to supra-optimal temperatures (Faria et al., 1996).
Triggering Heat-Protective Mechanisms
under Enhanced [CO
2]
Thermotolerance frequently involves the triggering of cellular mechanisms that prevent oxidative damage, interlinking temperature stress, and a balance between ROS signaling and control (Suzuki and Mittler, 2006; Hasanuzzaman et al., 2013). In addition, the strengthening of antioxidative mechanisms has proven to be decisive to stress acclimation in Coffea spp., namely, to cold, high irradiance, drought and nitrogen starvation (Ramalho et al., 1998, 2014; Fortunato et al., 2010;
Batista-Santos et al., 2011; Cavatte et al., 2012). Therefore, under
TABLE 4 | Changes in chloroplastic maximal activities of the enzyme antioxidants Cu,Zn-superoxide dismutase (Cu,Zn-SOD), ascorbate peroxidase (APX), glutathione reductase (GR), as well as in cellular catalase in C. canephora cv. Conilon (CL153) and C. arabica (Icatu and IPR108) plants, grown under 380 or 700 µLCO2L−1, at control (25/20◦C, day/night) and maximal temperature exposure (42/34◦C).
Enzyme Genotype [CO2] (µL L−1) Temperature (day/night)
25/20◦C 37/30◦C 42/34◦C Cu,Zn-SOD (Units g−1DW) CL 153 380 449 ± 4 aB 423 ± 5 aA 426 ± 10 aB 700 537 ± 7 aA 444 ± 7 bA 525 ± 8 aA Icatu 380 523 ± 4 bB 431 ± 14 cA 602 ± 9 aA 700 648 ± 11 aA 413 ± 3 cA 498 ± 9 bB IPR 108 380 568 ± 14 aA 437 ± 9 bB 555 ± 13 aA 700 450 ± 4 cB 694 ± 3 aA 577 ± 7 bA
APX (mmol ASC min−1g−1DW) CL 153 380 7.23 ± 1.15 bA 13.05 ± 1.27 aA 3.94 ± 1.10 bA
700 9.85 ± 0.61 aA 8.40 ± 0.78 aB 3.38 ± 0.29 bA
Icatu 380 11.04 ± 1.66 aA 10.22 ± 0.96 aA 1.32 ± 0.22 bA
700 14.88 ± 0.89 aA 10.97 ± 1.70 bA 1.07 ± 0.28 cA
IPR 108 380 5.28 ± 0.76 aA 0.62 ± 0.21 bA 4.23 ± 0.38 aA
700 1.68 ± 0.23 aB 1.92 ± 0.28 aA 2.18 ± 0.12 aB
GR (µmol NADPH min−1g−1DW) CL 153 380 0.790 ± 0.110 bA 1.282 ± 0.108 aA 0.794 ± 0.088 bA
700 0.435 ± 0.056 aA 0.571 ± 0.020 aB 0.455 ± 0.054 aA
Icatu 380 1.179 ± 0.019 bA 1.816 ± 0.221 aA 0.395 ± 0.053 cB
700 0.777 ± 0.084 bB 1.019 ± 0.118 abB 1.105 ± 0.037 aA
IPR 108 380 1.396 ± 0.121 aA 0.696 ± 0.112 bA 0.440 ± 0.037 bA
700 0.400 ± 0.019 aB 0.478 ± 0.032 aA 0.560 ± 0.028 aA
Catalase (µmol H2O2min−1g−1DW) CL 153 380 8.55 ± 0.93 bA 12.42 ± 0.85 aA 13.07 ± 0.96 aA
700 4.67 ± 1.00 bB 10.49 ± 1.30 aA 13.48 ± 1.44 aA
Icatu 380 7.62 ± 1.47 bA 17.72 ± 3.69 aA 5.37 ± 1.27 bB
700 5.67 ± 1.19 bA 10.34 ± 0.88 aB 12.77 ± 0.54 aA
IPR 108 380 17.87 ± 1.15 aA 14.88 ± 0.93 aB 13.57 ± 1.16 aB
700 13.09 ± 0.69 bB 21.02 ± 2.33 aA 23.80 ± 0.43 aA
For each parameter, the mean values ± SE (n = 4) followed by different letters express significant differences between temperatures for the same CO2treatment, separately for each
genotype (a, b), or between CO2treatments for each temperature, separately for each genotype (A, B).
expected, supporting an unaltered photosynthetic functioning up to 37/30◦C in addition to maintaining a better metabolic performance even at 42/34◦C, when compared to normal [CO
2], as reported previously (Rodrigues et al., 2016).
Pigment Dynamics
Carotenoids act as thermal quenchers and scavengers of highly reactive species of Chl and O2. Under control temperature, the high [CO2] prompted a tendency to higher carotenoid contents in CL153. This contrasted with a reduction trend in photoprotective carotenoids (VAZ pool, lutein, carotenes) in C. arabica genotypes, similarly to what has been found in other species, where a relaxation of the antioxidant system was associated with a higher C-assimilation that ultimately led to a reduced energy load on the photosynthetic apparatus (Erice et al., 2007).
Under supra-optimal temperatures, decreases of most carotenoids were found in the 700-plants of CL153 (and IPR108 until 37/30◦C), when compared to their respective 380-plants. In contrast, C. arabica genotypes showed increased total Chl and total Car contents regardless of [CO2], suggesting a photosynthetic structures strengthening at 37/30◦C (and even at 42/34◦C in some cases) driven by temperature. Increases in total Car resulted mostly from the moderate Z increases and the strong rises in lutein and β-carotene that have complementary actions, decreasing the formation of highly reactive species of Chl and oxygen, preventing PSs and membrane photodamage, and protecting the Cyt b6/f complex from photobleaching promoted by1O
2 (Zhang et al., 1999). Z protects LHCs from
both PSs by controlling 3Chl∗ and 1Chl∗ formation and by removing epoxy groups from the oxidized double bonds from the lipid phase of thylakoid fatty acids, whereas β-carotene and
TABLE 5 | Changes in the cellular content of the non-enzyme antioxidant molecules ascorbate and α-tocopherol, as well as HSP70 and the soluble sugars stachyose and, raffinose in C. canephora cv. Conilon (CL153) and C. arabica (Icatu and IPR108) plants, grown under 380 or 700 µLCO2L−1, at control (25/20◦C, day/night) and supra-optimal temperatures of 31/25◦C, 37/30◦C, and 42/34◦C.
Compound Genotype [CO2] (µ L L−1) Temperature (day/night)
25/20◦C 31/25◦C 37/30◦C 42/34◦C Ascorbate (mg g−1DW) CL 153 380 0.316 ± 0.042 aA 0.341 ± 0.037 aA 0.070 ± 0.034 bA 0.044 ± 0.039 bA 700 0.406 ± 0.037 aA 0.158 ± 0.037 bB 0.064 ± 0.042 bA 0.069 ± 0.042 bA Icatu 380 0.994 ± 0.117 aA 0.430 ± 0.104 bB 0.660 ± 0.117 abA 0.248 ± 0.135 bA 700 1.136 ± 0.135 aA 0.900 ± 0.104 abA 0.453 ± 0.135 bcA 0.224 ± 0.125 cA IPR 108 380 1.288 ± 0.089 aA 1.248 ± 0.089 aA 0.800 ± 0.079 bA 0.347 ± 0.103 cA 700 1.205 ± 0.103 aA 0.545 ± 0.089 bcB 0.761 ± 0.103 bA 0.374 ± 0.103 cA
α-Tocopherol (mg g−1DW) CL 153 380 0.729 ± 0.035 aA 0.659 ± 0.043 abA 0.403 ± 0.043 cA 0.565 ± 0.043 bcA 700 0.414 ± 0.043 bcB 0.583 ± 0.043 aA 0.271 ± 0.043 cB 0.503 ± 0.043 abA Icatu 380 0.284 ± 0.036 cA 0.341 ± 0.036 bcA 0.458 ± 0.036 bA 1.013 ± 0.036 aA 700 0.379 ± 0.036 bcA 0.338 ± 0.036 cA 0.489 ± 0.029 bA 0.716 ± 0.036 aB IPR 108 380 0.373 ± 0.017 cA 0.494 ± 0.017 bA 0.473 ± 0.017 bA 0.813 ± 0.017 aA 700 0.206 ± 0.017 dB 0.337 ± 0.017 cB 0.502 ± 0.017 bA 0.578 ± 0.017 aB HSP70 (µg g−1DW) CL 153 380 0.667 ± 0.087 cB 2.051 ± 0.019 aA 1.771 ± 0.028 bA 0.812 ± 0.014 cA 700 0.994 ± 0.035 bA 1.533 ± 0.040 aB 1.609 ± 0.046 aA 0.861 ± 0.011 bA Icatu 380 0.818 ± 0.047 bA 1.810 ± 0.041 aA 1.699 ± 0.047 aB 1.897 ± 0.060 aA 700 0.710 ± 0.040 cA 1.771 ± 0.049 bA 3.264 ± 0.084 aA 1.774 ± 0.056 bA IPR 108 380 1.001 ± 0.017 cA 1.635 ± 0.060 bB 1.868 ± 0.012 aA 1.616 ± 0.036 bB 700 0.830 ± 0.047 cA 1.877 ± 0.021 aA 1.558 ± 0.038 bB 1.960 ± 0.048 aA Stachyose (mg g−1DW) CL 153 380 1.85 ± 0.06 aA 2.05 ± 0.09 aA 1.41 ± 0.02 bA 0.65 ± 0.06 cB 700 0.79 ± 0.06 dB 1.74 ± 0.09 aB 1.43 ± 0.02 bA 1.13 ± 0.06 cA Icatu 380 1.04 ± 0.07 bA 0.44 ± 0.01 cA 1.09 ± 0.05 abA 1.22 ± 0.04 aA 700 0.39 ± 0.01 cB 0.32 ± 0.01 cA 0.75 ± 0.03 bB 1.34 ± 0.03 aA IPR 108 380 1.17 ± 0.02 cA 1.37 ± 0.04 bcA 1.52 ± 0.03 bA 2.04 ± 0.20 aA 700 0.61 ± 0.04 bB 0.67 ± 0.04 bB 1.11 ± 0.01 aB 0.98 ± 0.02 abB Raffinose (mg g−1DW) CL 153 380 3.54 ± 0.12 abA 2.14 ± 0.20 cA 2.64 ± 0.36 bcB 4.53 ± 0.21 aA 700 3.65 ± 0.12 abA 2.71 ± 0.20 bA 3.93 ± 0.36 aA 4.69 ± 0.21 aA Icatu 380 4.06 ± 0.13 bA 4.54 ± 0.44 bA 10.71 ± 0.09 aA 11.07 ± 0.22 aB 700 3.62 ± 0.18 dA 5.02 ± 0.44 cA 8.84 ± 0.29 bB 13.14 ± 0.15 aA IPR 108 380 4.98 ± 0.08 dA 7.32 ± 0.35 cA 11.20 ± 0.28 bA 15.18 ± 0.73 aA 700 5.11 ± 0.10 cA 5.66 ± 0.35 cB 7.49 ± 0.14 bB 12.94 ± 0.18 aB
For each parameter, the mean values ± SE (n = 4–6) followed by different letters express significant differences between temperatures for the same CO2treatment, separately for each
genotype (a, b, c, d), or between CO2treatments for each temperature, separately for each genotype (A, B).
lutein-epoxide cycle (and neoxanthin) quenches3Chl∗and1O 2, which are lipoperoxidation initiators (Lichtenthaler and Babani,
2004; Logan, 2005; Kalituho et al., 2007; Matsubara et al., 2011).
In addition, neoxanthin maintenance and lutein increase might improve antennae functionality given that these xanthophylls are integral components of the peripheral LHC and are important for its trimeric assembly, stability, and efficiency (Kalituho et al.,
2007; Matsubara et al., 2011). These functions agree with the
maintenance of PSI and PSII activities in C. arabica genotypes
until 37/30◦C (Rodrigues et al., 2016). Nevertheless, at 42/34◦C PSII photoinhibition was evident in 380-plants (Figure 1), when pigments (except lutein) tended to lower values (Table 2) when compared with those observed at 37/30◦C. Therefore, changes in photoprotective pigments were not strong enough to protect the PSs in the three genotypes, especially in Icatu, which was the most affected genotype by heat stress. However, the lower photoinhibition status in the 700-plants at 42/34◦C (Figure 1) was not accompanied by clear increases in the pools
T A B L E 6 | R e a l-ti me P C R e x p re s s io n s tu d ie s re la ti v e to th e e x p re s s io n v a lu e o b s e rv e d u n d e r c o n tr o l c o n d it io n s o f te mp e ra tu re a n d C O2 (2 5 /2 0 ◦C , 3 8 0 µ L C O2 L − 1), w it h in e a c h g e n o ty p e fr o m le a v e s o f C . c a n e p h o ra c v. C o n il o n (C L 1 5 3 ) a n d C . a ra b ic a (I c a tu a n d IP R 1 0 8 ) p la n ts , g ro w n u n d e r 3 8 0 o r 7 0 0 µ L C O2 L − 1, a t c o n tr o l (2 5 /2 0 ◦C , d a y /n ig h t) a n d s u p ra -o p ti ma l te mp e ra tu re s o f 3 1 /2 5 ◦C , 3 7 /3 0 ◦C , a n d 4 2 /3 4 ◦C . G e n o ty p e Te mp e ra tu re (d a y /n ig h t) [C O2 ] (µ L L − 1) G e n e e x p re s s io n re la ti v e to c o n tr o l te mp e ra tu re a n d C O2 (2 5 /2 0 ◦C , 3 8 0 µ L L − 1) H S P 7 0 E L IP C h a p e 2 0 C h a p e 6 0 C A T C u S O D 1 C u S O D 2 F e S O D A P X C y t A P X C h l T O C M t T O C C y t C L 1 5 3 2 5 /2 0 ◦C 3 8 0 1 .0 0 1 .0 0 1 .0 0 1 .0 0 1 .0 0 1 .0 0 1 .0 0 1 .0 0 1 .0 0 1 .0 0 1 .0 0 1 .0 0 7 0 0 0 .5 3 0 .6 8 1 .2 8 0 .2 4 0 .8 5 0 .1 6 0 .4 9 1 .6 4 7 .5 3 1 .1 7 0 .8 4 0 .1 7 3 1 /2 5 ◦C 3 8 0 0 .6 0 1 .8 2 3 .5 6 * 0 .5 2 1 .7 0 0 .0 2 * 0 .6 1 1 .1 4 3 .2 6 1 .1 8 0 .0 6 * 0 .3 5 7 0 0 0 .6 4 1 .3 5 0 .6 3 0 .3 7 1 .3 6 0 .1 5 0 .5 6 0 .5 9 2 .7 1 1 .0 7 0 .2 9 0 .1 8 3 7 /3 0 ◦C 3 8 0 1 .9 3 3 .3 3 7 .4 8 * 1 .1 4 1 .7 3 0 .0 2 * 1 .1 0 0 .9 4 3 9 .9 6 * 1 .3 5 0 .0 9 0 .2 4 7 0 0 2 .3 7 6 .7 7 3 .7 6 1 .5 3 1 .6 4 0 .1 6 1 .1 0 1 .2 9 8 1 .8 8 * 3 .2 1 0 .9 5 0 .3 6 4 2 /3 4 ◦C 3 8 0 7 .3 9 8 .3 0 1 6 .6 4 * 6 .2 4 2 .3 7 * 0 .0 8 3 .3 2 1 .2 8 2 5 1 .0 2 * 4 .4 4 0 .3 9 0 .4 3 7 0 0 5 9 .0 4 * 5 4 .5 7 * 1 4 5 .3 1 * 3 3 .1 4 * 1 0 .0 2 * 0 .5 9 2 4 .2 6 * 5 .1 8 1 7 6 1 .0 6 * 9 .5 9 * 2 .6 7 2 .3 0 Ic a tu 2 5 /2 0 ◦C 3 8 0 1 .0 0 1 .0 0 1 .0 0 1 .0 0 1 .0 0 1 .0 0 1 .0 0 1 .0 0 1 .0 0 1 .0 0 1 .0 0 1 .0 0 7 0 0 0 .6 3 1 .6 7 0 .8 1 0 .7 5 2 .0 5 * 0 .4 6 0 .8 0 0 .7 5 0 .8 5 1 .3 6 0 .8 7 0 .7 8 3 1 /2 5 ◦C 3 8 0 0 .9 5 2 .3 3 1 .9 3 1 .1 8 1 .8 8 * 0 .2 9 * 1 .0 0 0 .3 9 * 0 .4 6 * 0 .7 2 0 .4 6 * 0 .9 8 7 0 0 0 .8 7 2 .7 0 1 .7 4 1 .3 2 1 .8 8 * 0 .1 9 * 0 .9 5 0 .4 8 * 1 .1 5 0 .9 1 0 .4 7 1 .1 2 3 7 /3 0 ◦C 3 8 0 2 .7 0 * 4 .7 1 * 4 .0 0 * 2 .8 3 * 1 .8 4 * 0 .1 9 * 1 .3 9 * 0 .5 9 * 0 .5 0 0 .7 1 0 .4 4 0 .7 4 7 0 0 2 .7 4 7 .3 8 3 .2 9 * 3 .4 2 2 .8 6 * 0 .1 3 * 2 .1 3 * 0 .7 7 1 .5 7 2 .8 7 0 .2 2 * 1 .6 5 4 2 /3 4 ◦C 3 8 0 4 .9 6 * 9 .2 8 * 7 .4 0 * 1 4 .6 3 * 1 .7 5 * 0 .0 7 * 2 .8 8 * 0 .4 7 * 7 .9 4 * 1 .4 8 1 .3 1 1 .4 0 7 0 0 9 .3 6 * 1 2 .1 6 * 1 3 .5 2 * 3 4 .1 9 * 1 .2 8 0 .1 5 * 3 .7 5 * 0 .4 9 2 4 .4 9 * 5 .0 4 * 0 .6 2 1 .5 7 IP R 1 0 8 2 5 /2 0 ◦C 3 8 0 1 .0 0 1 .0 0 1 .0 0 1 .0 0 1 .0 0 1 .0 0 1 .0 0 1 .0 0 1 .0 0 1 .0 0 1 .0 0 1 .0 0 7 0 0 0 .3 7 * 1 .4 1 0 .3 6 * 0 .2 7 * 1 .6 6 * 0 .1 9 * 0 .5 8 * 0 .4 4 * 0 .2 7 * 0 .2 3 * 0 .4 9 0 .2 8 * 3 1 /2 5 ◦C 3 8 0 0 .4 0 1 .6 2 * 1 .0 7 0 .7 8 1 .5 5 0 .5 7 0 .9 4 0 .4 7 * 0 .9 0 0 .9 3 0 .5 9 0 .8 5 7 0 0 0 .5 0 * 1 .2 4 0 .8 2 1 .3 6 2 .8 9 * 0 .6 6 1 .1 7 0 .5 4 * 0 .4 2 * 0 .2 3 * 0 .2 5 * 0 .3 3 * 3 7 /3 0 ◦C 3 8 0 2 .0 3 * 6 .5 1 * 4 .1 8 * 3 .0 8 * 2 .0 3 * 4 .1 3 * 0 .7 9 0 .4 4 * 0 .5 5 1 .2 6 0 .8 9 0 .7 7 7 0 0 1 .0 7 3 .1 3 1 .3 0 1 .8 6 0 .9 7 0 .5 7 1 .1 2 0 .3 0 * 0 .1 4 * 0 .3 5 0 .2 1 * 0 .2 5 * 4 2 /3 4 ◦C 3 8 0 4 .5 3 * 1 1 .2 3 * 9 .8 5 * 2 0 .8 3 * 1 .6 7 0 .0 6 1 .9 8 * 0 .4 9 * 1 7 .3 7 * 1 .4 0 0 .6 6 1 .0 0 7 0 0 1 .7 9 4 .1 8 4 .1 2 * 4 .2 5 0 .6 4 0 .9 6 0 .8 5 0 .2 6 2 .7 3 0 .6 1 0 .0 3 * 0 .2 4 * It w e re s tu di e d g e n e s o f th e 7 0 kD a h e a t s h o c k-re la te d pr ote in fr om c h lor opl a s ti c s tr om a (H S P 70) , e a rl y ligh t-in du c e d pr ote in (EL IP ), 20 kD a c h a pe ron in fr om c h lor opl a s t (C h a pe 20) , C h a pe ron in C P N 60 (C h a pe 60) , a ll re la te d to pr o te c ti ve pr o te in s ; th e g e n e s o f c a ta la s e is o zy m e 1 (C A T) , C u ,Zn s u pe rox ide di s m u ta s e s (C u S O D 1 a n d C u S O D 2) , F e -s u pe rox ide di s m u ta s e fr om c h lor opl a s t (F e S O D ), a s c or ba te pe rox ida s e fr om c ytopl a s m (A P X C yt) a n d c h lor opl a s t (A P X C h l), a ll re la te d to a n ti o xi da ti ve e n zy m e s ; a n d pr oba bl e toc oph e rol O -m e th yl tr a n s fe ra s e fr om c h lor opl a s t (T oc Mt) a n d toc oph e rol c yc la s e fr om c h lor opl a s t (T oc C y) re la te d to th e toc oph e rol s yn th e s is pa th w a y. Th e ge n e e xpr e s s ion va lu e s re pr e s e n t n fo ld re la ti ve to th e c o n tr o lo f te m pe ra tu re a n d [C O2 ] (25/ 20 ◦C – 380 µ L C O2 L -1) w ith in e a c h ge n oty pe . O ri gi n a le xpr e s s ion va lu e s for e a c h ge n e re s u lte d fr om th e m e a n ± S E (n = 6– 9) , fr om 3 in de pe n de n t bi ol ogi c a l a s s a ys . *I n di c a te th e pr e s e n c e o f s ta ti s ti c a ls ig n ifi c a n c e .
of photoprotective pigments, suggesting that these molecules are not the only ones accounting for the better preservation of photosynthetic activity under heat stress at elevated [CO2].
Chl-to-Car ratio was quite stable along the experiment in CL153, and until 37/30◦C in C. arabica plants (Table 3). This pattern was independent from [CO2], as also observed in other woody species (Bader et al., 2010). Chl (a/b) ratio showed similar values between [CO2], but decreased in all genotypes at the two highest temperatures, especially at 42/34◦C. Since net degradation of Chls was apparently absent, this Chl (a/b) reduction reflected preferential Chl b synthesis, suggesting functional readjustments with a higher proportion of light harvesting chlorophyll-protein complex from PSII (LHCII), which contains the majority of Chl b (with a Chl a/b ratio around 1.1–1.3) (Lichtenthaler and Babani, 2004). Nonetheless, it should not be ruled out that decreases in Chl (a/b) might reflect some heat susceptibility given that this ratio has been shown to increase in heat-tolerant genotypes of other species (Bita and Gerats, 2013).
Antioxidative Enzymes
The ascorbate-glutathione cycle is a vital mechanism to control cell oxidative stress, and include both enzyme (e.g., Cu,Zn-SOD, APX, GR, among others) and non-enzyme (ASC, GSH) components, which altogether scavenge several ROS (O·−
2 , H2O2,
OH·) (Asada, 1994; Foyer, 2002; Smirnoff, 2005). With the
exception of Cu,Zn-SOD in CL153 and Icatu, 700-plants showed a somewhat downregulation of the antioxidative enzymatic system at control temperature. Such lower constitutive level of antioxidative capability under high [CO2] has been interpreted in other species as compromising the plant’s ability to cope with sudden stress events (Pritchard et al., 2000). However, in coffee plants, this may be associated with higher photosynthetic rates (Rodrigues et al., 2016), which concomitantly with the inhibition of photorespiration under elevated CO2 (DaMatta
et al., 2016), is believed to decrease the excitation pressure in
the PSs and avoid ROS formation, thus ultimately precluding the need of developing a robust antioxidant system. In fact, although elevated CO2 may lead to decreases in SOD, APX, GR, and CAT activities (Pritchard et al., 2000; Erice et al., 2007; Vurro
et al., 2009), even under supra-optimal temperatures (Erice
et al., 2007; AbdElgawad et al., 2015), a concomitant reduction
in the lipoperoxidation status has been often observed. Taken together, this information supports the notion that reduced ROS production under high CO2 conditions in C3 plants is indeed related to a higher photosynthetic functioning and inhibition of photorespiration (Erice et al., 2007; Vurro et al., 2009;
AbdElgawad et al., 2015), as would also be the case in coffee plants
at control temperature.
With rising temperatures thermotolerance can be improved by increasing transcript and protein levels of ROS-scavenging enzymes (Suzuki and Mittler, 2006; Hasanuzzaman et al., 2013), which agrees with the increases in APX, GR, and CAT in CL153-380, GR and CAT in Icatu (both CO2 conditions), and Cu,Zn-SOD and CAT in IPR108 700-plants. In addition, in line with the observed heat tolerance until 37/30◦C the 380-plants from Icatu presented similar (Cu,Zn-SOD and APX) or higher (GR and
CAT) activities than their 700-plants counterparts, compensating for the lower photosynthetic rates. Similarly, the IPR108 380-plants presented higher (Cu,Zn-SOD and CAT) or similar (GR and APX) enzyme activities than their respective 700-plants. Irrespective of genotypes and [CO2], FeSOD gene was not significantly upregulated under supra-optimal temperatures, and therefore O·−
2 removal through extra chloroplast SOD action is not expected to be reinforced.
The additional temperature increase to 42/34◦C led to further changes in enzyme activities with varying genotypic patterns. In CL153 plants only APX activity was reduced (despite the APX Chl upregulation), but the H2O2 control might have been achieved in extra-chloroplast compartments in good agreement with both increases in CAT activity in both [CO2] and upregulation of CAT and APX Cyt genes (especially in the 700-plants) (Table 6). This responsiveness to H2O2 control, together with the stability in Cu,Zn-SOD and GR, could have alleviated heat stress in these plants by maintaining redox homeostasis (Li et al., 2014) and minimizing the heat-induced oxidative impairments to the photosynthetic apparatus (Figure 1; Rodrigues et al., 2016). These responses are in line with the well-known better heat tolerance of C. canephora (DaMatta and Ramalho, 2006). On the other hand, Icatu 380-plants showed reductions in the activity of all enzymes (except Cu,Zn-SOD), likely contributing to the strongest decrease in photosynthetic performance (Rodrigues
et al., 2016) and highest photoinhibition status (Figure 1) relative
to the other genotypes. Furthermore, in Icatu 380-plants the increase in Cu,Zn-SOD, but not in APX and CAT activities, might have limited an integrated H2O2 scavenging (Fortunato
et al., 2010). Compared with Icatu 380-plants, their
700-counterparts (despite showing decreased APX activity) displayed a strong upregulation of GR and CAT activities, as well as APX Cyt (and APX Chl) gene expression at 42/34◦C, which may have contributed to a lower impact on the photosynthetic performance in elevated [CO2]. At the two highest temperatures, the scavenging capability in IPR108 700-plants was not stronger than that of 380-plants (with the exception related to CAT activity), and a lower gene expression for the antioxidant enzymes and other protective proteins (HSP70, ELIP, Chape 20, and 60) was observed. Therefore, a better ROS control could be mostly prompted by the higher rates of electrons driven to C-assimilation, as also reported in grapevine (Vitis vinifera) under high [CO2] and increased temperature (Salazar-Parra et al.,
2012).
Chloroplastic APX was the most affected enzyme at 42/34◦C, contrasting to the large increase in APX Cyt expression, which was the most responsive gene to high temperature (in CL153). Since CAT was the only enzyme to present significant increased activities in the three genotypes in the 700-plants (and also in CL153 380-plants), this suggested a drift of H2O2 control from chloroplast APX to extra-chloroplast CAT (predominantly located in peroxisomes, glyoxissomes, and mitochondria) and possibly cytosolic APX. In fact, since H2O2 is capable of diffusing passively across membranes, extrachloroplastic scavenging systems are important H2O2detoxification pathways