Air-Adapted
Shows High Methane Production and
Develops Resistance against Oxygen Stress
Ricardo Jasso-Chávez1*, M. Geovanni Santiago-Martínez1, Elizabeth Lira-Silva1, Erika Pineda1, Armando Zepeda-Rodríguez2, Javier Belmont-Díaz1, Rusely Encalada1,
Emma Saavedra1, Rafael Moreno-Sánchez1
1Departamento de Bioquímica, Instituto Nacional de Cardiología Ignacio Chávez, Mexico City, Mexico,2
Facultad de Medicina, UNAM, Mexico City, Mexico
Abstract
Methanosarcina acetivorans, considered a strict anaerobic archaeon, was cultured in the presence of 0.4–1% O2(atmospheric) for at least 6 months to generate air-adapted cells; fur-ther, the biochemical mechanisms developed to deal with O2were characterized. Methane production and protein content, as indicators of cell growth, did not change in air-adapted cells respect to cells cultured under anoxia (control cells). In contrast, growth and methane production significantly decreased in control cells exposed for the first time to O2. Production of reactive oxygen species was 50 times lower in air-adapted cellsversuscontrol cells, sug-gesting enhanced anti-oxidant mechanisms that attenuated the O2toxicity. In this regard, (i) the transcripts and activities of superoxide dismutase, catalase and peroxidase significantly increased; and (ii) the thiol-molecules (cysteine + coenzyme M-SH + sulfide) and polypho-sphate contents were respectively 2 and 5 times higher in air-adapted cellsversus anaerobic-control cells. Long-term cultures (18 days) of air-adapted cells exposed to 2% O2exhibited the ability to form biofilms. These data indicate thatM. acetivoransdevelops multiple mecha-nisms to contend with O2and the associated oxidative stress, as also suggested by genome analyses for some methanogens.
Introduction
The reactive oxygen species (ROS) are toxic for most cells because they induce (i) oxidation of polysaccharides and polyunsaturated fatty acids, as well as amino acid residues, particularly of sulf-hydryl groups in proteins; (ii) loss of metals in metalloproteins; and (iii) DNA mutations, among many others [1]. Aerobic microorganisms have developed multiple strategies to handle ROS stress including: (i) enzymes that scavenge ROS such as superoxide dismutase (SOD), catalase (CAT) and peroxidases (PXs); (ii) protein repair mechanisms such as the thioredoxin system; (iii) DNA damage repair enzymes such as RecA; and (iv) anti-oxidant metabolites such as glutathione,α -to-copherol, carotenes, ascorbate, and trypanothione, which are able to directly inactive ROS [1–4].
OPEN ACCESS
Citation:Jasso-Chávez R, Santiago-Martínez MG, Lira-Silva E, Pineda E, Zepeda-Rodríguez A, Belmont-Díaz J, et al. (2015) Air-Adapted
Methanosarcina acetivoransShows High Methane
Production and Develops Resistance against Oxygen Stress. PLoS ONE 10(2): e0117331. doi:10.1371/ journal.pone.0117331
Academic Editor:Stephan Neil Witt, Louisiana State University Health Sciences Center, UNITED STATES
Received:September 16, 2014
Accepted:December 22, 2014
Published:February 23, 2015
Copyright:© 2015 Jasso-Chávez et al. This is an open access article distributed under the terms of the
Creative Commons Attribution License, which permits unrestricted use, distribution, and reproduction in any medium, provided the original author and source are credited.
Data Availability Statement:All relevant data are within the paper and its Supporting Information files.
The organisms belonging to theArchaeadomain generally live under extreme conditions [5]. Indeed, many live under complete anaerobic conditions; therefore, it has been frequently assumed that most anaerobic archaea do not interact with O2and therefore they lack mecha-nisms able to cope with oxidative stress.
Methanogens, the mainArchaeagroup, grow in anoxic environments such as the rumen, sewage digesters, landfills, freshwater sediments of lakes and rivers, rice paddies, hydrothermal vents and coastal marine sediments [6]. Therefore, most of the methanogens are cultivated in the presence of high Na2S (1–3 mM) to yield an anoxic and reducing medium (-300 mV).
Biochemical and genetic (genome and transcriptome) analyses have suggested that metha-nogens have the ability to develop mechanisms to cope with oxidative stress [7]. Methanogens such asMethanosarcina sppandMethanocella spphave been isolated from soil crusts of arid re-gions where aerobic conditions are predominant [8]. In these places, methane production by these methanogens is detected, but methanogenic rates are much lower when O2is present. In-creased transcription of the peroxide-detoxifyingkatgene (catalase) was found in these metha-nogens, but the enzyme activity was not determined [9].
Methanobrevibacter arboriphilicusSA,Methanobacterium fomicicumandMethanosarcina mazeiTMA isolated from paddy soils are able to deal with periods of aeration and water stress for up to 30 days [10]. Analyses of the genomes of these methanogens show the presence of genes encoding antioxidant enzymes, which may be the main reason of the different abilities to resist aerobic conditions, rather than differences in the habitats that may act as shelters for methanogens during the long-term stress period.
InMethanobrevibacter cuticularisandMethanobrevibacter curvatusisolated from microaero-filic regions of the hindgut of termites, CAT and SOD activities are detected [11]; however, these organisms immediately cease growth and methane production when the cultures are initiated in the presence of 0.16–1.6% O2in the head space [12]. InMethanosarcina barkeri, pulses of H2O2, but not of O2, induce the activity of both CAT and Fe-dependent SOD [13–15].Methanosarcina mazeicontains a methanoferrodoxin with superoxide reductase activity which contributes to the protection of cells from ROS formed by flavoproteins during periodic exposure to oxygen in nat-ural environments [16]. The marine archaeonMethanosarcina acetivoransWWM73 strain can tolerate high H2O2concentrations without a complete loss of viability [17]. Also, a functional thioredoxin reductase system has been reported for this methanogen [18].
Methanosarcina sppandMethanosaeta sppare the only methanogens able to consume ace-tate for methane production [19], which may account for 75% of the biological methane on earth. Despite this crucial role in the carbon cycle, knowledge regarding the mechanisms pres-ent inMethanosarcina sppto contend against oxidative stress is still incomplete. To assess the mechanisms of resistance against oxidative stress in methanogens,M.acetivoranswas adapted to grow in the presence of permanent low O2(0.4–1% O2 atmospheric). These air adapted cells showed increased transcripts ofsod,katand NADH-dependent peroxidase genes and activities of SOD, CAT and NAD(P)H-, cytochromec- and CoM-SH-dependent peroxidases (PXs). An increase in the contents of thiol molecules and polyP was also observed. Moreover, long expo-sures (up to 18 days) to higher O2concentrations led to formation of biofilms constituted by DNA, CHOs and proteins. The physiological relevance of these mechanisms in methanogens to cope with O2in a marine environment is discussed.
Results
2.1 Analyses of methanogenic genomes
A survey of genes coding for enzymes putatively involved in oxidative stress in genomes from 27 different genera belonging to the 5 orders of methanogens, available in the KEGG data base, Competing Interests:The authors have declared
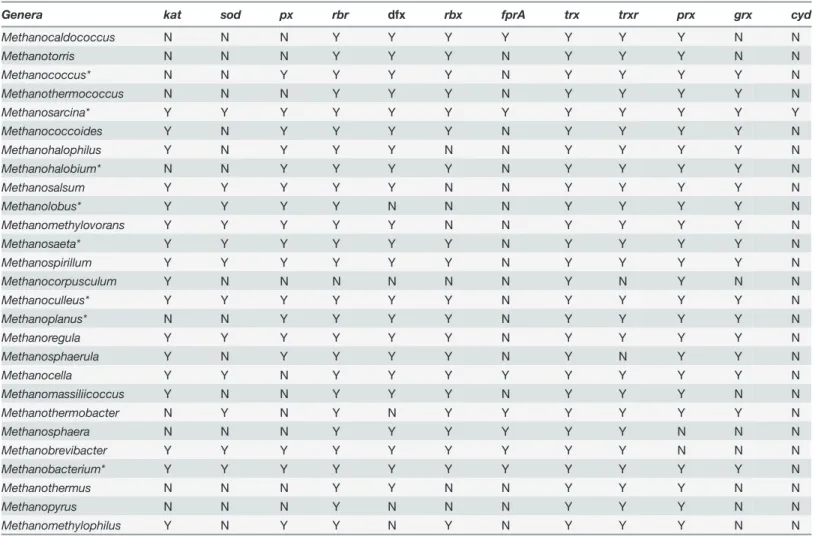
showed thatM.acetivoransis among the methanogens with the largest number of genes coding for anti-oxidant proteins (Table 1). SODs, catalases and PXs play an essential role in defending the cell against oxidative stress and are distributed in almost all aerobic and facultative anaero-bic organisms. In this regard, it has been proposed that the presence or absence of one or both of the SOD and CAT activities determines whether an anaerobe is aerotolerant [20]. The re-sults shown below indicated that inM.acetivoransone of the mechanisms underlying the anti-oxidant response was the expression of antianti-oxidant enzymes that are not present in
all methanogens.
2.2 Effect of oxygen on growth and methane production
To determine the mechanisms of defense against oxidative stress inM.acetivoransas well as the effect of long-term exposure to O2, air-adapted cells were generated by periodic injections of air into the anoxic cell cultures for at least 6 months. To assess whether the resistance
Table 1. Genes annotated coding for proteins involved in oxidative stress protection in methanogens.
Genera kat sod px rbr dfx rbx fprA trx trxr prx grx cyd
Methanocaldococcus N N N Y Y Y Y Y Y Y N N
Methanotorris N N N Y Y Y N Y Y Y N N
Methanococcus* N N Y Y Y Y N Y Y Y Y N
Methanothermococcus N N N Y Y Y N Y Y Y Y N
Methanosarcina* Y Y Y Y Y Y Y Y Y Y Y Y
Methanococcoides Y N Y Y Y Y N Y Y Y Y N
Methanohalophilus Y N Y Y Y N N Y Y Y Y N
Methanohalobium* N N Y Y Y Y N Y Y Y Y N
Methanosalsum Y Y Y Y Y N N Y Y Y Y N
Methanolobus* Y Y Y Y N N N Y Y Y Y N
Methanomethylovorans Y Y Y Y Y N N Y Y Y Y N
Methanosaeta* Y Y Y Y Y Y N Y Y Y Y N
Methanospirillum Y Y Y Y Y Y N Y Y Y Y N
Methanocorpusculum Y N N N N N N Y N Y N N
Methanoculleus* Y Y Y Y Y Y N Y Y Y Y N
Methanoplanus* N N Y Y Y Y N Y Y Y Y N
Methanoregula Y Y Y Y Y Y N Y Y Y Y N
Methanosphaerula Y N Y Y Y Y N Y N Y Y N
Methanocella Y Y N Y Y Y Y Y Y Y Y N
Methanomassiliicoccus Y N N Y Y Y N Y Y Y N N
Methanothermobacter N Y N Y N Y Y Y Y Y Y N
Methanosphaera N N N Y Y Y Y Y Y N N N
Methanobrevibacter Y Y Y Y Y Y Y Y Y N N N
Methanobacterium* Y Y Y Y Y Y Y Y Y Y Y N
Methanothermus N N N Y Y N N Y Y Y N N
Methanopyrus N N N Y N N N Y Y Y N N
Methanomethylophilus Y N Y Y N Y N Y Y Y N N
Genes present (Y) or absent (N) in the different genera of methanogens.kat: catalase;sod: superoxide dismutase;px: peroxidase;rbr: rubrerythrin;dfx: desulfoferrodoxine (superoxide reductase activity; SOR);rbx: rubredoxin;fprA: type Aflavoprotein (F420H2oxidase activity);trx: thiorredoxin;trxr:
thioredoxin reductase;grx: glutaredoxin;prx: peroxiredoxin;cyd: cytochromedoxidase. Asterisk denotes genera with marine species.
mechanisms against oxidative stress vary with the carbon source [7]; in the present work cells were also cultured with acetate or methanol for comparison.
M.acetivoranswas able to contend with air exposure as judged by the similar methane syn-thesis rate in air-adapted cellsversuscontrol anaerobic cells. In contrast, anaerobic control cells subjected for the first time to air injections showed 40% less methane production in both, methanol and acetate cultures (Fig. 1A and 1B), and decreased protein contents: 4.1 ± 0.1 and 3.4 ± 0.3 mg/culture for methanol- and acetate-cell cultures, respectively, which meant a de-crease of 35–40% respect to control cultures non-exposed to O2(Table 2).
Most of the injected O2was detected in the head space of the culture bottles (91 and 72% of total O2for methanol- and acetate-cultures, respectively) at the beginning of the culture. Con-trol anaerobic cultures showed negligible contamination by atmospheric O2at the moment of the cell inoculum injection: 0.3–0.6μmol O2in 50 ml head space in methanol and acetate cell
Fig 1. Methane synthesis and oxygen consumption inM.acetivorans.Cells were cultured in methanol (A, C) or acetate (B, D) and the contents of methane (A, B) and O2(C, D) in the head space at the indicated times were determined. Control anaerobic cells (■), control anaerobic cellsplusair pulses (●)
and air-adapted cells (▲). The O2concentration in the head space of culture bottles without cells was also determined (□). The increase in the content of O2
was due to each new air injection which was indicated by arrows. Values are the mean±SD of at least 4 different independent cell batches.aP<0.05;
bP<0.01vsair-adapted cells.
cultures (Fig. 1C and 1D). After the three air injections, the concentration of dissolved O2in the medium at the end of the growth curve was 3.4 ± 0.5 and 5.3 ± 0.5μM (mean ± SD, n = 3)
for methanol- and acetate- air-adapted cell cultures, respectively. Control anaerobic cultures showed negligible levels of dissolved O2(<1.5μM O2).
Anaerobic control and air-adapted cells showed ability to consume the added O2(Fig. 1C and 1D). The rates of O2consumption determined in methanol grown cells after the third air pulse were 14.9 ± 2 and 24 ± 3μmol O2day-1(days 4 to 5) for anaerobic control and
air-adapted cells, respectively; this is 63% faster for air-air-adapted cells (mean ± SD, n = 4). In turn, the rates of O2consumption in acetate grown cells (days 10 to 12) were 1.07 ± 0.11 and 1.63 ± 0.3μmol O2day-1, for anaerobic control and air-adapted cells, respectively (n = 4); this
means 52% faster for the latter cells. The protein content at the end of the growth curve for anaerobic control and air-adapted cells was essentially identical in both, methanol and acetate cultures (Table 2).
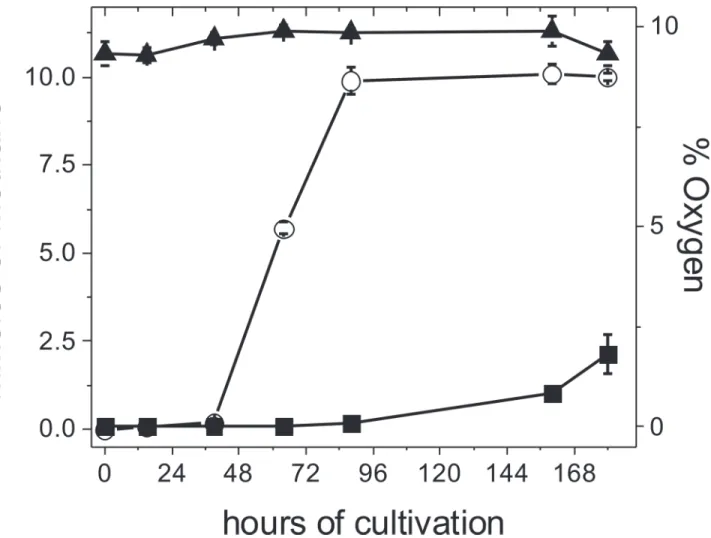
The consumption of O2by the non-enzymatic reaction with the sulfide and cysteine present in the culture medium did not significantly attenuate the O2level reached in the head space even after the first air injection (Fig. 1C and 1D). In order to expose the cells to a higher and constant O2level, culture bottles of control and air-adapted cells were also placed into an 8 liter home-made anaerobic jar containing 9% O2(v/v), 73% N2and 18% CO2. Due to the relatively high volume of the anaerobic jar and the high O2concentration applied (29 mmol O2), no sig-nificant changes in the O2concentration were determined throughout the cell growth time-frame (Fig. 2). Under these more severe oxidant conditions, air-adapted cells were able to generate methane at faster rates than control cells (Fig. 2). In fact, air adapted-cells consumed all the methanol added, with the concomitant production in 7.5 days of 10 ± 0.2 mmoles of meth-ane/culture and 6.7 ± 0.8 mg protein /culture, whereas control cells produced only 2 mmoles of methane/culture and 2 ± 0.5 mg protein /culture (n = 4).
2.3 Effect of O
2on the contents of thiol-molecules and polyphosphates
(PolyP)
The Cys and CoM-SH contents in air-adapted cells were similar to those in control cells; whereas their sulfide content increased significantly by 2.5–3.4 times (Table 2). Air-adapted cells grown on methanol or acetate showed a significant 2.2 or 5.3 fold increase in polyP Table 2. Cellular responses to O2in stationary growth phase in anaerobic control and air-adapted cells.
Methanol anaerobic-control cells
Methanol air-adapted cells
Acetate anaerobic-control cells
Acetate air-adapted cells
Protein content (mg/ 50 mL culture) 6.9±0.6 (5) 6.9±0.4 (5) 5.2±0.7 (5) 5±1.3 (5) Methane production (mmol / 50 mL
culture)
2.5±0.4 (5) 2.6±0.3 (5) 5±0.2 (5) 5±0.1 (5)
Cysteine (nmol/mg total protein) 50±10 (4) 80±20 (4) 2.7±0.6 (4) 2 (2)
Co-MSH (nmol/mg total protein) 5±3 (4) 10±2 (4) 15±5 (4) 13±3 (4)
Sulfide (nmol/mg total protein) 17±10 (4) 42±8*(4) 14±3 (4) 48±8*(4) Inorganic phosphate (μmol/mg total
protein)
0.88±0.12 (6) 0.5±0.11 (6) 1.3±0.3 (6) 1.27±0.28 (4)
PolyP (μmol/mg total protein) 0.75±0.24 (6) 1.7±0.4**(6) 1.62±0.25 (4) 8.6±2**(4)
Values of PolyP in nmol (mg protein)-1for methanol cultures were: 62±20 and 138±35 for control and air adapted cells, respectively; for acetate
cultures: 345±53 and 2,190±528 for control and air adapted cells, respectively.*P<0.05vsanaerobic control cells.**P<0.01vsanaerobic control cells. Values shown are the mean±SD; number of independent experiments is shown in parenthesis.
content respect to anaerobic control cells. In addition, the Pi and polyP contents in acetate air-adapted cells were 2.5 and 5 times higher, respectively, than in methanol air-air-adapted cells (Table 2). The content of PolyP determined in methanol-grown cells was similar to that re-ported for different bacteria [21]. Increased polyP content was also visualized by the number of acidocalcisomes in air adapted cells in comparison with control anaerobic cells (S1 Fig.).
2.4 Oxidative stress damage and ROS production rates
Anaerobic control cells grown in the absence of O2and further exposed to 2% (v/v) O2for 2 h ex-hibited greater lipoperoxidation than air-adapted cells (S2A Fig.). Moreover, O2exposure signifi-cantly increased ROS production with rates of 100 ± 46 and 2.1 ± 1.5 pmol (min x mg protein)-1 in control cells and air-adapted cells (n = 3), respectively (S2B Fig.). Further, the negligible ROS production in the absence of carbon source (methanol) suggested that cells have to be metaboli-cally active to be able to produce ROS (S2B Fig.).
Fig 2. Effect of high O2concentrations on methane production inM.acetivorans.Cells were cultured in 100 mL bottles with a syringe inserted in the
rubber stopper to allow for gas exchange; the bottles were then incubated At 37°C in an 8 L anaerobic jar under steady 9% O2(▲), as described in methods.
The methane produced by anaerobic control (■) and air-adapted () cells throughout the growth curve was determined. Values are the mean±SD of 4 bottles
contained into the anaerobic jar.
2.5 Antioxidant enzymes transcripts and activities
The analyses of the methanogen genomes sequenced so far showed that there are at least 10 dif-ferent proteins with isoforms putatively involved in resistance mechanisms against oxygen (Table 1). Here, the canonical enzymes found in all three domains of life SOD, CAT and PXs were characterized. In order to determine whether transcripts of the genes annotated as SOD (MA1574), CAT (MA0972) and PX (MA1426) inM.acetivoransincrease due to O2exposure, 14 days-old acetate grown anaerobic control and air-adapted cells were exposed to 2% O2for 2 h at 37°C, whereas a third set of strict anaerobic cells was maintained without O2for compar-ison. Higher transcript levels for these enzymes were detected in cells exposed for the first time to 2% O2for 2 h than in anaerobic control cells (2 ± 0.7, 8 ± 1 and 3.4 ± 0.4 times for SOD, CAT and PX, respectively). In air-adapted cells exposed to O2, higher transcript levelsversus
control cells were also determined (2.4 ± 0.5; 5.2 ± 1.5 and 5 ± 0.4 times for SOD, CAT and PX, respectively) (Fig. 3).
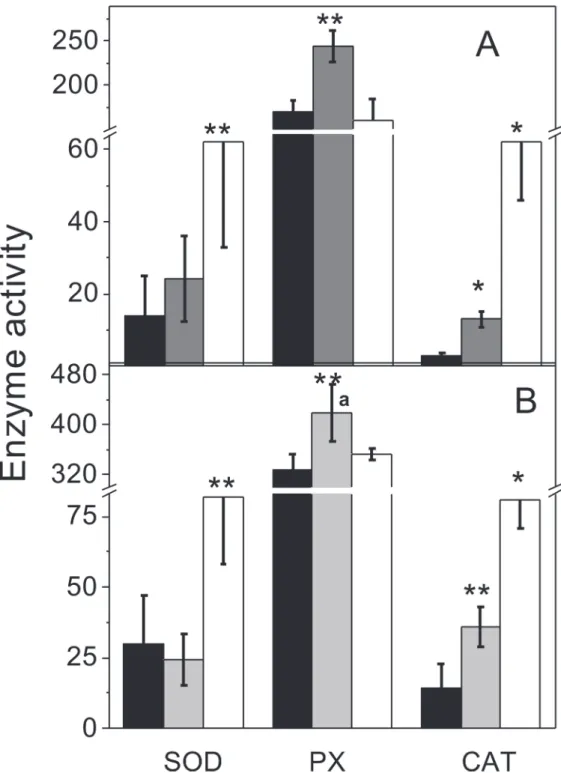
Activities of SOD, CAT and PX were found in anaerobic-control cells, suggesting that there is a constitutively low level of activity for these enzymes, which might prevent any sudden oxi-dative damage when cells undergo episodes of O2exposure or when their own cell metabolism produces ROS. However, in methanol and acetate cultures, air-adapted cells showed significant increases in SOD and CAT activitiesversusanaerobic control cells, whereas high PX activity (determined with ascorbate as electron donor) remained unchanged (Fig. 4). The acetate grown air-adapted cells showed significantly (2-times) higher PX activity than methanol-grown air-adapted cells (Fig. 4). SOD and CAT activity values were similar to those reported forM.cuticularisandM.arboriphilus[12].
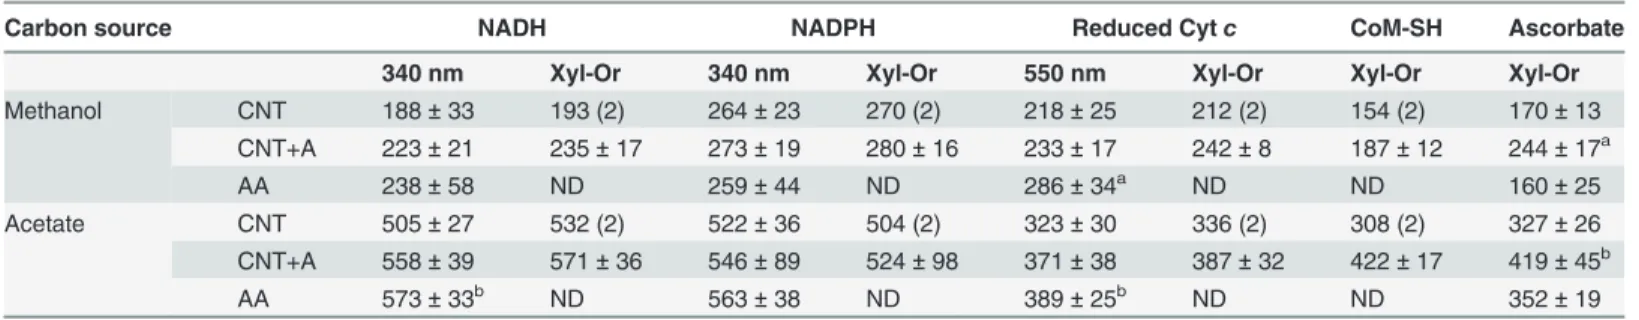
Four genes annotated for PXs were found in the genome ofM.acetivorans(MA1426, MA0993, MA2908 and MA0972) putatively specific for electron donors such as NAD(P)H, cy-tochromec(cytc) and catalase-type PX. After 2 h of incubation with 2% O2, increased PX ac-tivity with ascorbate as electron donor was apparent in control cells (Fig. 4;Table 3). With NADH and cytc, significant increased PX activity was determined only for air adapted cells; CoM-SH a key metabolite in the methanogenic pathway served also as an electron donor for PX activity (Table 3).
Enzyme activities were also detected by protein gel electrophoresis. Regardless background and different electrophoretic performance for proteins proceeding from acetate and methanol grown cells, evident bands of activity were identified for SOD, CAT and PX (data not shown). In an attempt to determine the nature of the metal-cofactor dependence for SOD activity, Zn2+, Cu2+, Mn2+and Fe2+were tested; however, unmanageable background in the colorimet-ric essay surged with all metals tested, except for Zn2+, which activated 100% the SOD activity at 200μM. Hence, the effect of 200μM of each metal on SOD activity was determined by
mea-suring the activityin gel, in which turbidity does not interfere. Thus, Zn2+, Cu2+, Fe2+and Mn2+ showed a potent activating effect on SOD, whereas Cd2+used as negative control, was innocuous (data not shown).
2.6 Structural analysis of air-adapted cells
Fig 3. Transcript levels of anti-oxidant genes inM.acetivorans.Anaerobic control cells grown on acetate and harvested in the stationary phase were incubated at 37°C under orbital shaking in the absence (lane 1) or presence (lane 2) of 2% O2for 2 h. Air-adapted cells grown and harvested in the same
conditions were also exposed to O2(lane 3). mRNA isolation and RT-PCR analysis was carried out by the primer dropping method as indicated in the
Methods section and the PCR products separated by gel electrophoresis (A). Densitometric analysis (B) was carried out by double normalizationversusthe internal control MA3998 transcript and the target genes from anaerobic control cultures without O2exposure (lane 1). Values are the mean of 4 independent
experiments±SD.
Fig 4. Antioxidant enzyme activities.Cytosolic-enriched fractions from anaerobic control (black bars), anaerobicplus2% O2for 2h (grey bars) and air-adapted cells (white bars) grown on methanol (A) or acetate (B)
were used to determine activities of SOD, APX and CAT as described under Methods. Rate units for APX are mU (nmol of substrate consumed (min x mg protein)-1), whereas CAT and SOD activity units are U (mg protein)-1
as described under Methods. Values shown are the mean±SD of at least 4 independent preparations.
*P<0.01;**P<0.05vsanaerobic control cells.aP<0.01vsmethanol-grown cells.
bottles developed after>18 days of 2% O2exposure (S3A Fig.), constituted by an extracellular
matrix to which cells appeared to be adsorbed (Fig. 5B).
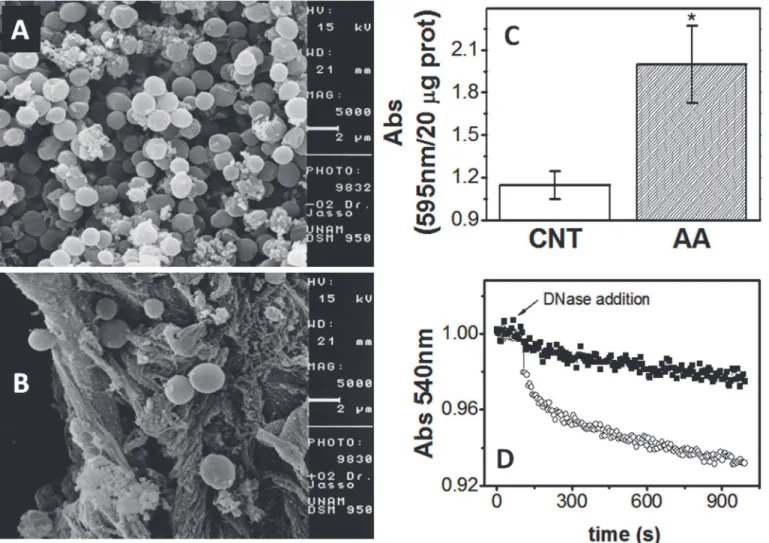
To further show that the cell agglomerate in air adapted cells was indeed a biofilm and not a mere aggregation as it happens inM.acetivoranscultured in low salt medium [24], the crystal violet staining method to determine biofilm formation was used. Indeed, the ability of air adapted cells to form biofilm was significantly higher than that of control anaerobic cells (Fig. 5C). In addition, the chemical composition of the cell aggregates: protein, carbohydrates and extracellular DNA, essential components of biofilms [23], was also evaluated. The content of protein after 18–20 days did not change between control and air adapted cells (20–25 mg protein culture−1). However, non-soluble carbohydrates (CHOs) were significantly different between control and air-adapted cells: 10 ± 1μg CHOs (mg protein)−1(n = 3) and 16 ± 3
μg
CHOs (mg protein)-1(n= 4;P<0.05), respectively,i.e. there was a 60% higher CHO content
in air adapted cells. Moreover, as judged by the decrease in the absorbance (biofilm disaggre-gation) induced by adding DNAse I, the extracellular DNA was also significantly higher in air adapted cells than in control cells (Fig. 5D). DNAse I test was also applied to control and air adapted cells cultured in low salt. Again, only air adapted cells showed the development of a biofilm (S4 Fig.).
Discussion
3.1 Analysis of genes related to protection against oxidative stress in
methanogenic genomes
The genomes analyzed here, indicated thatrubrerythrin(a non-haem iron protein) is wide-spread among methanogens, and together with rubredoxin and the SOR activity, is necessary for a complete ROS detoxification system [16,25] (Table 1). F420H2oxidase catalyzes the re-duction of O2to water and may play an important role against oxidative stress in methanogens [26]. Genes encoding thioredoxins (Trx), well known proteins involved in oxidative stress han-dling, were present in all 27 genera analyzed.Methanosarcina spppossesses up to 8 different genes encoding Trx suggesting multiple metabolic roles for this protein [18]. On the other hand,M.acetivoransandM.barkeriare the only methanogens with genes annotated for qui-nol:cyt bdoxidase, which suggests that this enzyme may not have an important role against ox-idative stress (Table 1).
Table 3. Different electron donors forM.acetivoransperoxidase activities.
Carbon source NADH NADPH Reduced Cytc CoM-SH Ascorbate
340 nm Xyl-Or 340 nm Xyl-Or 550 nm Xyl-Or Xyl-Or Xyl-Or
Methanol CNT 188±33 193 (2) 264±23 270 (2) 218±25 212 (2) 154 (2) 170±13
CNT+A 223±21 235±17 273±19 280±16 233±17 242±8 187±12 244±17a
AA 238±58 ND 259±44 ND 286±34a ND ND 160±25
Acetate CNT 505±27 532 (2) 522±36 504 (2) 323±30 336 (2) 308 (2) 327±26
CNT+A 558±39 571±36 546±89 524±98 371±38 387±32 422±17 419±45b
AA 573±33b ND 563±38 ND 389±25b ND ND 352±19
CNT: control anaerobic cells; CNT+A: control anaerobic cells incubated with 2% O2for 2h; AA: air adapted cells. Values are the mean±SD of 3
independent experiments.a, bP<0.05 vs control anaerobic cells grown on methanol and acetate, respectively. ND, Not Determined; 340 nm indicates the
activity determined by measuring consumption of NADH or NADPH; 550 nm indicates the activity determined by measuring the oxidation of cyt c; Xyl-Or indicates the activity determined by measuring the xylenol-orange complex formed by the remnant peroxide with xylenol.
Except for the NADH-peroxidase gene (which was only found inM.acetivoransamong methanogens), genes for oxidative stress management found in bacteria (E.coli) showed high identity with those identified inM.acetivorans: cytcperoxidase (30%), Cu-Zn SOD (34%), Fe-Mn SOD (40%) and catalase/peroxidase (60%). Archaea such asArchaeoglobus spand Metha-nobacterium spshowed 61 and 80% identity (respect toM.acetivoransgene) for catalase/per-oxidase, respectively. Fe-Mn SOD showed high identity (57–82%) among archaeal genomes. In contrast,Pyrococcus sppdoes not contain any of these enzymes coded in their genome.
3.2 Role of thiol-molecules and polyP as anti-oxidant metabolites
In air-adapted cells, the content of thiol-molecules increased 2 timesversusanaerobic control cells (Table 2). If an intracellular volume of 0.7μL (mg protein)-1is assumed forM.acetivorans
[27,28], high concentrations of 70–114 mM and 7–14 mM may be reach up for Cys and CoM-SH, respectively. Hence, it is possible that this high Cys level directly reacts with O2and ROS, Fig 5. Formation of a biofilm extracellular matrix induced by O2stress inM.acetivorans.Samples were prepared for and analyzed by scanning electron
microscope as described in the Methods section. Extracellular matrix was absent in cells grown in the absence of oxygen (A) but well-defined in air-adapted cells (B). The carbon source was methanol, which was initially 100 mM and further replenished every 3 days. Micrographs are shown at 5000X, bar = 2μm. (C) Biofilm formation determined by crystal violet staining in control-grown cells and air adapted cells cultured in methanol.*P<0.01versuscontrol cells. (D)
Extracellular DNA determination; 1 mg protein of control (filled squares) and air adapted cells (open circles) was added to a quartz cuvette with 1.8 mL of TME buffer. After 60 seconds of baseline acquisition, DNAse I was added and the light pass was determined at 540 nm.
and may induce the expression of antioxidant genes in response to oxidative stress such as Trx [29] or Rbr, Rbx, Prx and glutaredoxin-like proteins (Table 1). In turn, CoM-SH was an elec-tron donor for PX activity (Table 3). We previously reported that the contents of Cys, CoM-SH and sulfide also increase (>7 times) inM.acetivoransexposed to Cd2+respect to control cells
without Cd2+[22]. Therefore, an essential role for these two metabolites (Cys and CoM-SH) in the anti-oxidant machinery of this archaeon is proposed.
Increased synthesis of polyP is another mechanism in air-tolerant organisms involved in coping with different types of stresses such as heavy metals [30] and oxidative stress [31]. In the present work, it was described that air exposure triggered increased synthesis of polyP (Table 2;S1 Fig.), although acetate-grown cells accumulated more polyP than methanol-grown cells. Clearly, more work is needed to determine whether (i) there is an O2threshold that trig-gers the polyP synthesis inM.acetivoransand whether (ii) Pi and polyP directly may react with ROS.
In bacteria, involvement of polyP in the resistance to oxidative stress has been shown. PolyP is essential for biofilm development, quorum sensing and virulence in bacteria [32,33]. It has been suggested that polyP or polyP kinase regulate the transcription of genes involved in the stress oxidative response such as CAT and SOD inE.coli[34,35]. SinceM.acetivoransis a ma-rine methanogen where acetate and phosphorus are present at low levels, it might be an evolu-tionary advantage for its survival to possess highly efficient mechanisms for uptake and storage of Pi.
3.3 ROS production and the effect of O
2on antioxidant enzyme
transcripts and activities
M.acetivoranswas able to consume O2, being higher in methanol than in acetate grown cells (Fig. 1), because higher O2levels were used in methanol grown cells. Enzyme activities directly involved in O2consumption were not determined in the present study, butM.acetivorans con-tains F420H2oxidase and several ferredoxins, flavodoxins and iron-sulfur proteins which may react with oxygen [36]. ROS production was significantly higher in methanol (versusacetate) grown cells and anaerobic control cells (versusair-adapted cells;S2 Fig.) after the short-term (2 h) exposure to 2% O2. Lower SOD and CAT activities may be the reason for the higher ROS levels in these cells.
Basal activities of SOD and CAT as well as increased activities induced by oxidant stressors have been also found inMethanosarcina barkeri[13] and other methanogens [12,37].M. aceti-voranshas been identified as an archaeon with resistance to O2[38] and hydrogen peroxide in short-term exposures [17], whereas other methanogens are extremely sensitive to O2[10]. The absence of genes encoding antioxidant enzymes in the latter group may be the reason for their extreme sensitivity. Air-adapted cells showed significantly increased CAT and SOD activities.
In gelenzyme activities indicated that Zn2+and Fe2+increase SOD activity, as reported for the
M.arboriphilusenzyme [37]. There are genes annotated for Zn/Cu–dependent SOD (MA2422) and Fe/Mn-dependent SOD (MA1574) in the genome ofM.acetivorans. On the other hand, the increase in the SOD transcript induced by O2in air-adapted cells (2.4 times) correlated with the increased SOD activity (3.8 times), which may be further stimulated by heavy metal divalent cations.
in the detoxification of polychlorinated biphenyls pollutants rather than in oxidative stress [39], this activity was not determined. Instead, CoM-SH was tested as PX substrate because of its high physiological levels and to be a potential electron donor like glutathione. PX activities were found for NADH, NADPH, cytcand CoMSH. Transcription of the NADH Px gene in-creased 5 times in air-adapted cells grown on acetate. However, all PX activities were high in both control and air adapted cells, suggesting that these enzyme activities may be constitutive and hence required for protecting the cell against basal levels of oxidative stress. CAT and SOD were in turn over-expressed in air adapted cells, indicating that these enzymes are involved in contending against acute oxidative stress generated by external stressors such as O2, as pro-posed by Pedone et al [20].
The presence of these antioxidant enzymes inM.acetivoranssuggests that episodes of oxidative stress in the marine environment in which this archaeon grows may be recurrent. Indeed, changes in the O2concentration occur during disturbances of the deep sea by earth-quakes and other meteorological events [40].
3.4 Biofilm formation induced by O
2stress
Composition analysis of the cell agglomerates, in control and air adapted cultures grown on high or low salt, demonstrated that in all conditions non-soluble carbohydrates were present, with 10-fold higher levels in the low salt cultures, in which secretion of methanocondrioitin and S-layer is involved [24]. However, air adapted cells exhibited higher content of non-soluble CHOs and extracellular DNA, an essential component of biofilms (Fig. 5D). Our results showed that long exposure ofM.acetivoranscultures to O2(at least 18 days) led to the forma-tion of biofilms, apparently as a strategy to gain resistance against higher O2concentrations. The significant increase in the content of non-soluble carbohydrates in air adapted cells was, however, only 50% higher than that of control cells. By comparison,M.acetivoranscells ex-posed to 1.4 mM CdCl2exhibit 800% increased content of non-soluble carbohydrates respect to control cells [22], suggesting that inM.acetivoransO2is a weak biofilm-inducer.
In this regard, it has been documented that cells within biofilms show increased tolerance to stressful environmental conditions. For instance, the biofilm made by the archaeonA.fulgidus
in metal-depleted medium is induced by non-physiological drastic changes of pH and tempera-ture, high concentrations of metals or by addition of xenobiotics or O2. Essential metals seques-tered within the biofilm stimulate the growth, suggesting that cells may produce biofilm as a mechanism for concentrating cells and attaching to surfaces, as a protective barrier and as a nu-trient reservoir [41]. Due to the fact that similar biofilms are formed by other archaea, biofilm formation might be a common stress response mechanism within theArchaeadomain [23].
Viable methanogens have been detected in dry, aerobic environments such as dry reservoir sediment, dry rice paddies and aerobic desert soils, suggesting that methanogens have mecha-nisms for long-term survival under various environmental stresses [42–44]. InMethanosarcina barkeri, desiccation and the synthesis of extracellular polysaccharide are indeed survival mech-anisms against oxygen, probable because minimize oxygen diffusion into the cell [45]. Then, it is clear that to elucidate (i) the specific mechanisms that archaeal cells have developed to cope with O2; and (ii) the specific interactions between biofilm and cells, further studies
are required.
might become molecular targets for enhancing biogas production under oxidative stress conditions.
Methods
4.1 Growth conditions
Fifty mL of high salt medium (HS-medium) [24] with 1.6 mM Cys and 1 mM sulfide was sup-plemented with 100 mM acetate or 70 mM methanol as carbon sources and poured in 100 mL serum-like bottles, sealed with a butyl rubber stopper and secured with an aluminum crimp collar. The media were autoclaved at 121°C for 30 min and let them cool down. Fresh cells of
Methanosarcina acetivoransC2A strain (DSM 2834), previously isolated from marine sedi-ments in the summer branch of Scripps Canyon near La Jolla, CA [46] and kindly provided by Prof. James G. Ferry (Pennsylvania State University, USA), were inoculated in the HS-medium under anoxic conditions (<0.3μmol O2) in an anaerobic chamber (COY Lab products,
Michi-gan, USA) and further incubated for the indicated times at 37°C without shaking. Growth was determined by measuring methane production and protein content.
4.2 Generation of air-adapted cells
To assess whether exposure to O2triggers an effective cellular response against oxidative stress inM.acetivorans, two pulses of 2 ml of sterile air (0.4% O2or 16μmol total O2) at days 6 and
10 for acetate-cultures; or two pulses of 5 mL of sterile air (1% O2or 41μmol total O2) at days
2 and 4 for methanol-cultures were applied. The redox probe resazurin present in the culture media was slightly oxidized as revealed by turning and remaining pink for about 30 min after each air injection, indicating that the O2added sufficed to create a microaerophilic environ-ment (seeFig. 1C and 1D). No removal of air from the culture bottles was carried out after each addition; the presence of O2was permanent throughout the growth curve (seeResults sec-tion 2.2). Aliquots of these microaerophilic cell cultures were transferred to fresh media every 6 and 14 days for methanol and acetate grown cells, respectively, to initiate a new cell culture fol-lowing the same protocol of O2exposures. After 3 months using this regime, a third addition of air was always made at the beginning of each new cell culture. Thereafter, as judged by the constant growth and methane production, a stable air-adapted cell culture was obtained. Higher volumes of air (5 ml air for acetate and 10 mL for methanol cultures) were also tested but no reproducible results were achieved and cell cultures sometimes did not grow (data not shown).
4.3 Metabolite contents
Cells in the stationary growth phase (6 days for methanol and 14 days for acetate cultures) were harvested by centrifugation under anaerobic conditions. The cell pellet was gently re-sus-pended and washed once with 50 volumes of a solution containing 50 mM Tris, 20 mM MgCl2 and 2 mM EGTA at pH 7.2 (TME buffer). The washed pellet was resuspended in 1 mL of TME buffer.
Intracellular contents of Cys and CoM-SH were determined by HPLC and post-column de-rivatizing with DTNB (5, 5'-dithiobis-(2-nitrobenzoic acid), whereas sulfide was determined by the methylene blue colorimetric method as reported elsewhere [22].
For determination of intracellular inorganic phosphate (Pi), washed cells were ruptured by applying 2 sonication pulses of 1 min at maximal output in a sonifier (Branson; CT, USA) and aliquots of the cell homogenate were taken for Pi determination. Intracellular polyP was deter-mined in the cell homogenates after adding 3% ice-cold perchloric acid (PCA), strongly vor-texed for 1 min, further incubated for 0, 60, 120 and 240 min at 90°C and centrifuged; the released Pi was determined in the supernatant aliquots. Based on the hydrolysis of the cyclic hexametaphosphate (NaPO3)6, which is usually a mixture of polymeric metaphosphates (Sigma, UK), the yield was not higher than 40% of the theoretical polyP added after 60 min of incubation. Longer incubation times did not increase the standard hydrolysis (data not shown). Instead, the Pi released in the cell extracts increased with the time and after 120 min of incubation was roughly the same than after 240 min. Pyrophosphate was also hydrolyzed by 15–20% under the same PCA/high temperature treatment (data not shown). Pi was quantified according to the methodology reported by [47] using 4-(methylamino) phenol hemisulfate
plussodium bisulfite as reducing agent. To estimate the polyP content, the Pi content deter-mined in the sonicated cells (in which polyP is preserved) was subtracted from the Pi content determined in the PCA-treated cell homogenates (in which polyP is hydrolyzed to Pi).
4.4 O
2, ROS and TBARS
Changes in the concentration of O2in the head space were monitored by GC using the capil-lary column HP-MOLESIEVE of 30 m length, 0.32 mm I. D. and 25μm film (Agilent, USA),
and a thermal conductivity detector, and calculated by using a standard curve of oxygen. On the other hand, O2dissolved in the culture medium was determined polarographycally at 35°C by using an oxymeter (YSI; OH, USA) equipped with a Clark-type electrode and placed inside the anaerobic chamber. A baseline was recorded with hypoxic TME buffer, which had been previously bubbled with a gas mixture (80% N2, 15% CO2and 5% H2) inside the anaerobic chamber for 2 h. Thereafter, an aliquot of cell-free culture medium collected at the end of the cell growth curve was added and the O2present was recorded. The signal of the O2 concentra-tion was calibrated by using dithionite in air-saturated TME buffer.
The relative rate of ROS production in control and air-adapted cells was determined spectrophotometrically by measuring the oxidation of dichlorofluorescein diacetate (DCFDA). Briefly, inside the anaerobic chamber, ~1 mg of cell protein, 50 mM methanol as cell substrate and 250μM DCFDA were mixed in TME buffer and poured into a 4 mL cuvette and sealed
with a rubber stopper. After a baseline was attained, 4 mL of air (20% O2) were injected and DCFDA oxidation was monitored at 500 nm. The rate of ROS production was calculated using the molar extinction coefficient of DCF of 59.5 mM-1cm-1.
For determination of the malondialdehyde (MDA) content, as indicator of lipid peroxidation levels, cultures of control anaerobic and air-adapted cells were harvested in the stationary phase, exposed to sterile air (2% O2) and incubated for 2 h at 37°C under orbital shaking (150 rpm). Thereafter, the cells were collected by centrifugation and washed with TME buffer under anoxic conditions. MDA was determined by reacting with thiobarbituric acid (TBARS) using 3–5 mg cell protein [48]. A standard curve was made with tetraethoxypropane; the reaction was linear up to 3 nmol TBARS.
4.5 Semi-quantitative RT-PCR analysis
Total RNA was extracted by using the RNeasy Protect Cell Mini Kit (Qiagen; Valencia, CA, USA) according to the manufacturer instructions. After verifying the RNA integrity by gel elec-trophoresis, 5μg RNA was converted into cDNA with the Super Script First-Strand Synthesis
determined by semiquantitative reverse-transcriptase PCR reaction following the“primer dropping method”[49]. The PCR reactions (20μL) contained 1X Pfu DNA polymerase buffer
(Fermentas; Ontario, Canada), 2 mM MgCl2, 0.5 mM deoxyribonucleotide phosphates mix (Fermentas), 7 pmol each of the forward and reverse primers specific for each gene (SOD, CAT, PX; length primers were 20 bp, seeS1 Table), 1μg of cDNA and 1 unit of Pfu DNA
poly-merase (Fermentas). The PCR protocol was one cycle at 95°C for 5 min, followed by 20 cycles at 95°C for 1 min, 57.2°C for 1 min and 72°C for 2 min. The number of cycles for each target transcript was previously tuned-up to ensure that the amplified products were within the linear interval of amplification under this PCR protocol. Seven pmol of the forward and reverse prim-ers of the loading control gene transcript MA3998 [7,50] were added during amplification of the target genes to complete only 19 cycles.
For the internal control, it was previously determined the absence of competition for sub-strates and DNA polymerase with the target transcripts during the double amplification;i.e., the same band intensities of the amplified products should be attained in the single or double amplification reactions. In addition, it was verified that only one PCR product was obtained for each set of primers; the PCR product lengths were in the range of 115–139 bp (S1 Table). The samples were supplemented with loading buffer and separated by standard DNA electrophore-sis in a 2.5% agarose gel. Densitometric analyelectrophore-sis was carried out and a double normalization was done using the MA3998 as loading control of the PCR reaction and against control cells not exposed to O2.
4.6 Enzyme activities
Cell samples from cultures in the stationary phase were re-suspended in lysis buffer containing 0.1 M sodium phosphate and 1 mM EDTA at pH 8.0 and broken by vigorous vortexing and in-cubating for 30 min at 4°C as reported previously [51]. The resulting cell homogenate was treated with DNAse I to eliminate viscosity. The entire procedure of preparing cell homoge-nates was carried out under anaerobic conditions.
For protein determination, samples were incubated overnight at 4°C with 3% TCA and fur-ther centrifuged to discard remaining resazurine, which interferes with the protein determina-tion assay. The pellet was resuspended in water and protein was determined by the Lowry method using bovine serum albumin as standard.
CAT activity was determined at 35°C in 50 mM HEPES, 120 mM KCl, 1 mM EGTA and 50 mM NaCl at pH 7.0 (HKE-Na buffer) and 0.01–0.03 mg cell homogenate protein/mL. The reaction was started by adding 20 mM hydrogen peroxide and its consumption was monitored at 240 nm. An extinction coefficient of 43.6 M-1cm-1at pH 7.0 was used. One unit of enzyme activity is defined as 1μmol of substrate catalyzed min-1. The activity was fully inhibited by
10 mM NaCN.
PX activity was determined at 35°C by the method of Jiang et al [52]. Different electron acceptors were tested: 1 mM NADH, 1 mM NADPH, 55μM reduced cytochromec, 5 mM
CoM-SH or 10 mM ascorbate and 0.2–0.3 mg cell homogenate protein were mixed in HKE-Na buffer. The reaction was started by adding 50μM cumene hydroperoxide. To stop the reaction,
spectrophotometrically at 340 nm and 550 nm, using the molar absorptivity coefficients (ε) of 6.22 mM-1cm-1and 21.1 mM-1cm-1, for NAD(P)H and reduced cytochrome c, respectively.
Superoxide dismutase activity (SOD) was determined by a competitive inhibition assay using xanthine–xanthine oxidase system to reduce nitroblue tetrazolium (NBT). The reaction mixture contained 49 mM Na2CO3, 0.122 mM EDTA, 30.6 mM NBT, 0.12 mM xanthine, 0.06 mg free-fatty acid bovine serum albumin/ mL, 2.5–5μg cell homogenate protein/0.1 mL
and 2.5 mU xanthine oxidase/mL. The production of NBT-formazan was recorded at 560 nm. The amount of protein that inhibited NBT reduction by 50% was defined as one unit of SOD activity. Results were expressed as U/mg protein [53]. Several metals were tested as enzyme ac-tivators, but the intense background obtained, except for zinc, affected the assay (seeresults
section). No activity was found in the absence of the xanthine–xanthine oxidase system. SOD, CAT and PX activities were also determinedin gel. 20μg cell homogenate protein
were subjected to native polyacrylamide gel electrophoresis (10% acrylamide for SOD and CAT and 8% for APX) and activities were revealed following pre-established protocols (SeeS1 Textfile for further details).
4.7 Scanning transmission electron microscope (STEM) and biofilm
components
After 6 days of growth, cultures were supplemented with 100 mM methanolplus10 mL sterile air (2% O2) every 3 days until day 18. This treatment produced cell agglomerates (biofilms) in air-adapted cell cultures, but not in control anaerobic cell cultures. The precipitated cell ag-glomerates were separated from both the medium and planktonic cells by decantation and fixed with 2.5% (v/v) glutaraldehyde in TME buffer for its posterior preparation for electron microscopy as reported previously [51]; aliquots of cells from control cultures were centrifuged, resuspended in a small volume of TME buffer and also fixed with glutaraldehyde. For STEM, the fixed cells were post-fixed with 1% osmium tetroxide in TME for 2 h, and then rinsed three times with the same buffer. Each cell sample was placed in a filtration system with a 13 mm polycarbonate membrane of 0.6μm diameter pore (Whatman; Kent, UK) and dehydrated with
increasing concentrations of ethanol. Each membrane was recovered and dried in a critical point dryer apparatus (Polaron E5000; West Sussex, UK) with carbon dioxide. The samples were mounted on aluminum stubs on carbon double-side sticker and covered with 10 nm ion-ized gold film using coater system equipment (Polaron 11-HD). Finally, the samples were ana-lyzed in a scanning electron microscope (Zeiss DSM-950; Oberkochem, Germany) with secondary electrons accelerated at 15 kV.
In parallel, a second sample of biofilm was resuspended in TME buffer and homogenized. The biochemical composition of the biofilm, protein, carbohydrates and DNA was determined as reported elsewhere [22].
4.8 Exposure and tolerance to oxic conditions
To assess whether adapted cells indeed acquired enhanced skills to resist extreme oxic conditions, 4 culture bottles (with sterile needles through the stopper to allow for gas exchange between the bottle and the anaerobic jar) each of air adapted or control cells were placed into an 8 liter anaer-obic jar. The 8 L jar cap equipped with a rubber stopper, was sealed with a heat resistant silicone sealant and filled with a mixture of 73% N2, 18% CO2and 9% O2(V/V). Hence, samples of gas were taken at different times to determine the rates of O2and methane production by the 4 cell culture bottles. After 7.5 days, the anaerobic jar was uncapped and the cells in the 4 bottles were harvested by centrifugation and the protein content of each bottle was determined.
4.9 Genome analysis
Methanogenic genomes were obtained from the Kyoto Encyclopedia of Genes and Genomes (KEGG) online database (http://www.kegg.jp/kegg/catalog/org_list.html). Genomes from 27 genera published so far were analyzed. Strain types were selected where possible and incom-plete sequences were ignored. The genomes analyzed are shown inTable 1.
Supporting Information
S1 Fig. Electron microscopy analysis ofMethanosarcina acetivorans.HAADF-STEM projec-tion images of air adapted cells (A) and control anaerobic cells (B), cultured in methanol. En-closed in dashed circles, cell in the image (A) revealed high amounts of electro-dense dark granules (acidocalcisomes) surrounding the internal cell membrane (indicated by arrows), whereas in (B) these granules were scarce. Elemental analysis of these granules (C) showed high amounts of P, Ca and Al indicating that the acidocalcisomes were indeed filled with PolyP. Bar for air adapted cells: 0.5μm; for control cells: 0.2μm.
(TIF)
S2 Fig. Lipoperoxidation inM.acetivorans.(A) MDA content was determined in anaerobic control and air-adapted cells grown on methanol (white bars) or acetate (black bars) after 2 h of adding 2% O2as described in methods. Values are the mean ± SD of at least 3 independent preparations.P<0.01vsanaerobic control cells. (B) Representative traces of direct ROS
pro-duction driven by O2addition in methanol-grown cell suspensions (seemethodssection for details). Trace 1: anaerobic-control cells, trace 2: air-adapted cells, trace 3: anaerobic-control cells without methanol as substrate, trace 4: anaerobic-control cellsplus0.2 mM cysteine where ROS was not detected. Underlined numbers on the traces indicate the rate of ROS production in pmol ROS produced (min x mg cellular protein)-1.
(TIF)
S3 Fig. Cell aggregates formation induced by O2in cultures ofM.acetivoranswith methanol.
Representative pictures of cultures grown in the presence (A) or absence of 2% (V/V) of O2(B). It is noted that control cultures without air injected did not develop cell aggregates, whereas air adapted culture cells showed cell aggregates. See section 2.6 of results for more details.
(TIF)
S4 Fig. Effect of DNAase I on the turbidity ofM.acetivoranscell suspensions cultured in low salt medium.Absorbance changes of one mg protein from three independent cell cultures under 0.1 M NaCl are shown: control cells (filled symbols) and air adapted cells (open symbols) were added to a quartz cuvette with 1.8 mL of TME buffer. After 60 seconds of baseline acquisi-tion, DNAse I was added and the light pass was determined at 540 nm.
S1 Table. Sequences of the primers used for identification of the transcripts. (DOCX)
S1 Text. Methods and results. (DOC)
Acknowledgments
The authors thank Patricia Bizarro Nevares (Laboratory of Electron Microscopy, Department of Cellular and Tissue Biology, Faculty of Medicine, UNAM) and Physicist Roberto Hernandez Reyes (Institute of Physics, UNAM) for the preparation of the cell samples and ultra-structure analysis.
Author Contributions
Conceived and designed the experiments: RJC RMS. Performed the experiments: RJC MGSM ELS EP AZR JBD RE. Analyzed the data: RJC RMS ES. Contributed reagents/materials/analysis tools: RJC RMS ES AZR. Wrote the paper: RJC RMS ES.
References
1. Imlay JA (2008) Cellular defenses against superoxide and hydrogen peroxide. Annu Rev Biochem 77: 755–776. doi:10.1146/annurev.biochem.77.061606.161055PMID:18173371
2. Sies H (1993) Strategies of antioxidant defense. Eur J Biochem 215: 213–219. PMID:7688300 3. Rodriguez-Zavala JS, Ortíz-Cruz MA, Mendoza-Hernández G, Moreno-Sánchez R (2010) Increased
synthesis ofα-tocopherol, paramylon and tyrosine byEuglena gracilisunder condition of high biomass production. J Appl Microbiol 109: 2160–2172. doi:10.1111/j.1365-2672.2010.04848.xPMID:
20854454
4. Olin-Sandoval V, González-Chávez Z, Berzunza-Cruz M, Martínez I, Jasso-Chávez R, et al. (2012) Drug target validation of the trypanothione pathway enzymes through metabolic modelling. FEBS J 279: 1811–1833. doi:10.1111/j.1742-4658.2012.08557.xPMID:22394478
5. Kletzin A (2007) General characteristics and important model organisms. In:Archaea: Molecular Cell Biology. Cavicchioli R., Ed.: 14–92. Washington, D.C. ASM Press.
6. Ferry JG, Kastead KA (2007) Methanogenesis. In:Archaea: Molecular Cell Biology. Cavicchioli R., Ed.: 288–314. Washington, D.C.: ASM Press.
7. Li L, Li Q, Rohlin L, Kim U, Salmon K, et al. (2007) Quantitative proteomic and microarray analysis of the archaeonMethanosarcina acetivoransgrown with acetate versus methanol. J Proteom Res 6: 759–771. PMID:17269732
8. Angel R, Matthies D, Conrad R (2011) Activation of methanogenesis in arid biological soil crusts de-spite the presence of oxygen Plos One 6: e20453. doi:10.1371/journal.pone.0020453PMID: 21655270
9. Angel R, Claus P, Conrad R (2012) Methanogenic archaea are globally ubiquitous in aerated soils and become active under wet anoxic conditions. ISME J 6: 847–862. doi:10.1038/ismej.2011.141PMID:
22071343
10. Liu CT, Miyaki T, Aono T, Oyaizu H (2008) Evaluation of methanogenic strains and their ability to en-dure aeration and water stress. Curr Microbiol 56: 214–218. PMID:17990030
11. Leadbetter JR, Breznak JA (1996) Physiological ecology ofMethanobrevibacter cuticularis sp. nov.
andMethanobrevibacter curvatus sp. nov., isolated from the hindgut of the termiteReticulitermes
fla-vipes. Appl Environ Microbiol 62: 3620–3631. PMID:8837417
12. Tholen A, Pester M, Brune A (2007) Simultaneous methanogenesis and oxygen reduction by
Methano-brevibacter cuticularisat low oxygen fluxes. FEMS Microbiol Ecol 62: 303–312. PMID:17961173
13. Brioukhanov AL, Netrusov AI, Eggen RI (2006) The catalase and superoxide dismutase genes are tran-scriptionally up-regulated upon oxidative stress in the strictly anaerobic archaeonMethanosarcina
bar-keri. Microbiology 152: 1671–1677. PMID:16735730
14. Fridovich I (1995) Superoxide radical and superoxide dismutases. Annu Rev Biochem 64: 97–112.
15. Shima S, Netrusov A, Sordel M, Wicke M, Hartmann GC, et al. (1999) Purification, characterization, and primary structure of a monofunctional catalase fromMethanosarcina barkeri. Arch Microbiol 171: 317–323. PMID:10382262
16. Kratzer C, Welte C, Dörner K, Friedrich T, Deppenmeier U (2011) Methanoferrodoxin represents a new class of superoxide reductase containing an iron-sulfur cluster. FEBS J 278: 442–451. doi:10.1111/j.
1742-4658.2010.07964.xPMID:21138528
17. Horne AJ, Lessner DJ (2013) Assessment of the oxidant tolerance ofMethanosarcina acetivorans. FEMS Microbiol Lett 343: 13–19. doi:10.1111/1574-6968.12115PMID:23448147
18. McCarver AC, Lessner DJ (2014) Molecular characterization of the thioredoxin system from
Methano-sarcina acetivorans. FEBS J 281: 4598–4611. doi:10.1111/febs.12964PMID:25112424
19. Ferry JG (2010) How to make a living by exhaling methane. Annu Rev Microbiol 64: 453–473. doi:10.
1146/annurev.micro.112408.134051PMID:20528692
20. Pedone E, Bartolucci S, Fiorentino G (2004) Sensing and adapting to environmental stress: the archae-al tactic. Front Biosci 9: 2909–2926. PMID:15353325
21. Ault-Riché D, Fraley CD, Tzeng CM, Kornberg A (1998) Novel assay reveals multiple pathways regulat-ing stress-induced accumulations of inorganic polyphosphate inEscherichia coli. J Bacteriol 180: 1841–1847. PMID:9537383
22. Lira-Silva E, Santiago-Martínez MG, García-Contreras R, Zepeda-Rodríguez A, Marín-Hernández A, et al., (2013) Cd2+resistance mechanisms inMethanosarcina acetivoransinvolve the increase in the
coenzyme M content and induction of biofilm synthesis. Environ Microbiol Rep 5: 799–808. doi:10.
1111/1758-2229.12080PMID:24249288
23. Flemming HC, Wingender J (2010) The biofilm matrix. Nat Rev Microbiol. 8: 623–633. doi:10.1038/
nrmicro2415PMID:20676145
24. Sowers KR, Boone JE, Gunsalus RP (1993) Disaggregation ofMethanosarcinaspp. and growth as sin-gle cells at elevated osmolarity. Appl Environ Microbiol 59: 3832–3839. PMID:16349092
25. Thorgersen MP, Stirrett K, Scott RA, Adams MW (2012) Mechanism of oxygen detoxification by the sur-prisingly oxygen-tolerant hyperthermophilic archaeon,Pyrococcus furiosus. Proc Natl Acad Sci U S A 109: 18547–185452. doi:10.1073/pnas.1208605109PMID:23093671
26. Seedorf H, Dreisbach A, Hedderich R, Shima S, Thauer RK (2004) F420H2oxidase (FprA) from
Metha-nobrevibacter arboriphilus, a coenzyme F420-dependent enzyme involved in O2detoxification. Arch
Microbiol 182: 126–137. PMID:15340796
27. Cayley S, Lewis BA, Guttman HJ, Record MT Jr (1991) Characterization of the cytoplasm of
Escheri-chia coliK-12 as a function of external osmolarity. Implications for protein-DNA interactions in vivo. J
Mol Biol 222: 281–300. PMID:1960728
28. Sowers KR, Gunsalus RP (1995) Halotolerance inMethanosarcinaspp: role of Nε
-acetyl-β-lysine,α -glutamate, glycine betaine, and K+as compatible solutes for osmotic adaptation. Appl Environ Microbiol 61: 4382–4388. PMID:16535193
29. Zheng M, Aslund F, Storz G (1998) Activation of the OxyR transcription factor by reversible disulfide bond formation. Science 279: 1718–1721. PMID:9497290
30. Orell A, Navarro CA, Rivero M, Aguilar JS, Jerez CA (2012) Inorganic polyphosphates in extremophiles and their possible functions. Extremophiles 16: 573–583. doi:10.1007/s00792-012-0457-9PMID:
22585316
31. Qian Y, Borowski WJ, Calhoon WD (2011) Intracellular granule formation in response to oxidative stress inBifidobacterium. Int J Food Microbiol 145: 320–325. doi:10.1016/j.ijfoodmicro.2010.11.026
PMID:21185614
32. Rashid MH, Rumbaugh K, Passador L, Davies DG, Hamood AN, et al. (2000) Polyphosphate kinase is essential for biofilm development, quorum sensing, and virulence ofPseudomonas aeruginosa. Proc Natl Acad Sci U S A 97: 9636–9641. PMID:10931957
33. Tunpiboonsak S, Mongkolrob R, Kitudomsub K, Thanwatanaying P, Kiettipirodom W, et al. (2010) Role
of aBurkholderia pseudomalleipolyphosphate kinase in an oxidative stress response, motilities, and
biofilm formation. J Microbiol 48: 63–70. doi:10.1007/s12275-010-9138-5PMID:20221731 34. Rao NN, Kornberg A (1999) Inorganic polyphosphate regulates responses ofEscherichia colito
nutri-tional stringencies, environmental stresses and survival in the stationary phase. Prog Mol Subcell Biol 23: 183–195. PMID:10448677
35. Kim HJ, Yang KY, Cho BH, Kim KY, Lee MC, et al. (2007) Transcript accumulation from the rpoS gene encoding a stationary-phase sigma factor inPseudomonas chlororaphisstrain O6 is regulated by the polyphosphate kinase gene. Curr Microbiol 54: 219–223. PMID:17294328
37. Brioukhanov AL, Nesatyy VJ, Netrusov AI (2006) Purification and characterization of Fe-containing su-peroxide dismutase fromMethanobrevibacter arboriphilusstrain AZ. Biochemistry (Moscow) 71: 441–
447. PMID:16615865
38. Moran JJ, House CH, Freeman KH, Ferry JG (2005) Trace methane oxidation studied in several Eur-yarchaeota under diverse conditions. Archaea 1: 303–309. PMID:15876563
39. La Rotta CE, Bon EP (2002) 4-chlorophenol degradation by chloroperoxidase fromCaldariomyces
fumago: formation of insoluble products. Appl Biochem Biotechnol 100: 191–203. PMID:12018247
40. Kawagucci S, Yoshida YT, Noguchi T, Honda MC, Uchida H, et al. (2012) Disturbance of deep-sea en-vironments induced by the M9.0 Tohoku Earthquake. Sci Rep 270: 1–7.
41. LaPaglia C, Hartzell PL (1997) Stress-induced production of biofilm in the hyper-thermophile
Archaeo-globus fulgidus. Appl Environ Microbiol 63: 3158–3163. PMID:16535671
42. Erkel C, Kube M, Reinhardt R, Liesack W (2006) Genome of rice cluster I archaea the key methane pro-ducers in the rice rhizosphere. Science 313: 370–372. PMID:16857943
43. Scholten JC, Culley DE, Nie L, Munn KJ, Chow L, et al. (2007) Development and assessment of whole-genome oligonucleotide microarrays to analyze an anaerobic microbial community and its responses to oxidative stress. Biochem Biophys Res Commun 358: 571–577. PMID:17498652
44. Sprenger WW, Hackstein JH, Keltjens JT (2007) The competitive success ofMethanomicrococcus blatticola, a dominant methylotrophic methanogen in the cockroach hindgut, is supported by high sub-strate affinities and favorable thermodynamics. FEMS Microbiol Ecol 60: 266–275. PMID:17367516 45. Anderson KL, Apolinario EE, Sowers KR (2012) Desiccation as a long-term survival mechanism for the
archaeonMethanosarcina barkeri. Appl Environ Microbiol 78: 1473–1479. doi:
10.1128/AEM.06964-11PMID:22194299
46. Sowers KR, Baron SF, Ferry JG (1984)Methanosarcina acetivorans sp.nov., an acetotrophic meth-ane-producing bacterium isolated from marine sediments. Appl Environ Microbiol 47: 971–978. PMID:
16346552
47. LeBel D, Poirier GG, Beaudoin AR (1978) A convenient method for the ATPase assay. Anal Biochem 85: 86–89. PMID:147037
48. Ohkawa H, Ohishi N, Yagi K (1979) Assay for lipid peroxides in animal tissue by thiobarbituric acid re-action. Anal Biochem 95: 351–358. PMID:36810
49. Wong H, Anderson WD, Cheng T, Riabowol KT (1994) Monitoring mRNA expression by polymerase chain reaction: the "primer-dropping" method. Anal Biochem 223: 251–258. PMID:7887471 50. Rohlin L, Gunsalus RP (2010) Carbon-dependent control of electron transfer and central carbon
path-way genes for methane biosynthesis in the Archaean,Methanosarcina acetivoransstrain C2A. BMC Microbiol 10: 62. doi:10.1186/1471-2180-10-62PMID:20178638
51. Lira-Silva E, Santiago-Martínez MG, Hernández-Juarez VE, García-Contreras R, Moreno-Sánchez R, et al. (2012) Activation of methanogenesis by cadmium in the marine archaeonMethanosarcina
aceti-vorans. Plos One 7, e48779. doi:10.1371/journal.pone.0048779PMID:23152802
52. Jiang ZY, Woollard AC, Wolff SP (1991) Lipid hydroperoxide measurement by oxidation of Fe2+in the presence of xylenol orange. Comparison with the TBA assay and an iodometric method. Lipids 26: 853–856. PMID:1795606
53. Beauchamp C, Fridovich I (1971) Superoxide dismutase: improved assays and an assay applicable to acrylamide gels. Anal Biochem 44: 276–287. PMID:4943714
54. Zhang XS, García-Contreras R, Wood TK (2007) YcfR (BhsA) influencesEscherichia colibiofilm forma-tion through stress response and surface hydrophobicity. J Bacteriol 189: 3051–3062. PMID: