i
Equity
Valuation –
Eurocash SA
Francisco Valdez
Dissertation submitted in partial fulfillment of requirements for the degree of MSc in Business
Administration, at Católica Lisbon School of Business and Economics, 10th January 2013
i Abstract
Company valuation is a cumbersome endeavor, dependent on different theoretical frameworks and subject to the analysts’ subjective interpretations. This dissertation is focused on valuing Eurocash SA, a Polish wholesaler. Thus, providing an illustration of the challenges faced when valuing enterprises. In particular, three different theoretical frameworks, suggested by the most renowned authors in this field of study, were utilized to capture the value of Eurocash. To successfully accomplish such enterprise, state of the art literature was reviewed, in order to present the reasons for the choice of the valuation models. Additionally, and as a supporting evidence of the subjective trait of company valuation, the work here developed was also compared with a research note from Wood Co dated from September 2012.
ii Resumo
A avaliação de empresas é uma desafio complexo, dependente de diferentes modelos teóricos e sujeito a interpretações subjetivas por parte dos analistas. Esta dissertação está focada na avaliação da Eurocash SA, um grossista Polaco, proporcionando assim uma ilustração dos desafios enfrentados na avaliação de empresas. Em particular, três diferentes modelos teóricos, sugeridos pelos mais conceituados autores neste campo de estudo, foram utilizados para capturar o valor da Eurocash. Para completar com sucesso tal desafio, a mais renomeada literatura foi revista, a fim de apresentar as razões para a escolha dos modelos de avaliação. Adicionalmente, e como prova do traço subjetivo da avaliação de empresas, o trabalho aqui desenvolvido foi também comparado com uma nota de research da WOOD Co datada de setembro de 2012.
iii Acknowledgments
This dissertation is the culmination of a five year academic cycle at Catholic Lisbon. And although it was a result of my own hard work, there are a set of people that I would like to thank for their help and support on this thesis and along the years. Namely, my family and my friends for their patience and unconditional support, allowing me to pursue my dreams; Mr. Rui Amaral, Eurocash’s CEO, for his availability in answering my doubts, making this thesis possible; Professor José Tudela Martins, for his help and precious advices along the development of this thesis; and to all the other wonderful teachers that I had along my experience at Catholic Lisbon for the learning enrichment.
iv
Contents
Introduction ... 1
1.1 Objectives ... 1
1.2 Company and Research Note Choice ... 1
1.3 Dissertation Structure ... 1
2. Literature Review ... 3
2.1 Introduction... 3
2.2 Valuation Methodologies ... 4
2.2.1 Cash Flow Approaches ... 5
2.2.2 Value Creation ... 19
2.2.3 Contingent Claim Valuation ... 21
2.2.4 Relative Valuation - Multiples ... 22
2.3 Emerging Markets ... 25
2.4 Final Considerations on Valuation Methods ... 26
3. Eurocash Group Business Overview ... 27
3.1. Macroeconomic look: Poland... 27
3.2 Polish FMCG Market ... 29 3.2.1 Retail FMCG Market ... 30 3.2.2 Wholesale FMCG Market ... 31 3.2.3 Competition ... 32 3.3 Eurocash Group ... 34 3.3.1 Overview ... 34 3.3.2 Organizational Relations ... 35 3.3.3 Eurocash History ... 36 3.3.4 Distribution Channels ... 36
3.3.5 Eurocash Future Strategy ... 39
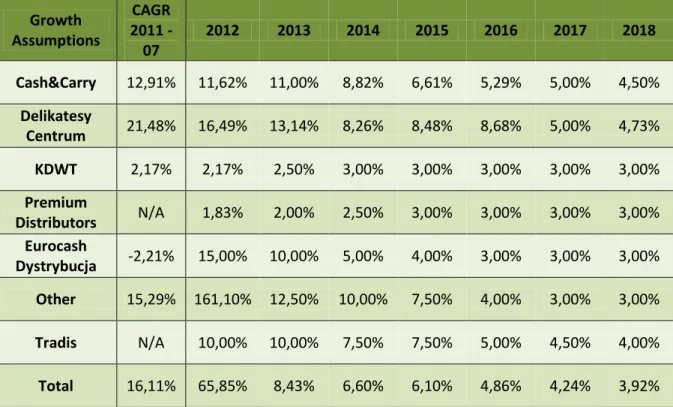
3.4 Forecasting ... 42
3.4.1 Revenues ... 42
3.4.2 Cost of Goods Sold: ... 46
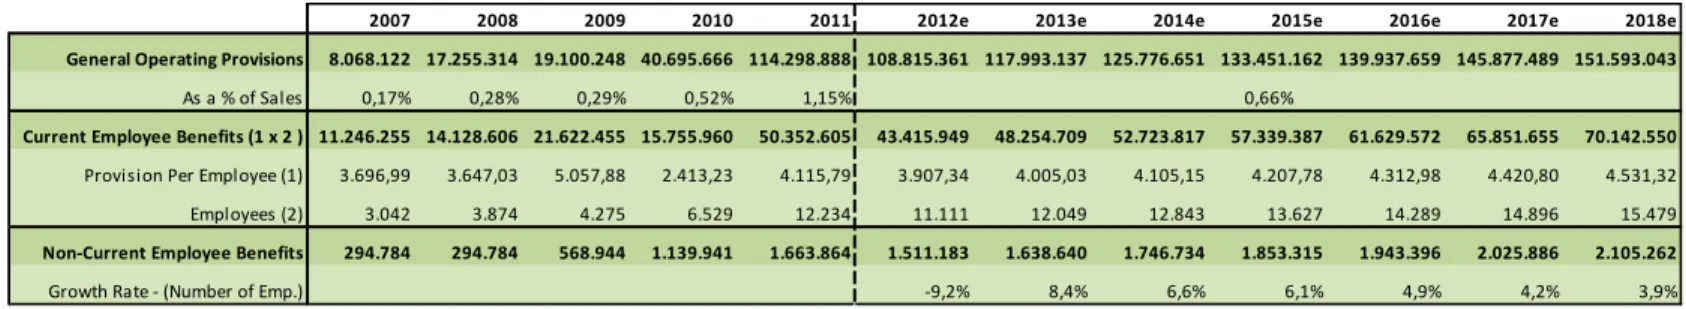
3.4.3 General & Administrative Costs and Provisions ... 46
3.4.4 Capex and Depreciation ... 49
v
3.4.6 Debt and Interest Payment ... 53
3.4.7 Tax ... 55
3.4.8 Tradis Synergies ... 56
3.4.9 Dividends and Equity Accounts ... 56
4. Eurocash Valuation ... 58
4.1 Valuation Metrics ... 58
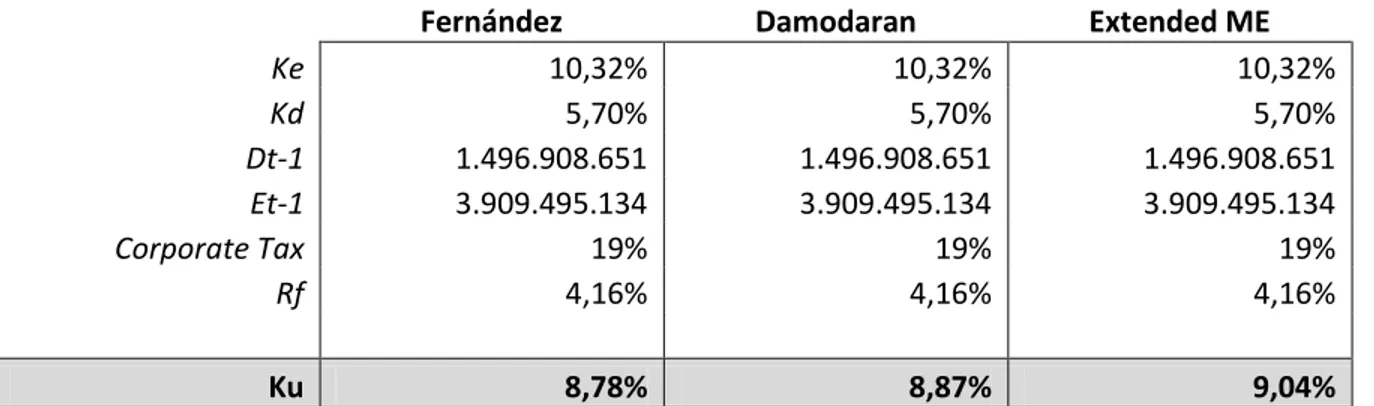
4.1.1 Cost of Equity - Ke ... 58
4.1.2 Cost of Debt – Kd ... 59
4.1.3Unlevered Cost of Equity – Ku ... 59
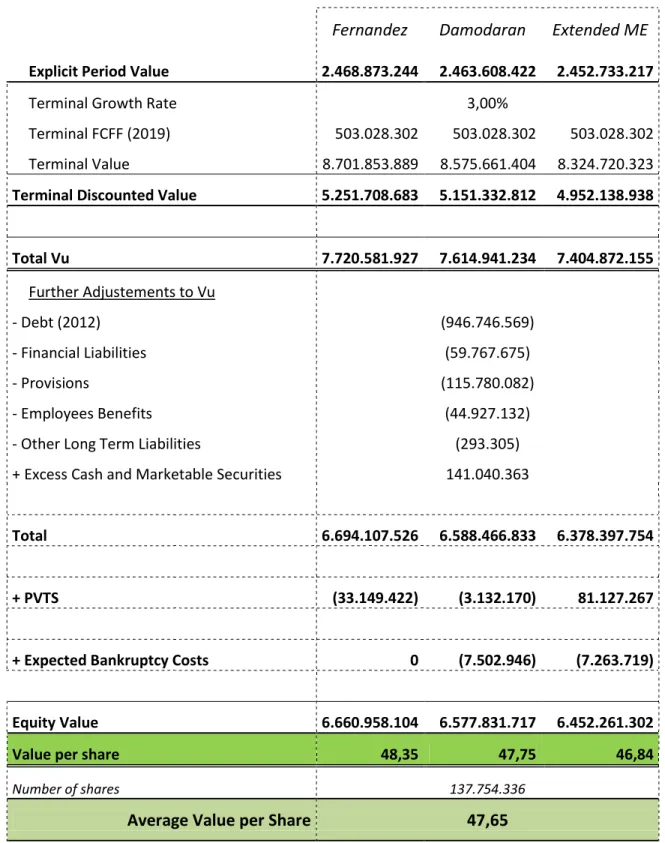
4.2 APV Valuation ... 60
4.3. Sensitivity Analysis ... 62
4.4. Multiples Valuation ... 64
5. Comparison with Research Note ... 68
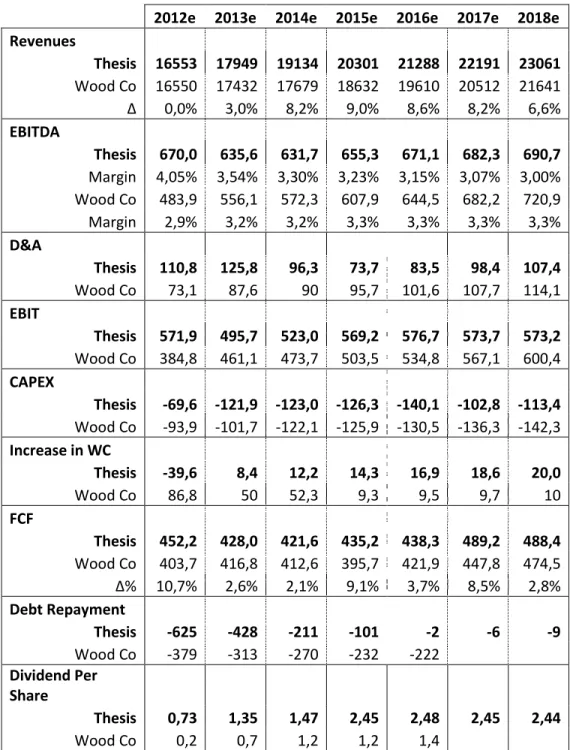
5.1 Business Fundamentals Differences... 69
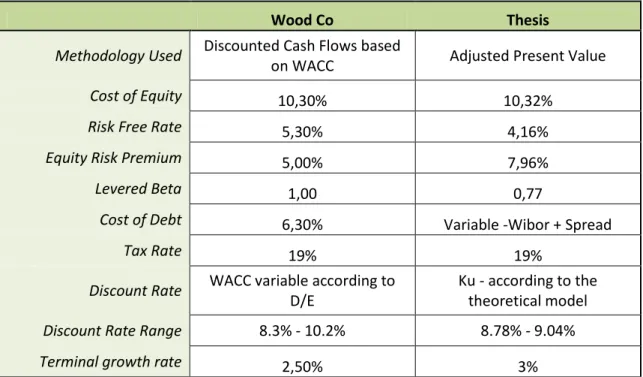
5.2 Valuation Methodology ... 72
5.3 Final Considerations on Wood Co Research Note ... 73
6. Conclusion ... 74
Appendixes ... 75
Appendix 1: Calculation of the value of tax shields - Formulas ... 75
Appendix 2: Polish population Distribution Urban/Rural ... 77
Appendix 3: Small Living quarters - no space to store food... 78
Appendix 4: High shopping frequency in Poland ... 79
Appendix 5: Retail Sales Cyclicity ... 80
Appendix 6: No Hope for Hypers ... 81
Appendix 7: Discounters reaching natural saturation limits. ... 82
Appendix 8: Polish Consumers shift of behavior ... 83
Appendix 9: Business Units Growth Rates ... 84
Appendix 10: Depreciation & Amortization Rates ... 85
Appendix 11: Net Working Capital ... 86
Appendix 12: Wibor 3M and Wibor 1M ... 88
Appendix 13: Tax ... 89
vi
Appendix 15: Credit Rating ... 91
Appendix 16: Present Value of Tax Shields ... 93
Appendix 17: Bankruptcy Probability ... 94
Appendix 18: Peer Group Definition ... 95
Appendix 19 : Eurocash Income Statement (million zloty) ... 96
Appendix 20: Eurocash Balance Sheet (million zloty) ... 97
Appendix 21: Cash Flow Statement (million zloty) ... 98
Appendix 22: Research Note ... 99
Bibliography ... 106
1
Introduction
1.1 Objectives
The dissertation thesis hereby presented is an equity valuation applied project of a Polish listed company, Eurocash SA. To successfully complete such venture I propose to:
1. Perform Eurocash SA valuation according to state-of-art literature regarding company valuation with the final purpose of setting a target price;
2. Compare my own findings with the research note of a top investment banking, explaining the differences between the two results;
3. Elaborate a research note similar to what is done by analysts in investment banks.
1.2 Company and Research Note Choice
My choice has hinged on Eurocash SA, a FMCG wholesaler and one of the largest Polish companies, with over two billion euro in sales last year. The reasons for this choice underlie on my interest for Poland and for the retail market.
The Research Note chosen was the one published by Wood Co, being the underlying reason the fact that it was the most recent and the only research note to be issued after the 2012 half year results.
1.3 Dissertation Structure
To successfully achieve the goals and the purpose of this dissertation mentioned previously, I structured this work in five chapters:
1. In chapter 2 different authors and valuation methodologies are revisited, with the purpose of finding the method/s that best apply to the specific case of Eurocash’s valuation;
2. In chapter 3 it is presented a macroeconomic overview of Poland; the retail and wholesale market environment, as well as, a full description of Eurocash business and future
2
strategies; In this chapter it is also presented Eurocash’s business fundamentals estimations, essential to build and support the respective equity valuation;
3. Eurocash’s valuation is performed in chapter 4, in accordance with the theoretical models chosen under the literature review; moreover, it is also displayed in this chapter a sensitivity analysis, so as to analyze the potential range of values of Eurocash in case predictions fall short or above expectations;
4. In the fifth chapter this dissertation findings are compared with Wood Co’s research note. The differences in the business fundamentals and in the valuation methodologies are comprehensively analyzed, to reflect and understand the reasons for the different result; 5. The sixth and last chapter concludes this thesis dissertation, analyzing the findings of this
3
2. Literature Review
2.1 Introduction
“(…) In a market economy, a company’s ability to create value for its shareholders and the amount of value it creates are the chief measures by which it is judged”
(Koller, Goedhart & Wessels, 2010)
Value ought to be seen as a key metric of a company’s performance, since it relates with the interests of every stakeholder. According to recent researches, a company that aims at maximizing the value to its shareholders is simultaneously: creating sustainable and long lasting employment; improving customer satisfaction and bearing a larger corporate responsibility. Furthermore, focusing on value ensures better resource allocation decisions, as economic, human capital and natural resources have to be better employed, in order to generate a greater value to the company. (Koller, Goedhart & Wessels, 2010)
As stated previously, value is undoubtedly an important measure of performance; however, the reasons to value a company are extensive (Fernández, 2007):
1. M&A operations
- To set a range of values: Buy Side (Highest price to pay) & Sell Side (Lowest price to sell) 2. Valuing listed companies
- Recommend whether to buy, sell or hold the shares by comparing the value obtained with the actual market price.
3. IPOs
- To set a price for Initial Public Offerings. 4. Compensation schemes based on value creation:
- To quantify the value creation by executives in a company or particular business units. 5. Identification of value drivers
- To identify the major drivers of value for the company or business units. 6. Strategic decisions and planning:
4 The purpose of the evaluation developed in this dissertation focuses on the second topic abovementioned. Nevertheless, in order to do such a valuation it is critical to identify the major drivers, as well as, forecast strategic decisions and planning. Thus, it is easy to conclude that the purposes of valuation are not static.
2.2 Valuation Methodologies
To undertake a valuation is not a synonym of a quest for defining the “true” value of a company. A valuation is neither objective nor precise, as all valuations are biased. The only doubts are by “how much” and in which direction. Additionally, complex and intricate models do not necessarily perform better than simpler ones, mainly because they require a larger number of inputs which means higher degrees of subjectivity, and additional “noise” to the models. (Damodaran, 2011) Currently there are available several models for valuing companies, using different assumptions and methodologies that determine fundamental value, which pose an additional challenge – “which is the right model for a given company?”. With the intention of answering this question it is relevant to understand the sources of value of each model and the logical assumptions on which the models are based. (Damodaran 2006)
Even though all models present distinctive characteristics, they do share some common aspects between them, which allow to segment them in different categories (Damodaran, 2006 & Fernández, 2007): Table 1
Valuation Methodologies
Cash Flows Approaches Value CreationApproaches Contigent Claim
Relative Valuation Multiples
5 In the following pages, these four methods of company valuation are studied in detail, with the purpose of selecting the appropriate model or mix of models that best fit the valuation of Eurocash, taking into account its particular characteristics.
2.2.1 Cash Flow Approaches
These valuation approaches shoulder the value of a company based on future cash flows, discounted at a rate that reflects the riskiness of those cash flows. There is an extensive literature regarding this topic, which is considered by academics as the best theoretical approach towards company valuation (Damodaran, 2006).
Discounted Cash Flows (Damodaran, 2002)
2.2.1.1 Free Cash Flow to the Firm (FCFF)
FCFF represents the cash flow that is available to distribution to all owners of capital of a company, namely, equity holders, debt holders and other debt mezzanine holders (e.g. convertible securities; preferred shares).
For accounting purposes, FCFF is the net operating profit after taxes, i.e., EBIT after tax, plus all non-cash charges minus capital expenditures and changes in working capital:
As it is reasonable, these cash flows have to be independent from the capital structure, therefore any principal payments or receipts from capital holders are not taken into account.
Discounting the expected FCFF at the weighted average cost of capital, which is the average cost of the different sources of capital (Equity, Debt and Mezzanine) weighted by their relevance in the total market value of the company, leads to the value of the whole firm. Lastly, in order to get the value of the company’s equity it is required to deduct from the value of the whole company non-equity claims.
t
t
6
2.2.1.2 Free Cash Flow to Equity (FCFE)
FCFE, in contrast with FCFF, represents the cash flows that are attributable to the equity holders of an enterprise, that is, the net profit plus all non-cash charges deducted from capital expenditures and changes in working capital and taking into account the changes in debt structure (issue and repayment of debt) (Schweser, K., 2008)
Alternatively, from FCFF:
(4)
Discounting the future Free Cash Flows to Equity at the required rate of return demanded by shareholders - cost of equity - leads to the value of the enterprise’s equity.
t t
2.2.1.3 Adjusted Present Value
Under this valuation framework the underlying principle is “value additivity”, which means that it is possible to detach the different value sources and then sum the different parcels to reach a final value (Luerhman, 1997). In particular, the value of the enterprise is obtained by unscrambling the value of the effects of debt financing (e.g. present value of tax shields and bankruptcy costs) from the value of the assets of the business.
The value of the assets of the business is considered the value unlevered, that is, the value of the company as if it was completely equity financed. Afterwards, different sources of value should be consider, particularly, the collateral effects of different financing schemes, such as the tax savings from interest payment and bankruptcy costs. One must bear in mind that, a leverage increase, increases interest payment, and therefore decreases the taxes a company must pay, but, on the other hand, it also increases the possibility that a company will go bankrupt as a consequence of failing its increasing onerous obligations towards debt owners. (Damodaran, 2006)
7 Finally, in order to get to the equity value, it is necessary to subtract from the enterprise value all non-equity claims. t t
Regardless of the DCF model chosen (Free Cash Flow to the Firm; Free Cash Flow to Equity; or Adjusted Present Value, just to name a few) the underlying general idea is common: the value of the levered firm equals the value of the unlevered firm plus the collateral effects of the financing scheme (Cooper & Nyborg, 2006):
Vu VT ankruptcy Costs
However, as it is explained further, in the WACC approaches the collateral effects of the financing program are already incorporated in the discount rate, whereas under the APV framework they are calculated separately.
2.2.1.4 Which model to choose: APV or WACC?
According to Sabal, J. (2007), the APV method is, currently, the most widely used valuation model after WACC approaches. Given the different advantages and drawbacks of each model it is important to define which of them is a better fit to value the company in hand.
The same author states that APV and WACC models are equivalent when: the cash flows are no-growth perpetuities; there is a single and constant corporate tax rate; and the leverage ratio is constant. However, in the real world these assumptions are not likely to be verified, particularly, the constant leverage ratio and corporate tax rate assumption. If these assumptions are not met, the APV model presents a set of features that makes it a more appropriate model, namely:
1. It does not require a fixed leverage ratio, as the enterprise is valued in a whole, regardless of the leverage impact on value. The debt level impact is considered independently.
2. Tax savings are computed for each period, which means that the tax rate can be adjusted according with the legislation in force in each period.
8 Nevertheless, this author stresses that the WACC method is the most accurate method for discounting the perpetuity - generally assumed at the end of the explicit period – since, usually, at this point in time it is assumed a fixed leverage ratio, and, furthermore, the WACC adjusts automatically for the discount rate applicable to the tax shields.
Luerhman (1997) and Koller et al. (2005b) partially corroborate the findings of Sabal, stating that the WACC approaches are only suitable when there is a fixed leverage ratio, which is not the case of most companies, since capital structures are not rigid and static. Koller et al. also affirm that it is possible to make amendments to the WACC model to accommodate changes in capital structure, yet, due to the difficulty of such a process they recommend to use the APV method.
On the other hand, in spite of the clear advantages of the APV model under dynamic capital structures, the model also displays major drawbacks. In particular, the burdensome effort of estimating bankruptcy costs (Damodaran, 2006); and the choice of the discount rate to discount tax savings, as there is no consensus on this topic and analysts base their choice on the framework they find more applicable to the reality, which can lead to very different results.(Massari, Roncaglio & Zanetti, 2008)
As far as I am concerned, I will adopt the APV approach, since Eurocash has made recently a large acquisition recurring to a great amount of debt, and it is likely that the debt levels will lower to the levels prior to this operation. Therefore, we will assist to changes in the capital structure as the debt is repaid. Moreover, the advantage defended by Sabal, that the WACC adjusts automatically for the discount rate of tax shields does not seem a clear benefit, since the WACC formula is also dependent on the theoretical framework one chooses, regarding the discount rate for tax savings.
9
2.2.1.5 The Adjusted Present Value
2.2.1.5.1 Value of Tax shields
There is an extensive literature regarding the valuation of the benefits arising from tax savings on interests, below it is described the most common theoretical approaches (Fernández, 2007): Modigliani & Miller, 1959 – The value of tax shields, assuming that operational cash flows are a perpetuity, is equal to the present value of tax savings on a risk free debt discounted at the risk free rate.
Myers, 1974 – the value of tax shields is equal to the present value of tax savings discounted at the cost of debt, since the risk of tax benefits is equal to the capability – risk - of paying debt.
Milles and Ezzel, 1980 – these authors stated that, under the assumption that the firm has a fix debt target ( D / V ), the discount rate for the first year tax savings should be the Kd and Ku for the subsequent years.
Harris and Pringles, 1985 – these authors argued that tax savings have the same risk as the firm’s underlying cash flows, since the firm will only pay taxes if it has operational profits. Therefore, under this framework tax savings should be discounted at the required return on assets [Ku] on all periods.
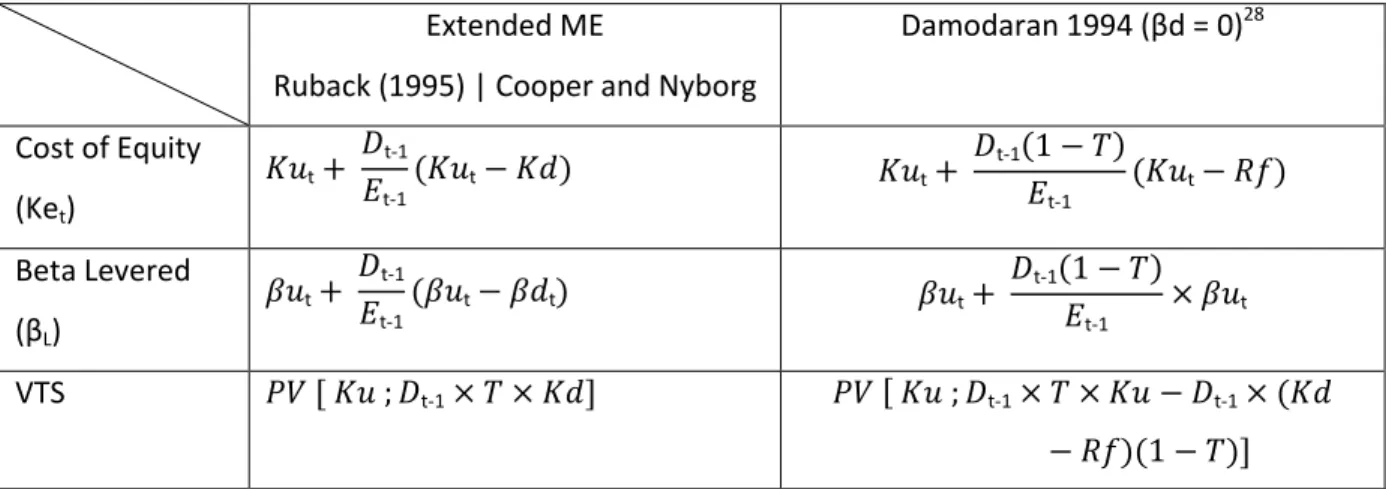
Damodaran (1994) - this author does not provide a formula to calculate VTS, instead he relates the levered beta with the asset beta, assuming that all of the business risk is borne by equity. This approach does not seem realistic, since the main assumption is that the cost of debt is equal to the risk free rate and it is uncorrelated with the risk of the business. However, one might interpret this approach as a way to introduce higher leverage costs in valuation. Nevertheless, it is still not a realistic approach as even though debt holders bear lower market risks they still bear part of the business risk, especially on high leveraged firms.
Acknowledging this, the author expresses another more appropriate formula which takes into account a debt beta different from zero (Damodaran, 1999). However it is not express the way of
10 calculating the VTS under this assumption and therefore I am unable to consider the latter approach.
Practitioners’ method – Fernández names it the practitioners’ method since it is a method most often used by consultants and investment banks. Once more, this method does not contemplate a formula to calculate VTS; it only defines a relation between levered beta and the asset beta. The interpretation should be, as well, as a methodology to introduce leverage costs into valuation frameworks.
Fernández (2002a, 2004, 2005a, 2005b, 2007) - unlike all the authors referred Fernández defends that the value of tax shields is not the present value of tax savings from interest, instead it is the difference between the present value of taxes for the leveraged company and the present value of taxes for the unleveraged company. Under this framework the VTS is the present value of D x T x Ku (not the interest tax shields) discounted at the required return on assets [Ku]. This author also expresses the formulas to calculate VTS under different assumptions, namely, when the debt nominal value is different from its market value and when there are costs of leverage.
Cooper and Nyborg, 2006 – these authors explicitly contradict the findings of Fernández stating that “the value of the tax shields IS the present value of tax savings from interests”. They present two approaches to calculate the value of tax savings when there is a non-constant leverage ratio: (1)tax savings have the same risk as the operating cash flows (Extend ME); (2) tax savings have the same risk as debt (Extended MM).
The first scenario shall be applicable when there is uncertainty if the firm will be paying taxes in the future, that is, if it is going to have a positive net income, and, therefore, the risk of tax savings should reflect the risk of operating cash flows. This theory is in fact similar to Ruback’s capital cash flow approach (1995).
The second framework is, as the name suggests, an extension of MM theory, however it does not assume a constant leverage ratio and neither that the operating cash flows are perpetuities. Under this theory the amount of debt in each period is known a priori and the VTS is equal to the expected interest tax savings discounted at the cost of debt.
Nonetheless, it is important to stress out that Cooper and Nyborg findings rely on the assumption that the book value of debt is equal to its market value, and no costs of leverage were considered.
11 After analyzing and studying the different theoretical frameworks, and taking into account the work of Fernández (2002a, 2004, 2005a, 2005b, 2007), I discarded the first four theories and the practitioners’ method as they do not present adherence in the real world, and the assumptions in which they rely on are not verifiable in the actual world. I decided to discard as well the extended MM theory, since has explained by Ruback (2000) interest tax savings only share the same risk as debt under the assumption of a fixed debt value, however when debt is changing over time it is more reasonable to assume that tax savings bear the same risk as operational cash flows, and thus extended MM is no longer applicable.
Thus, as far as Eurocash valuation is concerned, the models for calculating the value of tax shields considered are: Fernández; Cooper and Nyborg – Extend ME; and Damodaran with βd = 0.1
2.2.1.5.2 Bankruptcy Costs
Contrariwise, the normal procedure under the APV approach, Fernández stats that the calculation of the value of tax shields under the existence of costs of leverage already incorporates bankruptcy costs. Damodaran, on the other hand, argues that even considering the costs of leverage it is still necessary to deduct the value of the expected bankruptcy costs. Cooper and Nyborg extended theories do not consider costs of leverage and so there is no arguing in the fact that it is necessary to deduct bankruptcy costs under this valuation framework.
Damodaran (2006) defends that:
The inputs for this formula are not consensual, since it is particularly difficult to estimate the probability of bankruptcy of a company and even more difficult to estimate the bankruptcy costs. These costs do not involve only direct costs – liquidation costs -, but also indirect costs, arising from the attitudes of stakeholders towards the company when they perceive that the company is on distress, which are much more subjective and harder to estimate. Nevertheless, Damodaran
1
The formulas for the calculation of the value of tax shields according to each of the theories chosen are presented in appendix 1.
12 suggests estimating the probability of default based on the corporate bond ratings; and the bankruptcy costs based on studies which have hinged on the amplitude of these costs on actual companies. Regarding the latter, studies have shown that direct costs amount on average to 5% of the enterprise value (Warner, J.N., 1977), whilst indirect costs tend to amount to a range between 10 and 23% (Andrade & Kaplan, 1998). Due to the lack of consensus concerning this parameter I will adopt a precautionary measure, assuming that total bankruptcy costs amount to 30%, which is in accordance with Damodaran point of view.
2.2.1.5.3 Estimation of Ke
Every investment bears an exposure to risk, and, assuming rational decisions, investors will demand, for higher levels of risk, higher returns. However, although all models of risk rely on two common assumptions: (1) the risk is the one perceived by a diversified investor; (2) and the demanded returns are a function of the risk levels; they present very different approaches to calculate risk. The most commonly used is the Capital Assets Pricing Model, which takes into account the asset's sensitivity to non-diversifiable risk (the levered beta); the market risk premium and the risk-free rate. Below it is the expression for the risk of equity securities, yet the model can be applied to any type of securities and assets (Damodaran, 1999):
As aforementioned the cost of equity, reflects the required rate of return demanded by equity holders.
Parameters Estimation
2.2.1.5.3.1 Risk Free Rate
Prior to the banking crisis of 2008, most analysts used as risk free rate the long term government bonds, since no one would even consider the probability of default of a developed country’ government. However, the 2008 shock changed critically all the assumptions made until then. Investors started questioning “the credit worthiness of U treasuries, UK gilts, and German bonds”; the credit rating of US government was downgraded; and some European countries were
13 bailed out. As a result government bonds can no longer be defined, by default, as risk free. (Damodaran, 2010)
Prior to define the risk free rate, it is necessary to understand what a risk free investment is. A risk free investment is an investment, which the actual returns are equal to the expected returns, that is to say, the expected returns are paid with 100% probability. Thus, for an investment to be considered risk free it has to meet two basic conditions:
1. No default risk – a condition that only governments can meet, since even the largest company in the world can default. Governments, on the other hand, can always print more currency, and, thus, meet with their obligations, at least in nominal values. Nevertheless, it has been proved across history that governments might not honor their commitments with creditors, for different reasons.
2. No reinvestment risk – as it is not possible to predict the rates at which the coupons will be reinvested in the future, one may only consider a risk free investment if it is a zero coupon security.
According to the abovementioned conditions only government zero coupon bonds can be used as risk free rate.
In an ideal world, the cash flows should be discounted using a risk free security that has the same maturity and that is denominated in the same currency as the company’s cash flows, so that inflation is modeled in a consistent manner between cash flow and the discount rate.
In this specific case, currency is not an issue, since Poland issues government bonds in zlotys, the same currency as Eurocash’s cash flows. However, regarding maturity it is impossible to have an exact match, since cash flows are assumed to be ongoing and bonds have fixed maturities. To address this latter problem, what most analysts do is to simply choose a single yield to maturity bond that best matches the cash flows’ maturity. Given the characteristics of the cash flows’ being valued one might think that the best approach should be the largest maturity bond, however bonds longer than 10 years face problems of liquidity and, therefore, their price might not correspond to their fair value (Koller et al., 2005b). Hence, and as suggested by Koller et al., I will choose the Polish 10 year government bond issued in zlotys.
14
2.2.1.5.3.2 Levered Beta
The beta should reflect the additional risk that the security on hand as added to a well-diversified portfolio; thus, it measures the asset’s sensitivity to non-diversified risk. In practical terms what is done is a linear regression of the security returns against the market portfolio returns, which might be represented by a market index (Damodaran, 1999). The equation is the following:
Rj – returns on the asset
Rm – Returns of the market portfolio b – Levered beta
The beta is the slope of the regression, as it embodies the risk added by the investment on the asset to the overall portfolio.
Although the approach seems quite intuitive and straightforward there are some issues that should be dealt with, in order to reach a fairly good estimation of the beta (Damodaran, 1999):
1. Market Index Choice: No indices measure the market portfolio, instead there are equity market indices that comprise a set of equity securities which may or may not be representative of a market portfolio.
2. Time Period: It should be kept in mind that a longer time span comprises more observations, but on the other hand if the firm has changed along time then a longer time period will include years in which the company was different in its fundamental characteristics. The goal is to estimate a beta that is the best fit for the future, not the best fit for the past, and as such the time period should only include an interval in which the company characteristics resemble the likely future characteristics.
3. Return Interval: Shorter return intervals produce more observations, however assets are not traded continuously, and therefore daily intervals may reduce the correlation with the portfolio. On the other hand, quarterly and annually returns comprise very few observations, thus, and as advised by Damodaran, the return interval most adequate is the monthly one.
15
2.2.1.5.3.3 Equity Risk Premium
The equity risk premium is a measure of the price that a diversified investor attributes to the perceived risk of a given market, that is, it reflects the “risk premium for investing in the market portfolio (…) relative to the riskless rate” (Damodaran, 2012)
There are three main practical approaches to determine equity risk premiums: (1)surveys to managers to get a general knowledge of what are their expectations towards future returns on equity; (2) expectation based on historical premiums, which are computed by comparing the excess return of equity securities in comparison with risk free assets; (3) and implied premiums, which are a result of estimating forward-looking premiums.(Damodaran, 2012)
As far as I am concerned I will use the historical premiums to estimate the equity risk premium, since it is the only calculation method that does not imply any assumption, and therefore it mitigates the subjective influences on the valuation framework.
2.2.1.5.4 Cost of Debt
The cost of debt reflects the returns demanded by debt holders for the level of risk of the company. In practical terms, Koller et al. (2005b), advise to estimate this value through the yield to maturity of the company’s bonds:
In the case that the company does not have liquid long-term debt, which is the case of Eurocash, there are two acceptable approaches to estimate the cost of debt:
Use credit ratings: Daniels, K. and Jensen, M. (2005) concluded that there is a strict correlation between the credit ratings and the credit spreads. Under this approach one adds to the risk free rate the correspondent credit spread associated with the credit risk of the company analyzed.
16 Use the interest rate for the latest relevant long term loan as a proxy for the cost of debt. This is also a fair approximation for the Kd, under the assumption that the bank perceives correctly the risks associated with lending money to that particular institution.
2.2.1.5.5 Tax Considerations:
When computing the tax rate over operational income one might consider two different approaches: i) the marginal tax rate or ii) the effective tax rate.
The effective tax rate is defined as the average rate at which a corporation is taxed on earned income, while the marginal tax rate reflects the tax paid on the last dollar of income. The values are usually different, since, under most legislations, the tax rate will be different according to the level of income2, and, furthermore, firms may also be able to defer taxes, which will decrease the actual tax paid on a period.
Since the objective is to estimate the real tax savings it is not incorrect to use the effective tax rate. However, under this method underlies the assumption that the company will defer taxes continuously, which is not a correct assumption. Thus, and as pointed by Damodaran (2006) and Koller et al. (2005b), the best approach is to use the marginal tax rate. Nonetheless, Koller et al. stresses that the reported taxes on a company’s annual statement reflects, not only the impacts of operating items, but also the impact of non-operating and financial items. And, therefore, analysts should try to detach the latter impacts to find the marginal tax rate over operating items only. Naturally, the success of this step will depend in a large extent to the quality of the information disclosed by the company.
Additional Note: Deferred Taxes
Deferred taxes might be seen as an operational item, since they will flow under the form of cash taxes and subsequently they should be valued as part of the overall enterprise value. Under this assumption, deferred taxes are considered as part of the working capital of the enterprise. (Koller et al., 2005b)
2
Assuming that for the first €10.000 the tax rate is 10% and for the subsequent it is 20%. A company that earned an income €25.000 will pay an effective tax rate of 16% - €4.000 / 25.000; ( 4.000 10.000 x 10% 15.000 x 20% ) while the marginal tax rate is 20%
17 2.2.1.5.6 Terminal growth rate
When performing a company valuation one of the main assumptions is the “on-going concern”, that is, the assumption that the company will remain in operation for the foreseeable future. As a result it is necessary to estimate the terminal value after the explicit period. The common approach is to do so by applying the growing free cash flow perpetuity formula:
It is mathematically logical that the terminal value will account for the largest part of the total company value, and it will be largely determined by the growth rate set. The only restriction regarding the growth rate is that it must be lower than the growth rate of the economy in which the company operates, as otherwise in a certain point in time the enterprise FCFs would be greater than the economy itself (Damodaran, 2006). Koller et al. (2005b) suggest that the best approximation is the long term rate of consumption growth for the particular industry, plus inflation. Yet, it is useful to develop a sensitivity analysis to understand the impact of the growth rate on the value of the company.
2.2.1.5.7 From Entreprise Value to Price per Share
The adjusted present value method is a valuation framework oriented towards the valuation of the core operations of the overall enterprise3; therefore there are still some adjustments that have to be made in order to get to the equity value. In particular it is necessary to deduct from the core operations value all claims that are not represented by equity holders, namely: short and long term debt, debt equivalents (unfunded pension liabilities for instance) and hybrid securities (e.g. employee stock options). (Koller et al., 2005b)
Debt – Deduct the market value of debt, which may not be equal to the book value, especially if there are fixed interest rate and long term debt outstanding. Under these circumstances it is
3
It is referred as the value of the core operations and not the enterprise value since the overall enterprise value should take into account nonoperating assets as well (e.g. excess cash and nonconsolidated
18 critical to compute the market value of debt, using the actual cost of debt (Kd) not the interest rates.
Pension Liabilities – It should be treated as debt equivalent and it should be accounted at market values, which is easily found since recent changes in accounting policies oblige companies to adopt a market-to-market standard regarding the discrimination of these values on the accounting books.
Provisions – Some provisions might be considered non-equity claims and thus they have to be deducted from enterprise value. Particularly, Koller et al. (2005b), identify two types of provisions that should be deducted as debt equivalents: Long-term operating provisions and Nonoperating provisions. Given that the first type of provision reflects the discounted cash expenses that are payable on the long term the book value resembles the actual market value. Contrariwise, the second type of provision is not recorded at a discounted value, however the authors stat that the book value is still a good proxy, since the cash outlays are due in the short term.
Minority interest – a company might control but not fully own a subsidiary, and under this situation the subsidiary’s financial statements are fully consolidated in the holding company’ accounts. Thus, it is necessary to do some adjustment in order to deduct the value of the subsidiary that the holding does not owned - the so called minority interests. If the subsidiary is publicly listed then it should be used the market prices to value the minority position, if not then it should be used DCF or multiple approaches according to the extent and quality of the information available.
19 2.2.2 Value Creation
Value creation models, also known as, Excess Return models are variants of the common discounted cash flow model. Under this approach excess return cash flows are detached from normal return cash flows. Normal return cash flows are defined as the required return adjusted to the rate of cost of capital or equity; logically, excess return cash flows represent the returns that fall below (-) or above (+) the normal returns.
The logic beyond this theory is based upon the conjecture that a project is only valuable when the returns on equity are higher than the cost of capital. The value of the firm is then computed through the estimation of future excess earnings. (Damodaran, 2006)
2.2.2.1 EVA
There are several Value creation models, but the most widely used is Economic Value Added (hereon expressed as EVA). EVA aims at creating an “operating measure of periodic discounting that is consistent with discounted cash flow (DCF) valuation and highly correlated with current market value” (O’ yrne, 2005). It is calculated as the excess return gained on an investment or portfolio of investments:
Which is equivalent to:
- - Fernández, 2002c
Thus, EVA simply differs from FCF methods by replacing the actual CAPEX for the year with a capital charge based on book value of capital and the cost of capital. The underlying rationale for this, is that the reason for FCF poor performance in terms of correlation with current market prices has to do with the fact that capital expenditure is not matched with the periods they benefit the company, a problem that EVA tries to answer. (O’ yrne, 2005)
20 2.2.2.1.1 EVA Inputs
Capital Invested
Defining the capital invested in assets in place is the most challenging step when performing an EVA valuation. The market value of the firm cannot be used, as it reflects not only capital invested in assets in place but also in growth opportunities. Usually, analysts use as a proxy the book value of capital to estimate the value of assets in place. However, as Damodaran stats, book value is dependent on accounting policies and choices, and therefore this value needs to be adjusted accordingly.
Return on Capital Invested
Estimation of the forecasted after tax operating income made on the investments made. Cost of Capital
In order to ensure comparability with discounted cash flow methods, the cost of capital is determine based upon the market values of the firm’s debt and equity. One might raise the question that there is a contradiction in using market values to estimate the cost of capital and book values to estimate the capital invested. However, we should bear in mind that, in order to generate value the company as to earn more than its market value cost of capital not the book value cost of capital, as it does not reflect the reality.
2.2.2.1.2 Equivalence of EVA and DCF Models
EVA expresses the same cost of investing as FCF, but it also considers initial book capital, which has no impact on FCF. Therefore the value of the company can be expressed in terms of EVA and beginning book capital (O’ yrne, 2005):
Equivalence with DCF:
21 It is mathematically demonstrable that EVA and DCF Models valuations should match, as long as the assumptions are consistent between the two models. Several authors have taken such endeavor and proved this linkage between the two models; indeed, Fernández (2008) has reached the conclusion that the information required for both models is the same and the values reached are also equivalent.
Taking into account such equivalence between the models and the adjustments required to estimate the investment in assets in place4, which is particularly difficult in the case of Eurocash due to the high level of Goodwill, I rather not use this model in this equity valuation project.
2.2.3 Contingent Claim Valuation
This valuation framework was developed with the intention of capturing the value of the options of expand, delay or abandon a project, which are not consider in any other valuation model. (Damodaran, A., 2005) It is a valuation tool used to value flexibility, that is, to value the future possibilities of an investment project (Fernández, P. 2001). However, in the particular case of Eurocash, one might not foresee any major investment decision for the near future, as the FMCG wholesale market is already near concentration limits, and the company is still digesting the integration of Tradis(2011). Furthermore, as pointed by Fernández, option valuation is one of the most technical complex valuation frameworks, as the definition of the option valuation formula (e.g.Black Scholes) is not straightforward and the parameters, namely, volatility, are hardly estimated correctly.
As far as I am concerned, I will not use option valuation to value Eurocash SA, due to its lack of applicability to the specific case of the company in question and to the difficulty of using such a valuation framework correctly.
4 In 2001, Weaver conducted a survey and concluded that the typical EVA calculation involves 19 accounting adjustments on average
22 2.2.4 Relative Valuation - Multiples
Under this method, assets are valued by comparison with the prices at which similar assets are being traded in the market. For instance, an antique dealer will set the prices of its antiques by checking the latest transactions for those types of products. Under the same principle, one might estimate the value of a share by benchmarking with the prices of “similar” stocks. (Damodaran, 2006) It is logical that the precision of the valuation will be directly correlated with the liquidity and efficiency of the market, as there is less room for biases and market errors.
To construct a multiple valuation two steps are required: (1) defining the value drivers (2) and identifying comparable firms (peer group). The performance of the multiples will be, therefore, related to the extent that the value drivers reflect the future success of the company and if the comparable firms bear a resemblance with the firm being valued in terms of the value drivers chosen. (Liu, Nissim and Thomas, 2000)
2.2.4.1 Value Drivers
There are two types of multiples (Suozzo, 2001):
1. Enterprise Multiples: Evaluates the entire business in respect to a value driver that must be related with the entire enterprise as well (Sales, EBIT, EBITDA)
2. Equity Multiples: Evaluates only the claims of the shareholders on the company in respect to a value driver that must be related only with the shareholders’ claims on the assets of the company. (Earnings)
Koller, Goedhart & Wessels (2005a) argued that enterprise multiples are more accurate than equity ones; firstly because they are independent from the capital structure of the company, secondly because earnings, unlike EBITDA or Sales, are affected by non-operating one-time gains and losses, which will cause an artificial impact on P/E ratios and that may not have a clear effect on the value of the company.
Among the enterprise multiples commonly used, Koller et al. express their preference for the one which uses as a value driver forecasted EBITA (Earnings before interests taxes and Acquired Intangibles and Amortizations), since as it is demonstrated by them this multiple is dependent
23 solely on the company’s growth rate, return on invested capital, tax rate and the cost of capital – additionally they stress that the two latest drivers ensure a higher comparability between companies if they are operating in the same domestic market5.
EBITA is preferred over EBITDA, since in most industries depreciation embodies the accounting correspondent of setting aside future capital expenditures to substitute the current assets. Thus, it is necessary to subtract depreciation of the enterprise’s earnings in order to understand its true value.
The reasons to use forward-looking multiples rely on the fact that: they are consistent with the principle that a company’s value derives from future cash flows; and, secondly, usually forecasted fundamentals are normalized, meaning that they do not consider one-time extraordinary events. However, the findings of these authors are not regarded as a “Rosetta stone” in multiple valuation.
Au contraire, Liu et al. (2000) presented a ranking for the best multiples that contradicted those arguments. According to these authors, the most accurate describer of stock prices is forward earnings, which seconded the preference for using forward-looking multiple. Nonetheless, the study proved that earnings based multiples explained better prices than EBITDA. Furthermore, Lie E. and Lie H. (2002) also came to a conclusion that asset multiples and forecasted P/E perform better than EBITDA ones.
Ultimately, the best explanation for this topic is presented by Baker and Ruback (1999) - “The basis
of substitutability that provides the most precise estimate of value varies by industry because the underlying value drivers differ across industries”. 6
2.2.4.2 Comparable Firms
Alford (1992) stressed out that enterprises segmented based on the industry criteria generated a lower valuation error, when using P/E multiple. On the other hand, Damodaran argued that to define the peer group, it should only be taken into account cash flows, growth potential, and risk
5 In the same domestic market companies share similar tax legislation and cost of capital 6
24 associated with the firm, that is to say that industry or sector have no role on the definition of the peer group.
These remarks are partially seconded by Cheng and McNamara (2000), which concluded that a comparable group based on return on equity and other fundamentals, alongside with industry criteria, yields lower valuation errors.
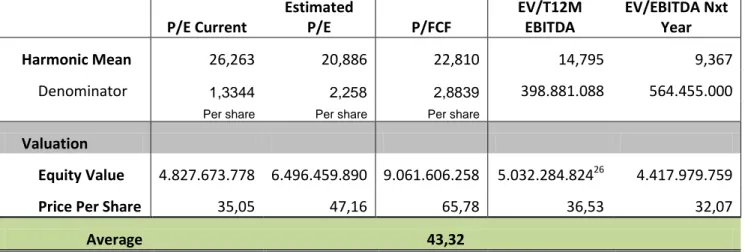
It is clearly understandable that the sources of value come from cash flows, growth potential and the discount rate (risk), therefore the comparable firms should have similar figures for the given value drivers, regardless of the industry in which they operate. Contrariwise, nowadays, analysts use systematically peer groups based on industry; the underlying assumption is that companies operating in the same industry present the same risk, growth and cash flow profile. An additional reason to do so, has to do with lowering search costs and time, since it is much easier to pick business competitors, than to search the whole market for companies with similar fundamentals. As an additional note I would like to stress out that the common and most precise approach to estimate the multiple is to use the harmonic mean of the peer group, as concluded by Baker and Ruback (1999)
2.2.4.3 Opinion on Multiples
Although there are available several researches regarding multiple valuation, there is no consensus between the authors, in which respects the choice of the value drivers and the choice of comparable firms.
As a personal opinion a best approach should encompass a mix of value drivers, which should take into account the business characteristics, but focused on forward and enterprise value multiples; regarding comparable firms the criteria should be, when possible, industry, growth, risk and cash flows. (Koller, Goedhart & Wessels, 2005b).
Multiple valuation is, when performed correctly, a very useful and robust tool, simple to compute, avoiding valuation errors and relevant as it is focus on the main metrics used by investors. A proof of its usefulness was reported in the work of Demirakos, Strong & Walker (2004); they found out that 88,5% of a 104 reports sample used P/E multiples, whereas only 38,5% used a Discounted Cash Flow valuation.
25 On the other hand, it is very simplistic, filtering a large amount of data into a single ratio, neglecting important information concerning value accretion; it is a stationary tool – a “photograph” of a point in time; it is easy to manipulate through accounting figures and it lacks comparability. (Suozzo P, 2001)
As far as I am concerned, this type of valuation reveals to be particularly useful when complemented with other more accurate and precise methods of valuation such as Discounted Cash Flows. But it should not be considered as a standalone valuation model to value an entire enterprise.
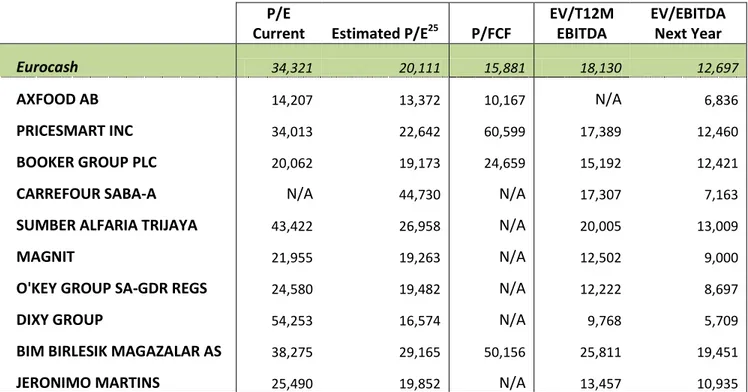
Regarding the specific case of Eurocash SA and applying the literature studied I decided to 1. Multiples Choice:
P/E; P/E (forecasted) – as according to Liu et al. these were the two better performing multiples; EV/EBITDA; & EV/EBITA –according to the findings of Koller et al..
2. Peer Group
The peer group shall be defined based on industry, cash flow, risk and growth profiles. The key point in this topic is that industry should not be seen as, neither a mandatory exclusion criteria, nor as an inclusion one.
2.3 Emerging Markets
As aforementioned the Capital Asset Pricing Model is a powerful tool that has been successfully applied in developed markets. However, this success has not been achieved in most of the emerging markets. Different reasons might be responsible for this, but the most important ones relate with market efficiency and integration, as well as, country risks that are not present in developed markets. (E.g. Expropriation; Political Biases; Economics high volatility, among others) (CR. Harvey, 2001)
Hence, some adjustments have to be made when valuing assets on emerging markets, yet I will not lay down the required adjustments as from my personal opinion and from other authors’
26 Poland is not an emerging market. Below I list a set of reasons why I believe Poland is a developed country with an efficient market:
1. Ranked as a Very High Human Development Country by the UN (0.813 – the IMF minimum benchmark for advanced country is 0.788)
2. 8th largest European economy (By GDP)
3. The Warsaw Stock Exchange (WSE) has 436 listed companies whose capitalization totals to a value of P N 670 billion (approx. € 162 billion). The 20 most valuable companies (WIG 20) have a market capitalization of €70 billion. (P I 20 is worth only €40 billion)
4. Poland is part of European Union and its integration in the European financial system has improved its openness to investors, and, therefore the liquidity and efficiency of the market has also improved.
5. Poland is a democratic country and its judicial system follows a set of laws common to the most developed countries.
2.4 Final Considerations on Valuation Methods
The large set of different approaches towards equity valuation, suggested by different well-known and recognized authors, advocates that this is not a consensual topic. Nevertheless, it is recognized in the literature analyzed that there are best practices and that different methodologies apply best under certain company’ characteristics. Thus, and for the reasons explained previously, I will value the company based on the adjusted present value models proposed by Fernández, Nyborg and Cooper and Damodaran complemented with a multiple valuation. Once again it is important to stress that company valuation is not an objective task, it is rather dependent on the assumptions and considerations made, which I will explain thoroughly.
27
3. Eurocash Group Business Overview
Prior to proceed to Eurocash SA valuation it is utterly important to understand the dynamics of the market in which the company operates, as well as, the underlying forces of the company itself.
3.1. Macroeconomic look: Poland
Eurocash’s business is fully based in Poland; most of its clients and suppliers are Polish and, therefore, the macroeconomic environment of the Polish economy will have a determinant effect on the company’ results and future development. In particular, there are four major factors that affect the Eurocash’s operations:
Economic Development - GDP
Economic growth means that a country’s production is increasing and upon the sale of those products the national income will also increase. Naturally higher levels of production and income will mean higher volume of business, inversely lower levels of GDP will result in a decay of business levels.
Aggregate Income:
Aggregate income figures are very good indicators of future consumer demand, as there are only two options to do with the available income: spend or save. Thus, an increase in the disposable income will lead to higher levels of spending, assuming a constant level of savings to disposable income.
Inflation Rate:
Inflation reflects the rate of change in the general level of prices of goods. It plays a major role on the wholesale market, since it reduces the purchasing power of the consumer (Consumer Price Index) and on the other hand increases the cost of production for the firm (Producer Price Index),
28 and as a consequence it is generally predictable that an increase in the inflation rate will have a negative impact on the wholesale business.7
Demographics:
Poland’s rural migration is still in a somehow early phase in comparison with western European countries (Appendix 2), and most of these rural areas’ economic activity is based on family farms producing small crops according to traditional methods. As a result of this type of agricultural activity the Polish modern consumer is used to organic, fresh and high quality food. Additionally, as it can be seen on appendix 3, polish living quarters are small, which combined with limited monthly budgets, especially in rural areas, molded buying habits towards a frequent, small value and quick shopping (appendix 4). This kind of shopping is preferably done in close-by small shops, and 70% of these kinds of shops are customers of Eurocash.
Year: 2012
Polish consumers face difficulties for the current year, as a result of a stall in employment increase (0.4%) and a slower wage growth (3.8% vs 5.4% in 2011) which combined with a high consumer price index will result in a slower growth rate on disposable income (1.2% vs 3.9% in 2011). Overall, according to BZWBK Macro team, retail sales are expected to grow by only 4.6%, which compares with an 11.0% growth in 2011.8
Food sales are expected to continue growing (app. 3%) as a result of the food consumer price index (3% as well), which means that sales volume will remain unchanged.
The macroeconomics trends forecast a poor year for retailers since the slow increase on disposable income will shift Polish consumers towards a higher price sensitivity behavior, favoring discounters’ format. Moreover, only market leaders will be able to take advantage of scale economies, offering competitive prices and attracting new customers, achieving growth rates above the inflation.
Under this scenario I believe that Eurocash, as a market leader, has the required characteristics to outperform the market in the medium and long term. Below I list the reasons why Eurocash is foreseeable to outperform the market even under such negative macroeconomic trends:
7 Assuming Normal Price Elasticity 8
29 Eurocash has proven that is able to overcome difficult macro trends. It has maintained on a continuous basis a solid Like for Like growth over inflation, which means that, assuming Eurocash’s prices follow CPI, the company is able to attract more customers and increase their spending every year.
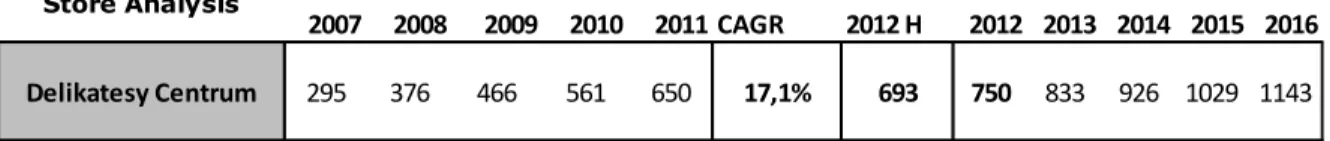
Sound EBITDA growth: Since 2007 it has registered a compound annual growth rate of over 21%, with solid increases every year.
Tradis Acquisition: Eurocash latest acquisition is a proof of Eurocash managers’ confidence on the Polish retail market, even under such a macroeconomic turmoil. This acquisition established Eurocash has the second largest player in the FMCG market, behind Biedronka, and far distant from other competitors. This takeover has given the company the required competitive scale and the base of franchise partners to outperform the wholesale market in the medium and long term. Furthermore, it is foreseeable that Tradis’ franchise chains will increase their penetration rates to levels similar to Eurocash, supporting even further the LfL growth in the forthcoming years.
To conclude, I consider that: the immunity of Eurocash to the latest negative economic trends; the new scale with Tradis takeover; the proven robust skills of Eurocash’s management; alongside with the challenges that its followers face are reasons enough to believe that the company will maintain its second position on the FMCG market unchallenged for the foreseeable future.
3.2 Polish FMCG Market
Fast Moving Consumer Goods comprise food products, non-alcoholic beverages, alcoholic beverages, tobacco products, household chemicals and cosmetics. The value of these products was estimated at PLN 212.3 billion in 2011, by GfK. These goods are sold mainly through retail stores to the final consumer and through wholesale entities to retail stores.
Prior to analyze retail and wholesale channels, it is important to stress out that, although Eurocash is a wholesale trade company its business is intimately dependent on the retail activity. Firstly, sales volume is strictly correlated with the retailers’, as they are its main client; and secondly the prices charged will have to be set in such a way that retailers can be competitive with one another. Thus, Eurocash competition is not only represented by other wholesalers, but also by the retailers that compete with its clients.
30 It should also be noted that the retail and wholesale market is a cyclical business, however since the whole cycle has a duration of exactly one year the historical annual data reflects the whole dimension of the cycles, and no further adjustments have to be made. (Appendix 5)
3.2.1 Retail FMCG Market
The Polish retail market represented in 2010 PLN 593 billion, which represented an increase of 1.7% in comparison with 2009. From these, PLN 156 billion were food and non-alcoholic beverages sales – 2.5% growth vs 2009 – alcoholic beverages and tobacco amounted to 53.8 billion – 3.3% growth vs 2009 – while non-foodstuff goods represented PLN 362.1 billion – a 1,3% growth. The remaining 21.1 billion relate to retail sales in catering establishments.
From 2005 to 2010 the major driver of retail sales growth was the non-foodstuff goods, which increased almost 40% until 2009 stabilizing since then9, on the other hand alcoholic beverages and tobacco and food and non-alcoholic beverages have only grew 7,5 and 5%, respectively, in the same five year time frame.
Retail stores are the primary FMCG product distribution channel, and according to the Polish
Central Statistical Office there were 346.000 retail stores operating in Poland as at the end of 2010, a 7% decrease comparing to 2009. Nevertheless, the sales area as increased to 31 769 thousand m2, this derives from the closure of small shops (sales area inferior to 100 m2) and the opening of larger stores. Even so, stores with a sales of up to 99 m2 constitute 47,2% of the total number of stores, this is a result of the already mentioned preference of Polish consumers for close-by small shops.
9
In constant prices: 2005 = 100
31 3.2.2 Wholesale FMCG Market
Polish Central Statistical Office reported, for 2010, that the value of the wholesale market regarding food products, non-alcoholic beverages, and alcoholic beverages was of PLN 133.7 billion, which represented an overall growth of 3.5%. Note that this does not represent the value of the FMCG wholesale market, since it does not include tobacco products, cosmetics and household chemicals. Food and non-alcoholic beverages sales have increased by 5.8% reaching PLN 108.4 billion; while alcoholic beverages sales have decrease by 5.2 percentages point amounting, in 2010, to PLN 25.3 billion.
The wholesale distribution of FMCG products is targeted principally at the traditional small stores referred before; alternative channels such as kiosks and petrol stations; and specialized food establishments.
This market is characterized by a classic and traditional form of business – e.g. sales with delivery, trade credit. There are also some cash & carry warehouses which offer additional services, characteristic of this traditional form such as deferred payment dates and the delivery of goods. The FMCG wholesale market involves specialized warehouses, whose offers cover only a specific type of products, as well as warehouses offering a wide range of FMCG products. However, given the characteristics and needs of the target clients, the range of products offered and the sales format cannot be considered a distinctive competitive advantage in this market.
The strongest FMCG wholesale entities are: Eurocash Group (19.1%); Makro Cash and Carry Polska S.A. (5.5%); Group Selgros Sp. z o.o. (4.3%); Lekkerland Polska S.A. (3.8%); Ruch S.A. (2.6%10); PHP Polski Tytoń .A.(3.1%); Kolporter ervice .A. (2.8%); Ruch .A. (2.6%).11
10 Estimated
11
32 3.2.3 Competition
Competition in the FMCG wholesale distribution Polish market is based on the supplying of the aforementioned traditional small stores; specialized food stores such as bakeries, meat and fish stores among others; and the alternative channels which comprises the HoReCa segment (Hotels, restaurants and catering), petrol stations and kiosks.
Taking into account the organizational format and sales area, regarding stores, the distribution channels can be segmented as: (a) a modern distribution channel comprising: large format stores (hypermarkets and supermarkets) and discounters; and (b) a traditional distribution channel covering retail locations with a sales area of up to 300 square meters, usually family owned.
The small format stores are the leading format in Poland with 49% of the food retail market share, yet, it was 57% in 2007. The reason behind this decrease in market share is the fast paced growth of discounters – 23% growth p.a12 - which allowed for a 7% increase in market share, reaching an 18% share in 2011.
Be that as it may, the sales per store in the traditional channel are still increasing at a 3% rate per year. The underlying reasons for the decrease in the market share are: the lower increase than the overall market increase; and the decreasing number of stores, mainly because unprofessional and inefficient stores are unable to strive in this increasingly higher competitive market.
Large format stores, on the other hand, have remained stable for the past years increasing one percentage point in market share since 2007, and the latest results from the first semester of 2012 do not suggest any significant changes to this trend. On the contrary, “hypers” might even assist to a decrease in market share as a result of poor like for like growth. (Appendix 6)
12
2007-2011 CAGR
33 The conclusion from the latter paragraph is that the market share of traditional stores is being threatened almost exclusively by discounters, who are being very successful up until now, while large format stores remain stable despite large investments in new openings. It is therefore relevant, under Eurocash valuation perspective, to analyze this competition between discounters and small retail stores and forecast how this will affect the retail market:
1. Despite the registered fast growth, discounters are close to natural saturation limits found in mature FMCG markets such as Germany or Spain – app. 20-25%. Therefore, I estimate a slower growth rate for this store formats on the next years up until reaching saturation limit, when it is predictable a stabilization of the market share. (Appendix 7)
2. Furthermore, non-price factors are getting increasingly more important for Polish consumers, which undermine the largest advantage of discounters – Price. (Appendix 8) 3. Small format stores suit best the modern consumer, since they are more capable to satisfy
their need for quality, range and convenience than discounters. Unreservedly prices must be set on a competitive format, as it is still the major driver for purchases decision making.(Appendix 8)
4. Mergers & Acquisitions and modernization programs along the traditional stores enable those stores to compete in an effective way against large format stores and discounters. A proof of this competitive strategy is the recent association of stores with areas of up to 300 m2 in franchise networks of two types: a traditional one with loyalty programs; and a modern one characterized by binding contracts between retailers and supplies. In fact, according to GfK 19.000 stores were associated through the 20 biggest franchise networks.
Ultimately I find that the traditional format stores are adapting well to this increasingly competitive market, producing the right responses to the discounters’ threat. Hence, I believe that the role played by traditional stores is not expected to decrease; instead it will maintain stable its high importance for the forthcoming years.