This is an open-access artcce istribute un er the terms of the rreatve rommons
Attributon License Fonteh httph//wwwwww scieco br/scieco phpcscript=sci_arttextppi
=S414e-82742046000400087pcng=enpnrm=iso Acesso emh 2 jan 2048
REFERÊNrIA
VINHA, Luís Gustavo o Amarac; KARINO, ramica Akemi; LAROS, Jacob Arie Factors associate wwith
mathematcs performance in Brazician basic e ucaton em matemáttca no ensino fun amentac no
Brasic Psico-USF, Itatba, v 24, n 4, p 87-400, jan /abr 2046 Disponívec emh
<httph//wwwwww scieco br/scieco phpcscript=sci_arttextppi
=S414e-82742046000400087pcng=enpnrm=iso> Acesso emh 2 jan 2048 oih
httph// x oi org/40 4900/414e-82742046240408
Factors Associated with Mathematics Performance in Brazilian Basic Education
Luís Gustavo do Amaral Vinha – Universidade de Brasília, Brasília, Brasil Camila Akemi Karino – Universidade de Brasília, Brasília, Brasil
Jacob Arie Laros – Universidade de Brasília, Brasília, Brasil Abstract
Several studies have indicated that student performance is strongly influenced by school context. Within this frame of reference, the present study sought to identify contextual variables that affect proficiency in mathematics taking the multilevel structure of schools into consideration. The information of 4,338,885 students who participated in the Brazilian national assessment of educational progress of 2009 was used. Multilevel analysis showed an intra-class correlation of .27 and .19 for the 5th grade of elementary school and 9th grade of middle school, the last year of middle school. In both models, more than 50% of school level variance and more than 11% of the variance on student level was explained. The final model is composed of control vari-ables, 13 student level varivari-ables, 9 school level varivari-ables, and random and interaction effects. The results contribute to a better comprehension of factors that affect school performance, which permits the orientation of public policies.
Keywords: educational assessment, school performance, multilevel models
Fatores Associados ao Desempenho em Matemática no Ensino Fundamental no Brasil Resumo
Vários estudos têm apontado que o aprendizado do aluno é fortemente influenciado pelo contexto escolar. Dessa forma, este estudo teve como objetivo identificar variáveis contextuais que interferem no desempenho em matemática, considerando a estrutura multinível da conjuntura escolar. Utilizaram-se informações de 4.338.885 alunos avaliados na Prova Brasil de 2009. A análise multinível mostrou uma correlação intraclasse de 0,27 e 0,19, para o 5° e 9° ano do ensino fundamental, respectivamente. No modelo final do 5° e 9° ano, mais de 50% da variância no nível da escola e mais de 11% da variância no nível do aluno foram explicadas. Esse modelo foi composto por variáveis de controle, 13 variáveis do nível do aluno, 9 do nível da escola, efeitos randômicos e efeitos de interação. Os resultados corroboram estudos anteriores e contribuem com o entendimento dos fatores que influenciam o desempenho, o que permite direcionar políticas públicas.
Palavras-chave: avaliação educacional, desempenho escolar, modelagem multinível
Factores Asociados al Desempeño de Matemáticas en la Enseñanza Primaria en Brasil Resumen
Diversos estudios señalan que el aprendizaje del alumno está fuertemente influenciado por el contexto escolar. De esta forma, la presente investigación tuvo como objetivo identificar variables contextuales que interfieren en el desempeño de matemáticas, teniendo en cuenta la estructura de varios niveles del entorno escolar. Se utilizó la información de 4.338.885 alumnos evaluados en la Prueba Brasil de 2009. El análisis de varios niveles mostró una correlación intraclase de 0,27 y 0,19 para el 5º y 9º año de enseñanza primaria, respectivamente. En el modelo final de 5º y 9º año, más del 50% de la variancia a nivel de escuela y más de 11% de variancia a nivel de alumno fue explicada. El modelo fue compuesto por variables de control, 13 variables del nivel del alumno, 9 del nivel de la escuela, efectos aleatorios y efectos de interacción. Los resultados corroboran estudios anteriores y contribuyen a la compresión de los factores que influyen en el desempeño, lo que permite direccionar las políticas públicas. Palabras clave: evaluación educacional, desempeño escolar, modelo de varios niveles
Education in Brazil has evolved significantly over the last few decades. Specifically, progress has been made in universalizing education. The United Nations Organization for Education, Science and Culture (UNESCO) reports that there has been an increase in education access and reduction of illiteracy rates (UNESCO, 2014). Despite this progress, however, education in Brazil still faces considerable challenges. Brazil still ranks amongst the lowest in international school performance indexes (OECD, 2013) and school performance varies greatly within the country (Laros, Marciano, & Andrade, 2012).
The current national situation demands education improvement actions and in order for them to become effective, education policies should be supported by academic research results. Large-scale educational assessments are therefore critical for identifying good practices, schools in need of intervention, and factors affecting the learning process.
External assessments were created in Brazil to gather information about performance and results of the educational system (Pestana, 1999). The main objective of the first Brazilian basic education evalua-tion system (SAEB — Sistema de Avaliação da Educação
Básica) was to subsidize the monitoring of public
poli-cies aiming the universalization of education access and the improvement of quality, equity, and efficiency in education (Inep, 2007). SAEB currently monitors for-mal education from the 3rd grade of elementary school to the 3rd year of high school through performance assessment tests and contextual questionnaires.
Several educational studies suggest that contextual factors impact the learning process sig-nificantly (Alves & Soares, 2007; Carvallo-Pontón, 2010; Fletcher, 1998; Reynolds, Sammons, Fraine, Townsend, & Damme, 2011; Rutter & Maughan, 2002). Soares (2005) points out that these factors can be divided into three basic categories: school struc-ture, family, and students. Thus, it is considered critical that these assessments cover information other than academic achievement, such as the students’ personal and family characteristics, and the context where learning takes place.
Quantitative studies analyzing educational assess-ment data usually employ hierarchical linear models. Hierarchical models, also known as a multilevel regres-sion analysis, should be used whenever data are collected from individuals belonging to groups or contexts. Lee (2008) and Hox (2010) highlight that in addition to being more appropriate, this approach is also more useful for studying contextual effects, especially in the educational setting.
Students belonging to the same class or school share experiences, have the same teachers, use the same materials and equipment and usually live in the same neighborhood. In addition, schools in the same system employ similar methodologies, have teachers with similar profiles, similar structures, and so on. Requiring the regression coefficients to be the same in all schools would be too restrictive in academic achievement studies (De Leeuw & Meijer, 2008). Mul-tilevel models make it possible to analyze variable relationships within each school, allowing variation of regression coefficients among schools and the study of cross-level variable interactions.
These models present certain advantages, which are absent from models that do not consider indi-viduals nested within groups. The use of multilevel models provides correct standard errors, thus allowing for accurate confidence intervals and hypothesis tests (Goldstein, 2010). By utilizing these models, inter- and intra-school variability can be broken down; conse-quently, the school’s impact on student proficiency can be assessed.
Over the last few decades, several papers have been published utilizing data from large-scale edu-cational assessments in Brazil, many of which have used SAEB data. These studies indicate that Brazilian schools are responsible for about 30% of the variation in student scores (Laros et al., 2012; Laros, Marciano & Andrade, 2010; Andrade & Laros, 2007; Jesus & Laros, 2004). This percentage is called the “school effect”. However, the raw school effect still needs to be cor-rected for socioeconomic composition of the schools (Fletcher, 1998). Fletcher argues that without this cor-rection, variance related to students and their families would be wrongfully attributed to the school (Laros et al., 2012). After considering socioeconomic character-istics, Brazilian schools would then be responsible for about 15% of the variability in student performance, demonstrating that schools still affect student perfor-mance to a considerable degree.
Research results on performance-related factors show that students of higher socioeconomic status, and regular school history, and male gender perform better in mathematics (Soares, César, & Mambrini, 2001; Soares & Alves, 2003; Franco et al., 2007; Oliveira, Belluzzo, & Pazello, 2013). Private school students perform bet-ter when compared to public school students (Soares et al., 2001; Oliveira et al., 2013). After controlling for the student’s socioeconomic level, school-specific variables as infrastructure and equipment are good predictors of academic performance (Barbosa & Fernandes, 2001; Andrade & Laros, 2007; Franco et al., 2007; Gonçalves & França, 2008; Oliveira et al., 2013).
Several studies show that school socioeconomic status and parents’ education level are the control vari-ables most related to school performance (Jesus & Laros, 2004; Andrade & Laros, 2007; Laros, Marciano e Andrade, 2012). Some student-related variables that affect academic performance are: students not ‘on track’, students who work, parent support, and the habit of doing homework (Jesus & Laros, 2004; Andrade & Laros, 2007). School-level variables that affect per-formance are: technical and pedagogical resources, teachers assigning homework, school infrastructure, teacher commitment, teachers setting high expectations for students, students motivated by their parents, and students who work (Jesus & Laros, 2004).
Most studies use assessment data of students in 9th grade, the last year of middle school, and in 3rd year of high school. Despite data availability, there are fewer studies using SAEB data focusing on the performance of Grade 5 elementary school students.
Examples include Alves (2008) and Ferrão, Beltrão and Santos (2002). The lack of studies utilizing Grade 5 data and the lack of comparative analyses between school grades motivated the choice of the population of the present study.
Sammons, Hillman and Mortimore (1995) con-ducted a literature review on school efficiency in the United Kingdom, United States, and the Netherlands and pointed out several student value-adding character-istics, such as: principal’s leadership, clear objectives in classroom practices, emphasis on teaching and learn-ing, high quality learning environment, shared vision and goals, positive reinforcement and high expectations of the teachers, monitoring progress, and home-school partnerships. Many of these factors are similar to fac-tors that have been studied in the Brazilian context. However, Brazilian research is generally limited by the information collected in large-scale assessments.
Although research has progressed, Konstanto-poulos (2006) suggests that the results of the studies are still inconclusive. In Brazilian studies, there is no consensus on which student and school factors are related to efficient schools. The only consensus that has been reached so far is the need for controlling for socioeconomic context to better assess the school’s effect. A larger number of studies is needed to obtain more reliable and valid evidence on school efficiency.
The goal of analyzing the school context is to identify factors that allow defining improvement actions. Taking into account the importance of con-textual factors and the hierarchical structure of the school system, this study aimed to identify the vari-ables that interfere on the performance in mathematics of Grade 5 and Grade 9 students with a multilevel hierarchical analysis.
Method
Participants
The Brazilian national assessment of educational progress databases of 2009 (ANRESC – Avaliação Nacional do Rendimento Escolar) is administered by Inep.
ANRESC is an external assessment developed in 2005 with a census evaluation technique to determine aca-demic achievement in all public Elementary Schools of Brazil with at least 20 students. This assessment is applied to all state, municipal, and federal public schools both in rural and urban areas. The reference population of ANRESC corresponds to Grade 5 and Grade 9 students. This assessment measures academic
achievement in mathematics and reading, in addition to school and contextual variables.
The population of participants in the present study consisted of Grade 5 and Grade 9 students who took the mathematics test, which corresponds to 2,431,333 students from 35,799 schools and 1,907,552 students from 31,994 schools, respectively. On average, Grade 5 schools had 71.0 students (SD = 52.0) and Grade 9
schools had 59.2 students (SD = 44.1). The average age
of Grade 5 grade students was 10.8 years old, 49.1% of these students were male, 90.4% studied in urban areas, and 71.2% attended the municipal school system. Grade 9 students had a mean age of 15.4 years old, 45.6% of these students were male, 92.2% studied in urban areas, and 63.4% attended the state school system. The geographic distribution of participating students was as follows: 42% were from the Southeast; 26% from the Northeast; 15% from the South; 10% from the North; and 7% from the Central-West.
Instruments
All instruments used in this study were developed by Inep for the 2009 Brazilian national assessment of educational progress, as follows:
– Mathematics test: Cognitive test to assess
stu-dent performance in mathematics consisting of 77 multiple-choice items divided into 7 blocks with 11 items, each student answering a test book-let with 2 blocks. The allocation of the items into blocks is made in such way that there is always a block of items connecting the test booklets. This allows placing all items on the same scale using item response theory, so that the scores of the dif-ferent test booklets became comparable.
– Student, teacher, principal, and school con-textual questionnaires. At the student level,
the questions are related to family characteris-tics and social, economic, and cultural aspects. At school level, the questionnaires focus on teachers and principals qualification; pedagogic practices; resources and school infrastructure. The complete questionnaires can be accessed, in Portuguese, on the following website: http:// portal.inep.gov.br/web/prova-brasil-e-saeb/ questionarios-socioeconomicos.
– School infrastructure indicator. This tool was
developed by Soares Neto, de Jesus, Karino and Andrade (2013) to measure the level of Brazilian
school infrastructure. The indicator was developed based on the Brazilian basic education census, administered by Inep.
Data Analysis
Multilevel analysis was applied using variables and factors extracted from the contextual question-naires. Factors were chosen based on factor analysis realized by Karino, Vinha and Laros (2015) using Grade 9 questionnaires. In the present study, the same criteria were used to identify factors from Grade 5 data. Table 1 shows a description of variables and fac-tors used.
After defining the factors, missing data were replaced using linear trend at point method, according to the participants’ other answers within each factor. After the imputation, student scores were calculated for each factor. The remaining variables were treated dif-ferently: participants with missing data were excluded from the analysis.
MLwiN 2.30, developed by Goldstein et al. (1998), was used for multilevel regression analysis with student performance in mathematics as the dependent variable. The model was defined using the method proposed by Hox (2010), in a five-step procedure:
1. Model with no explanatory variables — Null model. This model is used to compare subsequent models and to calculate intra-class correlation. 2. Introduction of the lower-level (student)
explana-tory variables fixed effects.
3. Introduction of the higher-level (school) explana-tory variables.
4. Level 1 explanatory variable inclination coefficients that possess a significant inter-school variance component are verified (random effects).
5. Cross-level interactions effects, i.e.: school-level and student-level explanatory variable relations are assessed.
In addition, as pointed out by studies utilizing multilevel analysis in the educational context (Fletcher, 1998; Soares, 2004), socioeconomic level-related char-acteristics and parental education level were controlled. For this reason, a stage was added between steps 1 and 2 suggested by Hox (2010) to include control variables. Finally, a standardized variable was only included if the estimated regression coefficient was greater than
1. Standardized variables were chosen because variables in different scales make it more difficult to determine coefficient relative importance (Fletcher, 1998). The criterion standardized regression coefficient greater than 1 was used because statistical significance tests (χ2
test and t ratio) with large samples usually yield
signifi-cant effects, even if the observed impact is very small.
Results and Discussion
The null model (Model 0), with no explanatory variables, was used as a benchmark to compare sub-sequent models. It is worth to highlight the observed intercept values (197.9 and 239.4), which represent the average proficiency in mathematics for Grade 5 and Grade 9 students (Table 2).
Another important value calculated by the null model is the intra-class correlation coefficient (ICC). This coefficient may vary from 0 to 1 and it indicates the need for using a multilevel analysis. A value close to 0 indicates that schools are homogeneous and that students’ performance does not correlate to the school in which the student is enrolled (Ferrão, 2003). On the other hand, in the presence of a non-trivial value (greater than 10%), a multilevel method should be con-sidered (Lee, 2008).
As shown in Table 2, in this study the intra-class correlation coefficients were .27 and .19 for Grade 5 and Grade 9, respectively. This means that 27% and 19% of the Grade 5 and Grade 9 student performance variance is related to the school level, which justifies using the multilevel method.
Lastly, the deviance estimates of 24,992,424.6 and 19,662,922.5 were found for the null models. Deviance calculation estimates the lack of model adjustment and should be compared to subsequent models (Hox, 2010). With the addition of explanatory variables, model adjustment is expected to improve and as a result the deviance will decrease. In the comparison of models, the model with lower deviance will be considered the best one (Kreft & De Leeuw, 1998).
In the following step, control variables were introduced (Model 1). Mother’s education and SES were
originally considered as control variables, both in stu-dent and school levels (aggregate variables). However, aggregated mother’s education showed negative effects in
the model of Grade 9. This might be a result of multi-colinearity, since there was a strong correlation between aggregated mother’s education and SES. Aggregated mother’s education was positively related to proficiency in
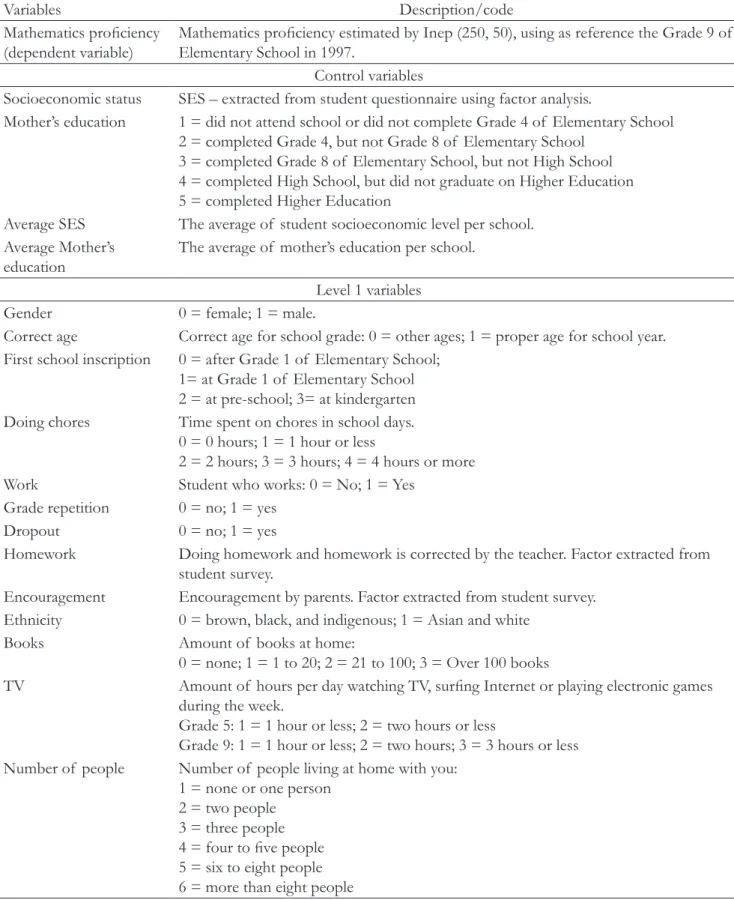
Table 1
Variables
Variables Description/code
Mathematics proficiency
(dependent variable) Mathematics proficiency estimated by Inep (250, 50), using as reference the Grade 9 of Elementary School in 1997. Control variables
Socioeconomic status SES – extracted from student questionnaire using factor analysis.
Mother’s education 1 = did not attend school or did not complete Grade 4 of Elementary School 2 = completed Grade 4, but not Grade 8 of Elementary School
3 = completed Grade 8 of Elementary School, but not High School 4 = completed High School, but did not graduate on Higher Education 5 = completed Higher Education
Average SES The average of student socioeconomic level per school. Average Mother’s
education The average of mother’s education per school. Level 1 variables
Gender 0 = female; 1 = male.
Correct age Correct age for school grade: 0 = other ages; 1 = proper age for school year. First school inscription 0 = after Grade 1 of Elementary School;
1= at Grade 1 of Elementary School 2 = at pre-school; 3= at kindergarten Doing chores Time spent on chores in school days.
0 = 0 hours; 1 = 1 hour or less
2 = 2 hours; 3 = 3 hours; 4 = 4 hours or more Work Student who works: 0 = No; 1 = Yes
Grade repetition 0 = no; 1 = yes Dropout 0 = no; 1 = yes
Homework Doing homework and homework is corrected by the teacher. Factor extracted from student survey.
Encouragement Encouragement by parents. Factor extracted from student survey. Ethnicity 0 = brown, black, and indigenous; 1 = Asian and white
Books Amount of books at home:
0 = none; 1 = 1 to 20; 2 = 21 to 100; 3 = Over 100 books
TV Amount of hours per day watching TV, surfing Internet or playing electronic games during the week.
Grade 5: 1 = 1 hour or less; 2 = two hours or less
Grade 9: 1 = 1 hour or less; 2 = two hours; 3 = 3 hours or less Number of people Number of people living at home with you:
1 = none or one person 2 = two people
3 = three people 4 = four to five people 5 = six to eight people 6 = more than eight people
Level 2 variables
Equipment State of conservation of equipment of the school; factor extracted from school survey.
Depredation Assesses the school’s depredation level; factor extracted from school survey. Security Assesses the school’s security level; factor extracted from school survey. Dropout rate Percentage of dropout per school.
Shortage of teachers Assess if lack of teachers is a problem. 0 = no; 1 = yes, but no severe problem 2 = yes, and it is a severe problem
Pedagogical practices Assesses strategies employed by teachers in classroom practice; factor extracted from teacher survey.
Pedagogical equipment Assesses equipment employed by teachers in classroom practice; factor extracted from teacher survey.
Number of students Number of participating students, per school, in the 2009 Brazilian national assessment of educational progress.
School infrastructure Assesses school infrastructure from Brazilian basic education census data (Soares Neto, de Jesus, Karino, & Andrade, 2013).
Table 1
Variables (Continuation)
Table 2
Null Model and Control Variables Model for Grade 5 and Grade 9
Model 0 Model 1
Grade 5 Grade 9 Grade 5 Grade 9 Fixed effect Effect SE Effect SE Effect SE Effect SE
Intercept 197.9 .12 239.4 .12 202.7 .10 242.4 .09 Control variables Average SES 13.79 .09 9.30 .09 SES 2.65 .03 3.40 .04 Mother’s education 3.97 .03 4.41 .03 Random effects Level 1 variance 1619.7 1.48 1692.3 1.748 1599.8 1.52 1661.1 1.719 Level 2 variance 610.8 4.44 384.7 3.387 324.3 2.52 216.9 2.056 ICC .27 .19 .17 .12 Deviance 24,992,424.6 19,662,922.5 23,263,543.5 19,532,590.9 Number of parameters 3 3 6 6 Deviance difference: M1– M0 1,728,881.1 130,331.6 Number of parameters: M1– M0 3 3 Chi-square test 576,293.7 43,443.9 Explained variance Level 1 – Student 1.2% 1.8% Level 2 – School 46.9% 43.6%
mathematics when separately analyzed. This variable was removed from the analysis, as its effect was nega-tive for Grade 9 and it became neganega-tive for Grade 5 when other variables were added.
Table 2 shows Model 1 results. In general, students with higher socioeconomic status and students whose mothers have more formal education usually showed better performance. Aggregated SES showed higher
coefficients than not-aggregated SES, the observed
impact was 13.79 and 9.30 points on student perfor-mance for Grade 5 and Grade 9 models, respectively. Therefore, in order to predict the school’s average per-formance, the average of students’ socioeconomic level is more important than their individual socioeconomic level (Soares, 2004). These results are in line with previ-ous studies (Soares & Alves, 2003; Soares, 2004; Jesus & Laros, 2004; Andrade & Laros, 2007; Laros, Marciano & Andrade, 2010). These studies highlight the impor-tance of including control variables to avoid attributing to schools an effect that comes from the economic and cultural capital of the families.
Control variables contribute significantly to the model adjustment, statistics presented extremely high values (576,293.7 and 43,443.9) (Table 2). Adopting alpha = 5%, the improvement can be considered statis-tically significant. However, this test is very sensitive to high number of observations. Due to that, it will not be taken into account in the next steps.
Control variables explained about 1.2% and 1.8% of level 1 (student level) variance of the analyzed data. For the school level (level 2), 46.9% and 43.6% vari-ance was explained by the models. Percentages related to school level reinforce how economic and cultural family-related capital (SES level and mother’s education)
affects student performance.
However, the explained variance at school level is lower in the present study than in other research papers. Jesus and Laros (2004) show that 79% of school level variance is explained by SES level, parents’ formal edu-cation level, and ethnicity; Laros, Marciano and Andrade (2010) show that 77.4% of school level variability is explained by control variables (SES level, mother’s edu-cation, and ethnicity); Laros, Marciano and Andrade (2012) show that SES level, mother’s education, and ethnicity used as control variables are responsible for 74.6% of school level variance. The lower percentage of explained variance is related to the fact that schools in this study are more homogeneous. In previous stud-ies, the SAEB database was used, which contained a sample of private and public schools. The present study
used data from the Brazilian national assessment of educational progress (Prova Brasil), which only uses data
of public schools. Table 2 also shows a corrected ICC of .17 and .12, indicating that the amount of variance in mathematics performance attributed to the school is still significant - even after adding control variables.
In the next step, variables of student level were added to the model (Model 2). Student level effects were estimated first, due to a higher number of observations (Hox, 2010). Subsequently, school level variables were introduced (Model 3). Models 2 and 3 are presented in Table 3.
The following variables showed an effect (regres-sion coefficient) greater than 1 for Grade 5 data: gender, correct age, first school inscription, chores, work, grade repetition, homework, encouragement, books, TV and number of people.
The dropout presented a coefficient lower than 1, but
was kept in the model because it showed significant a random effect in Model 4.
For Grade 9 students, variables that presented an effect greater than 1 were: gender, corrected age, first school inscription, grade repetition, homework, encouragement, eth-nicity, books, TV and number of people. In this case, the dropout variable was not taken into account due to its
positive coefficient in the model, possibly as a result of multicollinearity.
Variables related to school career in Model 2 (Table 3) should be highlighted. Grade repetition showed
a negative effect on school performance. If a Grade 5 or Grade 9 student had previously failed a school grade, their mathematics scores reduced on average 5.99 and 5.53 points, respectively. The first school inscription and cor-rect age presented positive effects (3.05 and 2.35 points
for the Grade 5 and 4.54 and 1.00 points for the Grade 9). Similar results have been shown by other research-ers. Albernaz, Ferreira and Franco (2002) have also observed how failing a school grade presents negative impact; Laros and Andrade (2007) and Ferrão, Beltrão and Santos (2002) also point out how grade repetition can negatively influence student performance. Grade repetition is the opposite of the correct age variable used
in this study. The correct age variable was chosen due to
an initial descriptive analysis pointing out that students placed ahead or before their actual school grade usually presented lower average scores in mathematics.
Male students tend to have higher average scores in mathematics, especially Grade 9 students with a 5.70 coefficient. Similar results are demonstrated by Barbosa and Fernandes (2001) and Albernaz et al. (2002). Homework also influences performance in
Table 3
Explanatory Variables Models for Grade 5 and Grade 9
Model 2 Model 3
Grade 5 Grade 9 Grade 5 Grade 9
Fixed effect Effect SE Effect SE Effect SE Effect SE
Intercept 204.1 .09 242.6 .09 204.1 .12 241.7 .12 Control variables Average SES 9.98 .09 7.89 .09 6.32 .15 6.75 .15 SES 1.73 .05 1.33 .05 1.61 .06 1.28 .06 Mother’s education 1.78 .04 2.31 .04 1.78 .05 2.32 .05 Student-level variables Gender 1.84 .04 5.70 .04 1.73 .05 5.53 .04 Correct age 2.35 .04 4.54 .04 2.26 .05 4.69 .05
First school inscription 3.05 .04 1.00 .04 3.02 .05 1.00 .04
Doing chores -4.29 .04 -.57 .03 -4.36 .05 -.62 .04 Work -3.13 .04 -.92 .04 -3.09 .05 -.89 .04 Grade repetition -5.99 .04 -5.53 .04 -5.93 .05 -5.40 .05 Dropout -.98 .04 -.86 .05 Homework 4.23 .04 5.88 .04 4.14 .05 5.40 .04 Encouragement 1.49 .04 -1.88 .03 1.51 .05 -1.85 .04 Ethnicity .49 .04 1.91 .04 .45 .05 1.94 .04 Books 1.00 .04 1.95 .04 1.00 .05 1.98 .04 TV 1.87 .04 3.90 .04 1.78 .05 3.97 .04 Number of people -3.26 .04 -2.72 .03 -3.12 .05 -2.74 .04 School-level variables Equipment 2.01 .15 .23 .13 Depredation -1.75 .11 -1.84 .11 Security -2.03 .11 -1.44 .11 Dropout rate -3.65 .10 -.89 .10 Shortage of teachers 1.35 .11 1.14 .11 Pedagogical equipment 1.39 .15 .64 .10 Pedagogical practices 1.49 .09 Number of students -1.40 .15 -2.33 .14 School infrastructure .72 .13 2.44 .12 Random effect Level 1 variance 1432.7 1.84 1490.8 1.78 1437.7 2.35 1497.2 2.21 Level 2 variance 254.5 2.22 192.8 1.89 211.5 2.44 182.5 2.21 ICC .15 .11 .13 .11 Explained variance Level 1 – Student 11.5% (10.4%) 11.9% (10.3%) 11.2% (10.1%) 11.5% (9.9%) Level 2 – School 58.3% (21.5%) 49.9% (11.1%) 65.4% (34.8%) 52.6% (15.9%)
mathematics, since a 4.43 and 5.88 effect was observed for the grades analyzed.
Lastly, students who spent more time watch-ing TV, surfwatch-ing Internet, or playwatch-ing electronic games presented superior performance. This was one of the highest effects observed. Coefficients for Grade 5 and Grade 9 models were 1.87 and 3.90, respectively. It is worth pointing out that this variable could not be accurately interpreted. The question is related to hours spend on TV, Internet, and electronic games jointly. However, the positive effect could be related to the information provided by TV and Internet that are useful to learning process.
When comparing the results of the two models, the ethnicity effect is shown to be higher among Grade
9 students, doing chores and work have higher impact on
Grade 5 students’ performance, and encouragement was
shown to be positive for Grade 5 and negative for Grade 9. Ethnicity having a greater effect on Grade 9 model is
quite peculiar. This fact may be related to other effects studied in psychology, such as discrimination and self-fulfilling prophecies, which are strongly influenced by contextual factors. Doing chores probably impacts Grade
5 students greatly because it is less common for chil-dren to do chores at that age. A negative effect of the
encouragement was also observed by Laros, Marciano and
Andrade (2010). According to these authors, the nega-tive effect does not mean that encouragement will reduce
student scores. It is most likely that bad performance be the cause of greater parent encouragement and demand on older students.
Model 2 explains 11.5% of level 1 variance and 58.3% of level 2 variance for Grade 5 students: for Grade 9 students the percentages are 11.9% and 49.9%. These values are shown in brackets in the tables. When the model with control variables is considered, 10.4% and 10.3% of level 1 variance and 21.5% and 11.1% of level 2 variance were explained.
The following step consisted of the introduc-tion of level 2 (school) variables. Variables presenting a higher than 1 effect for Grade 5 data were: equipment, depredation, security, dropout rate, shortage of teachers, peda-gogical equipment, pedagogic practices, and number of students.
For Grade 9 data: depredation, security, shortage of teachers, number of students, and school infrastructure. It was not
pos-sible to obtain a factor related to pedagogical equipment
from Grade 9 questionnaire, thus it was not considered in this model.
At the school level, dropout rate showed greater
effect in Grade 5 model, with a -3.65 point coefficient.
Grade 9 students were more impacted by infrastructure (2.44) and the number of students in the school (-2.33).
In Model 3, variables related to school equip-ment also impacted the performance of the Grade 5 students. Equipment and pedagogical equipment presented
effects of 2.01 and 1.39 points on the performance.
Similar positive impacts were also observed in the research conducted by Andrade and Laros (2007) and Jesus and Laros (2004). Variables concerning security and depredation presented negative impact for both models, which indicates that students perform worse in schools with bad installations and where they feel less safe.
With the addition of level 2 variables, 65.4% and 52.6% of level 2 variance was explained in Grade 5 and Grade 9 models, respectively. Comparing to the control variables model (Model 1), 34.8% and 15.9% of level 2 variance were explained.
In the next step, random effects of student level variables were verified in order to analyze if the vari-ables behave differently between schools (Model 4). This study only considered random effects for variables closely related to school context in which the school could have a more active influence. School policies, for instance, may interfere reducing the repetition negative effect, yielding interpretable random effects. Thus, the random effect was not tested for the following level 1 variables: gender, ethnicity, books, TV and number of people.
The random effect was considered significant when the relative effect (square root of the variance over the fixed effect) was greater than .40.
Table 4 shows that the grade repetition and correct age
presented the highest random effects, 14.54 and 6.75 for Grade 5 and 12.63 and 3.90 for Grade 9. These level 1 variables had considerably different impacts between schools. Laros et al. (2010) and Jesus and Laros (2004) also highlight the random effect of school delay.
The cross-level interaction effects were veri-fied in the last step (Model 5 – Table 5). Interaction effects greater than .40 were taken into account. Three interaction effects were verified from Grade 5 data: first school inscription and equipment; grade repeti-tion and equipment; homework and equipment. Equipment
interacts positively with first school inscription and home-work. Therefore, the better the school equipment is,
the stronger the positive impact of first school inscription
and homework on the performance. The negative
inter-action between grade repetition and equipment indicates
the difference in performance between students who have failed a school year and students who have not
Table 4
Model with Random Effects for Grade 5 and Grade 9
Grade 5 Grade 9
Fixed
effect SE Random effect SE Fixed effect SE Random effect SE
Intercept 203.4 .12 241.3 .12 Control variables Average SES 5.91 .15 6.28 .15 SES 1.54 .06 1.23 .06 Mother’s education 1.78 .05 2.33 .05 Student-level variables Gender 1.80 .05 5.56 .04 Correct age 2.16 .06 6.75 .55 4.50 .05 3.90 .47
First school inscription 2.97 .05 3.19 .42 1.00 .05 1.33 .31
Doing chores -4.24 .05 3.99 .42 -.62 .04 1.21 .30 Work -3.07 .05 3.66 .43 -.89 .05 2.24 .33 Grade repetition -5.98 .06 14.54 .66 -5.48 .06 12.63 .57 Dropout -.93 .05 1.97 .41 Homework 4.12 .05 5.92 .04 Encouragement 1.54 .05 -1.83 .04 Ethnicity .42 .05 1.90 .04 Books 1.02 .05 1.99 .04 TV 1.76 .05 3.99 .04 Number of people -3.10 .05 -2.73 .04 School-level variables Equipment 2.00 .15 .10 .13 Depredation -1.59 .10 -1.58 .11 Security -1.78 .11 -1.26 .11 Dropout rate -3.44 .10 -.68 .10 Shortage of teachers 1.27 .11 1.10 .11 Pedagogical equipment 1.27 .11 .51 .10 Pedagogical practices 1.41 .09 Number of students -1.74 .14 -2.58 .14 School infrastructure .80 .13 2.47 .12 Random effect Level 1 variance 208.4 2.42 181.7 2.26 Level 2 variance 1405.9 2.44 1479.8 2.26 ICC .13 .11
is greater when their schools possess good equipment for pedagogic practices.
Interaction effects for Grade 9 student per-formance are: grade repetition and equipment; work and
number of students; homework and equipment; homework
and number of students. Interaction effects observed in
this model also show that student variables’ impact is heightened by the school’s characteristics: failing
Table 5
Model with Random and Interactions Effects for Grade 5 and Grade 9
Grade 5 Grade 9
Fixed
effect SE Random effect SE Fixed effect SE Random effect SE
Intercept 203.4 .12 241.4 .12 Control variables Average SES 5.90 .15 6.25 .14 SES 1.51 .06 1.22 .05 Mother’s education 1.77 .05 2.33 .04 Student-level variables Gender 1.80 .05 5.55 .04 Correct age 2.09 .06 6.84 .55 4.49 .05 4.01 .47
First school inscription 3.04 .05 2.89 .41 1.00 .05 1.33 .32
Doing chores -4.27 .05 3.89 .42 -.63 .04 1.19 .30 Work -3.10 .05 3.60 .43 -.93 .05 2.07 .33 Grade repetition -6.24 .06 13.26 .65 -5.61 .06 12.25 .57 Dropout -.95 .05 1.87 .41 Homework 4.18 .05 5.86 .04 Encouragement 1.57 .05 -1.80 .04 Ethnicity .40 .05 1.89 .04 Books 1.00 .05 1.99 .04 TV 1.76 .05 3.98 .04 Number of people -3.09 .05 -2.73 .04 School-level variables Equipment 2.49 .15 .13 .13 Depredation -1.59 .10 -1.58 .11 Security -1.76 .11 -1.26 .11 Dropout rate -3.49 .10 -.71 .10 Shortage of teachers 1.26 .11 1.10 .11 Pedagogical equipment 1.30 .11 .50 .10 Pedagogical practices 1.42 .09 Number of students -1.68 .14 -2.67 .14 School infrastructure .87 .13 2.45 .12 Random effect Level 1 variance 207.7 2.42 181.8 2.26 Level 2 variance 1405.1 2.44 1479.3 2.26 Interaction effects
First school inscription x
equipment .51 .05
Grade repetition x equipment -1.25 .05
Grade repetition x equipment -.67 .05
Work x n. of students -.45 .05
Homework x equipment .84 .05 .45 .05
Homework x n. of students .45 .05
a school year had greater negative impact in schools with better equipment; being a student who works was more detrimental to performance in schools with a higher number of students; and doing homework had higher positive effects in schools with good equip-ment and more students.
There have been few studies evaluating the effects of cross-level interaction, and none of them support the results found in this study. Laros et al. (2010) found interaction effects between an aggregated grade rep-etition and school delay, and between an aggregated cultural resources and school delay. Soares (2004) pres-ents some interaction results among variables related to teachers and schools concerning equity issues. The author shows that schools and teachers with better char-acteristics increase differences between groups such as gender and ethnicity, socioeconomic level and school delay (high performance students take more advantage of school improvements, increasing inequality).
This paper chose to analyze few interaction effects, emphasizing school variables that can generate important information to guide improvement actions. School composition variables cannot be changed by school administration, thus interaction effects related to student profile were not taken into account.
Conclusion
The results of the present study complement the Brazilian research on educational assessment. One of the greatest benefits of this study is the possibility of identifying variables with different effects on Grade 5 and Grade 9. This comparison was hindered in previ-ous studies because different criteria and variables were employed. Additionally, databases chosen in previous studies contained samples of reference population, with thousands of students. This study used a census database with information on millions of students, which required analysis process adjustments.
The results reinforce the influence of some level 1 variables on school performance, such as grade repetition, correct age, and homework (Albernaz, Ferreira & Franco,
2002; Laros & Jesus, 2004; Laros & Andrade, 2007). On the other hand, results point out that other variables are also relevant, such as number of people living at home and watching TV.
At level 2 the variable effects are less consistent between Grade 5 and Grade 9. Grade 5 variables that presented higher effects were equipment, security, and dropout rate; Grade 9 variables that presented higher
effects were number of students and school infrastructure.
These results indicate that specific studies need to be conducted for each educational level, to better under-stand the influence of school variables.
Additionally, this research contributed to the advance of random and interaction effects analysis. These effects bring more complexity into the model, and few current studies have endeavored similar analy-sis. In this sense, this research is a pioneer study.
Our objective was to assess school effects focus-ing on performance in mathematics. Therefore, we suggest that future studies accomplish comparative analysis between school grades, using language as a dependent variable. Some school characteristics are expected to impact certain knowledge areas more than others, generating different results. Lastly, we expect to have contributed to supporting public interventions and policies that could improve Brazil-ian education.
References
Albernaz, A., Ferreira, F. H. G., & Franco, C. (2002).
Qualidade e equidade na educação fundamental brasilei-ra. Texto para discussão no. 455. Rio de Janeiro:
PUC-Rio.
Alves, F. (2008). Qualidade na educação fundamental pública nas capitais brasileiras: Tendências, con-textos e desafios. Cadernos de Pesquisa, 38(134),
413-440.
Alves, M. T. G., & Soares, J. F. (2007). Efeito-escola e estratificação escolar: O impacto da compo-sição de turmas por nível de habilidade dos alunos. Educação em Revista, 45, 25-58. doi: 10.1590/
S0102-46982007000100003
Andrade, J. M., & Laros, J. A. (2007). Fatores associa-dos ao desempenho escolar: Um estudo multinível com dados do SAEB/2001. Psicologia: Teoria e Pes-quisa, 23(1), 33-42. Retrieved from http://www.
scielo.br/pdf/ptp/v23n1/a05v23n1.pdf
Barbosa, M. E. F., & Fernandes, C. (2001). A escola bra-sileira faz diferença? Uma investigação dos efeitos da escola na proficiência em matemática dos alu-nos da 4a série. In C. Franco (Ed.), Avaliação, ciclos e promoção na educação (pp. 155-172). Porto Alegre:
Artmed.
Carvallo-Pontón, M. (2010). Eficacia escolar: Ante-cedentes, hallazgos y futuro. Revista Internacional
de Investigación en Educación, 3, 199-214. Retrieved
from http://revistas.javeriana.edu.co/index.php/ MAGIS/article/view/3536
De Leeuw, J., & Meijer, E. (2008). Handbook of multilevel analysis. New York, NY: Springer Science and
Bu-siness Media.
Ferrão, M. E. (2003). Introdução aos modelos de regressão multinível em educação. Campinas: Editora Komedi.
Ferrão, M. E., Beltrão, K. I., & Santos, D. P. (2002). Política de não repetência e a qualidade da edu-cação: Evidências obtidas na modelagem dos dados da 4ª série do Saeb-99. Estudos em Avalia-ção Educacional, 26, 47-73. Retrieved from http://
www.fcc.org.br/pesquisa/publicacoes/eae/ar-quivos/1179/1179.pdf
Fletcher, P. R. (1998). À procura do ensino eficaz (Rela-tório Técnico). Brasília: MEC-DAEB.
Franco, C., Ortigão, I., Albernaz, A., Bonamino, A., Aguiar, G., Alves, F., & Sátyro, N. (2007). Quali-dade e equiQuali-dade em educação: Reconsiderando o significado de “fatores intraescolares”. Ensaio: Avaliação e Políticas Públicas em Educação, 15(55),
277-298. doi: 10.1590/S0104-40362007000200007 Goldstein, H. (2010). Multilevel Statistical Models (4th
edi-tion). London: Wiley.
Goldstein, H., Rasbash, J., Plewis, I., Draper, D., Brow-ne, W., & Yang, M. (1998). A user’s guide to MLwiN.
London: Institute of Education.
Gonçalves, F. O., & França, M. T. A. (2008). Transmis-são intergeracional de desigualdade e qualidade educacional: Avaliando o sistema educacional bra-sileiro a partir do SAEB 2003. Ensaio: Avaliação e Políticas Públicas em Educação, 16(61), 639-662.
Re-trieved from http://www.scielo.br/pdf/ensaio/ v16n61/v16n61a09
Hox, J. J. (2010). Multilevel analysis: Techniques and applica-tions (Second edition). New York: Routledge.
Instituto Nacional de Estudos e Pesquisas Educacionais Anísio Teixeira – Inep, (2007). SAEB – 2005 Pri-meiros resultados: médias de desempenho do SAEB/2005 em perspectiva comparada. Brasília: Ministério da
Educação/Inep.
Jesus, G. R., & Laros, J. A. (2004). Eficácia escolar: Re-gressão multinível com dados de avaliação em larga escala. Avaliação Psicológica, 3(2), 93-106. Retrieved
from http://pepsic.bvsalud.org/pdf/avp/v3n2/ v3n2a04.pdf
Karino, C. A., Vinha, L. G. A., & Laros, J. A. (2015). Os questionários do SAEB: O que eles realmente medem? Estudos em Avaliação Educacional, 25(59),
270-297.
Konstantopoulos, S. (2006). Trends of school effects on student achievement: Evidence from NLS:72, HSB:82, and NELS:92. Teachers College Record, 108(12), 2550-2581. Retrieved from http://ftp.iza.
org/dp1749.pdf
Kreft, I. G. G., & De Leeuw, J. (1998). Introducing multile-vel modeling. London, Sage Publications.
Laros, J. A., Marciano, J. L. P., & Andrade, J. M. (2010). Fatores que afetam o desempenho na prova de matemática do SAEB: Um estudo multinível.
Avaliação Psicológica, 9(2), 173-186. Retrieved
from http://pepsic.bvsalud.org/pdf/avp/v9n2/ v9n2a04.pdf
Laros, J. A., Marciano, J. L. P., & Andrade, J. M. (2012). Fatores associados ao desempenho escolar em Português: Um estudo multinível por regiões. En-saio: Avaliação e Políticas Públicas em Educação, 20,
623-646. Retrieved from http://www.scielo.br/ pdf/ensaio/v20n77/a02v20n77.pdf
Lee, V. L. (2008). Utilização de modelos lineares hie-rárquicos lineares para estudar contextos sociais: o caso dos efeitos da escola. In N. Brooke e J. F. Soa-res (Eds.), Pesquisa em eficácia escolar: origem e trajetórias
(pp. 273-296). Belo Horizonte: Editora UFMG. OECD (2013). PISA 2012 results: What students know and
can do – student performance in Mathematics, Reading and Science (Volume I), PISA, OECD Publishing.
Oliveira, P. R., Belluzzo, W., & Pazello, E. T. (2013). The public-private test score gap in Brazil. Economics of Education Review, 35, 120-133.
Pestana, M. I. O. (1999) Sistema de avaliação brasileiro.
Revista brasileira de estudos pedagógicos, 79(191),
65-73. Retrieved from http://rbep.inep.gov.br/index. php/RBEP/article/view/231
Reynolds, D., Sammons, P., Fraine, B. D., Townsend, T., & Damme, J. V. (2011). Educational effectiveness research (EER): A state of the art review. Trabalho
apresentado no International Congress for School Effectiveness and Improvement, Cyprus.
Rutter, M., & Maughan, B. (2002). School Effectiveness findings 1979-2002. Journal of school psychology, 40(6),
451-475. doi:10.1016/S0022-4405(02)00124-3 Sammons, P., Hillman, J., & Mortimore, P. (1995). Key
characteristics of effective schools: A review of school ef-fectiveness research. London: Office for Standards in
Education [OFSTED].
Soares, J. F., & Alves, M.T.G. (2003). Desigualdades raciais no sistema brasileiro de educação básica.
Educação e Pesquisa, 29(1), 147-165. Retrieved from
http://www.scielo.br/pdf/ep/v29n1/a11v29n1. pdf
Soares, J. F. (2004). O efeito da escola no desempenho cognitivo de seus alunos. Revista Electrónica Iberoa-mericana sobre Calidad, Eficácia y Cambio en Educación, 2(2), 83-104. Retrieved from
http://www.ice.deus-to.es/RINACE/reice/vol2n2/Soares.pdf
Soares, J. F. (2005). O efeito da escola no desempenho cognitivo de seus alunos. In A. de M. Souza (Ed.),
Dimensões da avaliação educacional (pp. 174-204).
Pe-trópolis, RJ: Vozes.
Soares, J. F., César, C. C., & Mambrini, J. (2001). De-terminantes de desempenho dos alunos do ensino básico brasileiro: Evidências do SAEB de 1997. In C. Franco (Ed.), Avaliação, ciclos e promoção na educa-ção (pp. 121-153). Porto Alegre: Artmed.
Soares Neto, J. J., Jesus, G. R., Karino, C. A., & Andrade, D. F. (2013). Uma escala para medir a infraestrutu-ra escolar. Estudos em Avaliação Educacional, 24(54),
78-99. Retrieved from http://www.fcc.org.br/pes-quisa/publicacoes/eae/arquivos/1786/1786.pdf UNESCO (2014). Teaching and learning: Achieving quality
for all. UNESCO Publishing.
Recebido em: 02/12/2014 Primeira reformulação em: 05/05/2015 Aprovado em: 21/05/2015
Sobre os autores:
Luís Gustavo do Amaral Vinha é professor Adjunto do Departamento de Estatística da Universidade de Brasília.
Mestre em Estatística pela Universidade de São Paulo (USP) e Doutor em Psicologia Social, do Trabalho e das Orga-nizações pela Universidade de Brasília (UnB).
E-mail: lgvinha@gmail.com
Camila Akemi Karino é psicóloga. Aluna de Doutorado do Programa de Pós-graduação do Instituto de Psicologia da
Universidade de Brasília. Mestre em Psicologia Social, do Trabalho e das Organizações pela Universidade de Brasília.
E-mail: camilaakarino@gmail.com
Jacob Arie Laros é professor Associado do Instituto de Psicologia da Universidade de Brasília. Coordenador do
laboratório META (Métodos e Técnicas de Avaliação). Autor e dois testes não-verbais de inteligência: o SON-R 2½-7 e o SON-R 6-40. PhD em Psicologia pela University of Groningen.
E-mail: jalaros@gmail.com
Contato com os autores: Luís Gustavo do Amaral Vinha
Universidade de Brasília, Instituto de Psicologia – IP, Instituto Central de Ciências (ICC)/Ala Sul sala A1-061/4, Laboratório de Métodos e Técnicas de Avaliação – META