INTEGRATING OPENSTREETMAP DATA AND SENTINEL-2
IMAGERY
FOR
CLASSIFYING
AND
MONITORING
INFORMAL SETTLEMENTS
ii
INTEGRATING OPENSTREETMAP DATA AND
SENTINEL-2 IMAGERY FOR CLASSIFYING AND
MONITORING INFORMAL SETTLEMENTS
Dissertation supervised byJoel Dinis Baptista Ferreira da Silva, PhD Instituto Superior de Estatística e Gestão de Informação,
Universidade Nova de Lisboa Lisbon, Portugal
Dissertation co-supervised by Prof. Dr. Hanna Meyer, Institute of Landscape Ecology, Heisenbergstr. 2, D-48149 Münster
Dissertation co-supervised by Ignacio Guerrero
Institute of New Imaging Technologies, Universitat Jaume I
Castellón de la Plana, Spain
iii
DECLARATION OF ORIGINALITY
I declare that the work described in this document is my own and not from someone else. All the assistance I have received from other people is duly acknowledged and all the sources (published or not published) are referenced.
This work has not been previously evaluated or submitted to NOVA Information Management School or elsewhere.
Lisbon, Portugal, January 2020
iv
ACKNOWLEDGMENTS
Principally, I would like to thank my Supervisors, Joel Dinis Baptista Ferreira da Silva (PhD), Prof. Dr. Hanna Meyer and Ignacio Guerrero. You were instrumental from the inception, through the execution and end of this Thesis. I am extremely grateful and honored to have collaborated with you.
I am extremely grateful to all the professors that helped through this master’s program especially professors Marco Painho and Christoph Brox for their guidance and support throughout the program duration.
Thank you to my cohort and fellow MSc. GeoTech graduate students – especially Damien and Chamodi - you have been incredible resources, whose positive and hardworking spirit has made my Master’s experience so much more enjoyable and fun. Lastly, thanks to my friends and family who were of great support even if you were thousands of miles away.
v
Integrating Openstreetmap Data and Sentinel-2 Imagery for
Classifying and Monitoring Informal Settlements
ABSTRACT
The identification and monitoring of informal settlements in urban areas is an important step in developing and implementing pro-poor urban policies. Understanding when, where and who lives inside informal settlements is critical to efforts to improve their resilience. This study aims at integrating OSM data and sentinel-2 imagery for classifying and monitoring the growth of informal settlements methods to map informal areas in Kampala (Uganda) and Dar es Salaam (Tanzania) and to monitor their growth in Kampala. Three building feature characteristics of size, shape and Distance to nearest Neighbour were derived and used to cluster and classify informal areas using Hotspot Cluster analysis and ML approach on OSM buildings data. The resultant informal regions in Kampala were used with Sentinel-2 image tiles to investigate the spatio-temporal changes in informal areas using Convolutional Neural Networks (CNNs). Results from Optimized Hot Spot Analysis and Random Forest Classification show that Informal regions can be mapped based on building outline characteristics. An accuracy of 90.3% was achieved when an optimally trained CNN was executed on a test set of 2019 satellite image tiles. Predictions of informality from new datasets for the years 2016 and 2017 provided promising results on combining different open source geospatial datasets to identify, classify and monitor informal settlements.
vi
KEYWORDS
Informal Settlements; Remote Sensing; Urbanization; Machine Learning (ML); Random Forest (RF);Convolutional Neural Networks (CNN); OpenStreetMap (OSM)
vii
ACRONYMS
CNN - Convolutional Neural Networks (CNNs) DEM - Digital elevation model
DSM - Digital surface model EO – Earth Observation
GEOBIA - Geographic object-based image analysis GPS - Global positioning system
GSO - Global slum ontology
HR - High Resolution Satellite Imagery ISDA - Informal settlement database atlas
ISUP - Informal settlement upgrading Programme KOTAKU - Kota Tanpa Kumuh
LiDAR - Light detection and ranging MGD - Millennium development goals MKL - Multiple Kernel Learning MLTs - Machine Learning Techniques OBIA - Object-based image analysis OHSA - Optimized Hotspot Analysis OOA - Object-oriented analysis OSM – Open Street Map
PSUP - Participatory slum upgrading Programme RF - Random forest
RGB – Red Green Blue
SDI - Shack/Slum Dwellers International SVM - Support Vector Machine
viii UN – United Nations
UN-Habitat – United Nations Human Settlements Programme VGG - Visual Geometry Group
VHR - Very high resolution
VHR – Very High Resolution Satellite Imagery WDI - World Development Indicators
ix
INDEX OF THE TEXT
DECLARATION OF ORIGINALITY ... iii
ACKNOWLEDGMENTS ... iv
ABSTRACT ... v
KEYWORDS ... vi
ACRONYMS ... vii
INDEX OF THE TEXT ... ix
INDEX OF TABLES ... xi
INDEX OF FIGURES ... xii
1. INTRODUCTION ... 1
1.1. Background and Motivation... 1
1.2. Research Gap Identification ... 3
1.3. Research Aim ... 4
1.4. Methodology overview ... 5
1.5. Thesis Structure ... 5
2. LITERATURE REVIEW ... 6
2.1. Characteristics of Informal Settlements ... 6
2.1.1. Building characteristics: ... 6
2.1.2. Access Characteristics: ... 7
2.1.3. Location and neighbourhood Characteristics: ... 7
2.2. OpenStreetMap for Urban Analytics ... 7
2.3. Approaches for identifying and Mapping Informal Settlements ... 8
2.3.1. Survey and census-based approach ... 8
2.3.2. Participatory-based approach... 9
2.3.3. GIS and Remote sensing-based approach ... 9
2.4. Hot Spot Clustering Analysis ... 11
2.5. An overview of Machine Learning Techniques ... 11
2.5.1. Convolutional neural-networks... 13
3. DATA AND CASE STUDY ... 16
3.1. Case Study ... 16
3.2. Datasets and Pre-Processing ... 18
3.2.1. OSM Data ... 18
3.2.2. Satellite Imagery ... 19
3.2.3. Reference data... 20
4. RESEARCH METHODOLOGY ... 21
x
4.2. Informal Settlement Buildings Clustering and Classification ... 22
4.2.1. Clustering of Informal Settlement Buildings ... 22
4.2.2. Prediction of Informal Settlements based on Building Characteristics ... 23
4.3. Monitoring the growth of Informal Settlements ... 24
5. RESULTS ... 27
5.1. Clustering Analysis ... 27
5.1.1. Clustering Indices for Building Characteristics ... 27
5.1.2. Optimized Hotspot Analysis ... 27
5.1.3. The Association between the Cold spots and Informal settlements ... 28
5.2. Prediction of Informal Settlements using Machine Learning ... 31
5.3. Monitoring Informal Settlement Growth ... 33
6. DISCUSSION ... 37
6.1. Discussion ... 37
6.2. Limitations ... 39
7. CONCLUSION AND FUTURE WORKS ... 40
8. ANNEXES ... 52
8.1. Independent Samples T-Tests On Hotspot Analysis GiZScores and Nneighbors ... 52
8.2. Informality Regions for Kampala in 2016 (top left), 2017 (top right) and 2019 (bottom) ... 55
xi
INDEX OF TABLES
Table 1: Number of buildings and city per dataset ... 19
Table 2: Details of Sentinel-2 satellite images ... 20
Table 3: Spatial Autocorrelation (Moran's I) Results ... 27
Table 4: Independent samples t-test analysis Results ... 29
Table 5: Accuracy Assessment of Classifiers ... 31
Table 6: Accuracy Assessment on Testing Sets ... 32
xii
INDEX OF FIGURES
Figure 1: Informal Settlements In Africa [7, 8] ... 1
Figure 2: Machine Learning Cheat Sheet [73] ... 12
Figure 3: CNN Model Illustration ... 14
Figure 4: Case Study ... 17
Figure 5: OSM buildings over ArcGIS Imagery Basemap ... 18
Figure 6: Partitions of the city of Kampala ... 19
Figure 7: Distribution of Informal Settlements in Kampala based on Average Household Size [97] ... 20
Figure 8: Methodology Flowchart ... 21
Figure 9: Informal and Formal Tiles ... 25
Figure 10: OHSA Results Maps for Size, Shape and NND ... 28
Figure 11: Buildings Classified as Formal and Informal ... 30
Figure 12: Informal Areas based on the Building Property Variables ... 30
Figure 13: K-Fold Cross Validation of Classifiers ... 32
Figure 14: Informal Regions in Kampala (Left) and Dar es Salaam (Right) ... 33
Figure 15: Classified Image Tiles ... 35
Figure 16: Change in Informal Settlement Regions in Kampala. This shows Informal tiles that existed in January 2016, new informal tiles that had developed by August 2017 and also by December 2019. ... 36
1
1. INTRODUCTION
1.1. Background and Motivation
Majority of the countries in the global south are the epicenter of global urbanization, which is without a doubt resulting into evident challenges which include high demand for employment, services and infrastructure [1, 2]. However, much of this urbanization is characterized by insufficient infrastructure, a lack of formal jobs, and haphazardly built and often squalid slums. Lack of planning, weak regulations, and, in some countries, the difficulty of obtaining title deeds for land, leads cities to grow out rather than up, making commutes longer and costlier which disconnects people and companies from jobs and markets, hence stifling the economy [3]. Most of these countries, especially in Africa are characterized by unbalance urban systems with one very large primary city and then less competitive smaller cities. The primary cities are predominantly crowded with people due to ease of access to resources and this has led to urban housing deficit accompanied by a huge infrastructure deficit. Informal settlements and slums develop because they are the only type of settlement affordable and accessible to the poor in cities, where competition for land is intense. [4] The UN-Habitat defines a slum as a group of UN-HABITAT defines a slum household as a group of individuals living under the same roof in an urban area who lack one or more of the following: (a) Durable housing of a permanent nature, (b) Sufficient living space, (c) Easy access to safe water in sufficient amounts, (d) Access to adequate sanitation and (e) Security of tenure that prevents forced evictions. Informal settlements and slums are usually characterized by inadequate basic Infrastructure and services such as water, sanitation, waste collection, storm drainage, street lighting, paved sidewalks and roads etc. [5, 6]. They also have inadequate access to schools, hospitals and public open spaces which are vital for human wellbeing [1].
2 Informal settlements / Slums are not a new phenomenon as they have been existent from the early years of urbanization and industrialization. The two main reasons for the growth of slums are Population growth and Governance [4, 6, 9].
Population Growth. As rapid urbanization is happening globally, many people move to the cities and urban regions in search for better facilities, employment and services [2, 4]. Rural – Urban and internal Migration occur due to peoples need for better job prospects, education, health facilities, or freedom from restrictive social or cultural realities. High birthrates in countries in the global south has lead most cities into an era of unprecedented growth [3]. Governance. Governments in Global South countries often cannot respond to rapid urbanization quickly enough, fail to recognize the rights of the urban poor and incorporate them into urban planning. This leads to the growth of Slums because the rate at which people are migrating to cities cannot be met by the planning process [4]. Some government and planning agencies also believe that providing services to the urban poor will only attract more urbanization and cause more slums to grow. However, this notion that people migrate to the cities for water or services is not accurate because most people are looking for employment [10].
Informal settlements are generally off the map in most cities because they are illegal and unplanned with undefined boundaries [6]. The growth of informal settlements is rapid and uneven over time and difficulties occur when the need to determine the number of those living in these settlements arises because most of them are not officially registered, which brings about uncertainties. This poses issues with regards to monitoring and planning of cities by the concern bodies which need adequate information in order to provide adequate services and infrastructure for those living in the urban areas as a whole. [11, 12] Informal settlements take on various shapes and sizes in different part world depending on various spatial characteristics of the areas in question but still possess some similar features and trends. These varying characteristics bring about complexities when creating unified methods that can be used across the board when dealing with different urban areas. These methods can be used to assess and predict the rapid urbanization by the different planning bodies and policy makers who are faced with inadequate information in different part of the world [11, 13]. In this Research, informal settlement and Slum will refer to the same thing.
To date, a significant amount of Research on informal settlement detection, monitoring and prediction has been carried out over the year with most recent studies based on urban modelling
3 using mathematical and machine learning algorithms. There has been a rise in the use of EO-based methods for mapping informal settlements, usually coupled with machine-learning methods for example [13, 16 ,17, 18 , 20, 21, 22]. They involved the use of EO data like Optical Space borne data, Synthetic Aperture Radar data, Unmanned Aerial Vehicle data etc., to distinguish of informal settlements or slums in urban areas by using either supervised or unsupervised machine learning image classification. Some object-oriented image analysis employed involved conjunction with local ontological expert knowledge. Other studies like in the development of the predictSLUMS model to identify and predict informal settlements uses street intersections data from Open Street Map, based on spatial statistics and a machine learning approach [20]. Other studies like Patel et al and A.T. Crooks [14,15] both developed geosimulation models that integrates a Geographic Information System and agent-based modeling (ABM) to examine the temporal changes of slums with developing countries cities in a particular spatial dimension and residential segregation respectively.
1.2. Research Gap Identification
As depicted from some of the studies shown above, several methods and techniques have been applied to map and classify informal settlements, and it’s evident that solving the problem of identify and mapping informal settlements requires the collaboration of different parties like planning departments, GIS and Remote sensing techniques, Machine learning etc. The methods applied to detect and monitor informal settlements intend to distinguish these informal settlements from other urban areas based on concentration of housing units, road/ street networks. The location and mapping of informal settlements in most previous works mainly focuses on small portions of the City or Region with which prior knowledge of existence of the slum in that particular location is available. This poses a problem where there is no knowledge of the existence of an informal settlement in a particular area since the mapping is done partially. When more attention is given to already known slums, this allows for new slums to germinate since informal settlements tend to grow rapidly both in space and time, and yet there is already poor documentation on slums within the entire city. Existing strategies for mapping informal settlements oftenly require ancillary data such as location of schools, hospitals etc. in order to assess then based on remotely sensed data. However, this ancillary data is inadequate for poor developing countries. There is need for methods and techniques that can help to map the existence of informal settlements based on the distribution of geometrical and topological properties (Shape, Size, Orientation, Density) of their building
4 polygons, and at the same time identify informal regions across the entire city and not just particular places. There is also need to examine whether similar building polygons in informal settlements - similar in the sense of geometrical properties exhibit a spatial pattern. The informal settlement buildings characteristics coupled with Machine learning algorithms could help to predict where informal settlements could be and also if these characteristics are exhibited in varying geographical locations. This will help reduce the aggravation that comes up during their detection for inventory or planning issues and also provide more insight and understanding on the growth of these settlements.
The other challenge with mapping informal settlements at city, regional or country level is the absence of adequate data for analysis at these scales. The availability of open source satellite imagery like Landsat and Sentinel data provide a wider coverage but the spatial resolutions they offer does not provide for adequate distinguishing between formal and informal settlements in cities. However, with accurate delineating of these settlements at a finer scale, these satellite images can be used to monitor the growth of informality over time since the integration of spatio-temporal analysis of informal settlements is still inadequate.
1.3. Research Aim
The main aim of this research work is to integrate OSM data and sentinel-2 imagery for classifying and monitoring the growth of informal settlements.
To achieve the main research Aim, the following sub questions are addressed:
1. How can we exploit the potential of using buildings outline characteristics such as size and shape to differentiate Informal settlements from Formal Settlements?
2. Is it possible to predict informal areas in a city by understanding housing informality in other cities of similar context using buildings outline characteristics and machine learning?
3. What is the most appropriate Machine Learning technique based on accuracy to predict informal areas in a city based on buildings outline characteristics?
4. How can we exploit the potential of freely available Sentinel-2 satellite imagery with advanced machine learning to estimate the growth of Informal settlements?
5 1.4. Methodology overview
Based on the research questions, the following methodology workflow was adapted:
Preprocessing of OSM data and Satellite Imagery. This involved data cleaning and preparation suitable for Analysis.
OSM Building polygons enrichment with Feature geometric and topologic characteristics.
Hotspot clustering analysis on building features training dataset to cluster Informal settlement buildings from the formal ones.
Test and select the best classifier based on accuracy to predict informal areas in a city based on similarity context of buildings outline characteristics.
Sentinel-2 image classification. This stage involves slicing the images into tiles and using the predicted Informal settlement regions from the step above to generate training set on image tiles of corresponding date period. Thereafter, a Convolutional Neural Networks Model is trained to identify Image tiles that belong to Informal settlements. The trained model is then used to predict Informal settlement image tiles for other temporal datasets.
1.5. Thesis Structure
The research is organized as follows:
Chapter 2 reviews the related works and theoretical background on informal settlements, approaches for mapping and identifying informal settlements, and Machine Learning Algorithms
Chapter 3 describes the study area, datasets and tools used for the research.
Chapter 4 describes the implementation details of the methodology and the experiments conducted
Chapter 5 presents the results;
Chapter 6 addresses the analysis and discussion of the results including the limitations of the research;
Chapter 7 presents a summary of the conclusions by answering the main re-search questions and recommendations for future works.
6
2. LITERATURE REVIEW
This chapter gives an overview on the fundamental concepts related to this research and the current state of research in the field of mapping informal settlements It highlights the physical characteristics of informal settlements, a discussion on various approaches used to map informal settlements and the integration of GIS and informal settlements and Machine Learning Algorithms.
2.1. Characteristics of Informal Settlements
The challenge with mapping and identify what an informal settlement is starts with the absence of a standard definition which has resulted into failure to incorporate these settlements into census and demographic surveys at national or even district level [23]. Based on literature, they take on names like Slum, Informal, Squatter, Spontaneous, Ghetto, Illegal, Irregular, or described by local names such as Favela, bidonville (French), mudun-safi (Arabic), bairros da lata (Portuguese) township or gecekondu (Turkish), to mention but a few [24]. The UN-Habitat qualitatively defined a slum as a household that is lacking either of improved water, improved sanitation, tenure security or overcrowded living environment is based on a measure of deprivation indicators. On the other hand, the definition of informal settlements differs from slum as those areas that developed through unauthorized occupation of land outside a legal, regulatory, planned and professional framework for example [26, 27]. Therefore, quantifying and classifying informal settlements/ slums in a universally acceptable way is particularly difficult because (a) What is referred to as a slum in one country may be a good quality of living and (b) over time and a settlement can get formalized through slum upgrading programs [27]. However, over the years, some features have been unique to informal settlements which include:
2.1.1. Building characteristics:
Buildings in informal settlements tend to be smaller (10 to 40 m2), have simpler shapes that are mostly rectangular and heterogeneous orientation compared to those in formal settlements. The building density in slums is usually high since the spacing and gap between buildings in almost nonexistence [29, 30].
7 2.1.2. Access Characteristics:
Slums generally have irregular road access network with roads that vary in type, surface and width. [30]The roads are always short in length with many dead ends and dangles. The roads and access network in Informal settlements are usually narrow with limited usage by motor vehicles because they are either two narrow to let a car pass or can only allow access of on vehicle at a time. Slums are characterized with mostly footpaths.
2.1.3. Location and neighbourhood Characteristics:
Slums are usually located in hazardous areas like near dumping sites, wetlands, along railways, sewerage canals. [31]This is because most of the land where these features are located is public land and in abandoned. They are usually close to employment opportunities for unskilled and low skilled jobs like manufacturing industries to ease access to employment.
2.2. OpenStreetMap for Urban Analytics
Access to spatial data has changed rapidly over the years from traditionally prohibitive sources to openly licensed content and data due to changes in Information Technology and Communication (ITC) brought about by internet, social media and inexpensive portable GNSS devices like mobile phones and Handheld GPS [10, 32]. OSM is the most popular geospatial open data source platform containing billions of entries of VGI and is maintained by a massive community of mappers from around the world all working to-wards the goal of curating accurate and complete geospatial data. In the recent years, there has been an increased use of VGI data not only in GIScience but also in other fields like ecology, planning, computer science etc. [33,34,35]. for academic research and studies. OSM roads layers are associated with the highest completeness compared to buildings based on a recent study [36] that estimates that the OSM roads have reached more than 80% of completeness at a global scale. OSM datasets have been used to extract urban information and for analysis [37, 38]. These datasets are usually used as a supplementary source of information for land-use mapping with emphasis on classifying artificial surfaces [39], by combining OSM and satellite images to extract information related to the urban environment [39–42]. Few research studies exist on building footprints data enrichment for urban analysis [43, 44]. In these studies, automatic methods are developed by using the geometric and topological features in footprint data, in order to enhance the maps with the building usage information. Henn et al. [45] derived the architectural types
8 of buildings based on 3D coarse block models with vertical walls and flat roofs using Support Vector Machines (SVMs), whereby, geometric features such as length, width, area, and degree of perpendicularity of building footprints, types of buildings, as well as height information of buildings are required for the classification process.
2.3. Approaches for identifying and Mapping Informal Settlements
Studies on the development and existence of informal settlements have been carried out not only by geographers but also social scientists who put emphasis on social and economic aspects of informal settlements. Due to their complexity and ever varying nature, informal settlements are usually inadequately represented on urban and city maps which leaves them vulnerable to neglect by concerned government agencies. There are broadly three methods used to collect data to inform characterization and classification of informal settlements: household surveys and census, Participatory approaches and Earth Observation imagery analysis using geospatial Techniques [46].
2.3.1. Survey and census-based approach
These approaches use data collected through census and surveys like data on demographics, population, social and economic aspects to map deprivation and poverty. This data maybe coupled with data from official sites like the world Bank is used to map slums based on social, economic and habitat/Infrastructure variables. In [47], an exploratory factor analysis to define the Slum Severity Index (SSI) Mexico City based on measuring the shelter deprivation levels of households from 1990 to 2010. The results showed that the SSI decreased significantly between 1990 and 2000 as a result of several policy reforms but increased between 2000 and 2010. Weeks et al. [48] quantitatively used census data for Accra, Ghana to create a slum index based on the UN slum indicators to measure the concentration of slums. High correlations were found between the slum index, the socio-economic characteristics of neighborhoods and certain land cover metrics derived from VHR satellite imagery. A fusion of open sources physical and socio-economic data in [9] was used to develop an indicator database for characterizing slum settlements by leveraging data mining techniques for mapping slums in Kenya’s major cities. It’s important to note that one of the major challenges is related to census under-coverage due to time constraint, inadequate quality assurance and inaccurate addresses. The absence of
9 censuses in informal settlements is largely due to the inaccessibility of make-shift structures due to political intolerance or general disorder [30].
2.3.2. Participatory-based approach
The participatory approaches involve the cooperation and participation of the informal settlement dwellers in order to generate both spatial and non-spatial information to profile informal settlements [30]. The participatory slum upgrading Programme (PSUP), established by the UN-Habitat and the Slum Dwellers International (SDI) was a participatory approach that encouraged and empowered communities to become active partners with stakeholders in devising strategies to plan sustainable informal settlement upgrades [49]. The Kota Tanpa Kumuh (KOTAKU) platform and program is responsible for the handling of informality in Indonesia through increasing the role of local government and community participation. Informality is defined by buildings, local streets, drinking water supply, community drainage, wastewater management, garbage management, and fire protection [50]. However, Participatory-based approaches are extremely time consuming and effort-intensive is characterized by limited spatial coverage making it difficult to cover larger areas like regional or district levels [30].
2.3.3. GIS and Remote sensing-based approach
The connection between informal settlements and geography has been a focus of study for a long time. Many research studies have investigated the value of using Image- based identification of informal settlements through remote sensing and other GIS analysis tools for more than 2 decades [23,13,48,49, 50]. Three key criteria are often used in such studies: small grain size, high ground coverage and irregular access networks. Other factors such as proximity to hazardous areas, lack of vegetation and low- quality roofing are sometimes included. Such studies often conflate informality with slums. But while most such studies map a binary distinction between formal and informal morphologies, some adopt a more nuanced approach. Bradley et al [54] deploy the use of both HR and VHR satellite imagery to map informal settlements in developing countries using machine learning. They used the Canonical Correlation Forests (CCFs) to learn the spectral signal of informal settlements from HR satellite imagery. The second method used a CNN combined with VHR satellite imagery to extract finer grained features. Peter and Gulnaz studied the use of object based change detection and object tracking of informal settlements using remotely sensing data in Cape town (South
10 Africa) between the period 2000 to 2015. The object change detection provided for detection of thematic changes per object and to document the changes of their property values and potential movement. In [52], the authors discuss and evaluate various machine learning approaches and a combination of various features to detect slums. The classifications methods evaluated included multi-class and hierarchical to distinguish urban from other classes such as vegetation and water. [55] presented the use of CNNs for the detection of informal settlements from VHR i.e. 0.60m Quickbird satellite image for the city of Dar es Salaam, Tanzania acquired in 2007 and compared the results with state of the art classifiers that use handcrafted features. [56] evaluated and pointed out that Object Based Change Detection (OBCD) and OBIA are the most promising techniques for automatized identification of new buildings in informal settlements, but they need to work with VHR data rectified with a DSM of the same or compatible spatial resolution. [57] This paper aimed to document and understand basic infrastructural conditions and their changes over an eight-year period for the Kibera Slum using VHR satellite images by analyzing the dynamics of physical transformations of building sizes and heights, built-up densities, and building arrangements. A pioneering study by Hoffman [58] used OBIA to identify informal settlements from IKONOS imagery in the City of Cape Town. Informal settlement classification was undertaken using sub-classes that described settlement forms (dense, medium, new and bright) based on complex hierarchy and class descriptions such as textural and spectral features. The author found that the ability to detect informal settlements was dependent on the spatial resolution of the imagery. No quantitative results were presented as the findings of the study. This research was later improved by Hofmann et al. [59], who showed that several modifications were required when applying extraction methods to a Quickbird scene in Brazil. The adaptions included simplified and pruned class-hierarchies to make the chosen class descriptors in theory more transferable to comparable scenes. The results of this study demonstrated that the selection of a strategy for informal settlement segmentation and classification is data and context-specific. Shekhar [60] delineated informal settlements in Pune City, India, using Quickbird imagery. The study highlighted the efficacy of the developed methodology to discriminate informal regions by describing typical characteristics of these settlements. Fuzzy membership function of texture, geometry, and contextual information were used to achieve an overall accuracy of more than 87%. Kohli et al. [30] expanded upon the work of Hofmann et al. [59] and developed Generic Slum Ontology (GSO), which can be used as part of a conceptual classification OBIA schema.
11 However, techniques like OBIA require VHR Data usually with a resolution of under 5 meters to detect slum objects and is a very time consuming approach and requires an adoption of parameters and values to a AOI. This makes them difficult to transfer to other cities or countries. It should be noted that most of the recent approaches to identify and map informal settlements involve the fusion of two or more approaches.
2.4. Hot Spot Clustering Analysis
Hotspot analysis is a spatial analysis and mapping technique interested in the identification of clustering of spatial phenomena into statistically significant hot spots and cold spots [61].These spatial phenomena are depicted as points in a map and refer to locations of events or objects. A hotspot is an area that has higher concentration of events compared to the expected number given a random distribution of events [62]. Hotspot detection has evolved from the study of point distributions or spatial arrangements of points in a space [63] to understand spatial patterns in time. The application of hotspot analysis within public health, epidemiological research and crime mapping and research has increased significantly in the past couple of decades mainly due to advancement in GIS-based software. Hotspot analysis usually involves the incident count of points in a location, Attributes that further describes points or Period of time i.e. Date or time of events. Very few studies are based on the use of hotspot analysis in the mapping of Informal settlements because it requires mostly vector data which is quite insufficient for slums compared to raster data. Mohamed et. al introduced a method for identifying and predicting informal settlements using street intersections data using Getis-Ord Gi Hot Spot Analysis and a machine learning approach[20].
2.5. An overview of Machine Learning Techniques
Machine learning techniques (MLTs) (Figure 2) generate knowledge in a learning phase by means of training data and transfer this to new data for prediction and generalization even with noise-contaminated and incomplete data [58,59].
MLTs have been successfully used in analyzing and modeling various complex environmental disciplines, including in medicine, financial markets, ecology, geography, biomedicine, and epidemiology [66–69]. The growing popularity of MLTs can be attributed to their abilities to approximate almost any complex non-linear functional relationship [70–72]. Machine
12 Learning algorithms are based on both supervised and unsupervised learning. Supervised Learning works with labeled input data, known as training data in a training process for predicting unknown data. Based on the known data, the training process thereby continues until the model achieves a desired level of accuracy. Once the model is trained it can be used to transfer this knowledge on new data by generalizing from the training data to unknown examples. Supervised learning problems can be further grouped into classification and regression problems. On the other hand, for Unsupervised Learning, the input data is not labeled and does not have a known result. The model tries to recognize a pattern in the input data to learn about it and extract rules. This can be done through a mathematical process to systematically reduce redundancy or by organizing the data by similarity like through Clustering and Association.
Figure 2: Machine Learning Cheat Sheet [73]
Some of the most common ML algorithms in Geospatial Sciences and Mapping of Informal settlements are Logistical Regression, Decision Trees (DT), self-organizing maps (SOM), random forests (RF), support vector machines (SVM) and artificial neural networks (ANN). It’s important to note that selecting the best algorithm for a task is quite challenging since no algorithm outperforms others in a given task. Machine learning techniques have been and are still being used to carry out geospatial analysis in various fields for clustering, classification
13 and prediction various environmental and socioeconomic phenomena using different types of data.
2.5.1. Convolutional neural-networks
Convolutional neural-networks (CNNs) are a branch of artificial neural networks designed to recognize objects in images based on their ability to develop an internal representation of a two-dimensional image [74]. The convolutional neural network is composed mainly of three types of layers i.e. Convolutional Layers, Pooling Layers, Fully-Connected Layers. The Convolutional layers are comprised of filters which are the neurons of the layer and a feature map which is the output of one filter applied to the previous layer. The pooling layers down-sample the previous layers feature map by following a sequence of one or more convolutional layers with the intention to consolidate the features learned and expressed in them. They are used to reduce the size of the data while maintaining the most important features. Fully connected layers are the normal flat feed-forward neural network layer used at the end of the network after feature extraction and consolidation has been performed by the convolutional and pooling layers, to create final non-linear combinations of features and for making predictions by the network [75]. CNNs are well suited for the task of image classification in the field of remote sensing, However, CNNs also pose challenges when applied to remote sensing as it is often difficult or impractical to obtain a large set of labelled images, the model performs poorly and tends to over fit [74]. Such challenges can be curbed using techniques like Data augmentation using rotations and flips to increase the total number of training images to further avoid overfitting problem [33].
14
Figure 3: CNN Model Illustration [74]
Recent publications applying machine learning to remote sensing data, in particular to satellite imagery focusing on detecting or mapping informal settlements,[13, 55, 76–79] have typically been trained on a specific region, or feature in combination with VHR [80–82]. The approaches most in spirit to our own are [78, 79, 83]. Varshney et al. [78] focus on detecting roofs in Eastern Africa using a template matching algorithm and random forest, they take advantage of Google Earths’ API to extract high resolution imagery, which although is free to researchers, is not openly available to everyone. Xie et al. and Jean et al.[19, 79] use a mixture of data sources and transfer learning across different data sets to generate poverty maps by taking advantage of night time imagery through the National Oceanic and Atmospheric Administration (NOAA) and daytime imagery through Google Earths’ API. However, to our knowledge there exists no previous work on predicting informal settlements solely from LR data, or predicting informal settlements in the way that we present here. This inhibits our ability to benchmark against previous methods. Thus, by providing the data sets and the baselines in this paper, we provide a robust way to compare the effectiveness of any future approaches and facilitate the creation of new machine learning methodologies.
15 Informal settlements are still growing, however, the possibility for further improvements is rising with every new improved method. Therefore, this research attempts to reveal a new scope of mapping and identifying informal settlements by combining the benefits of Open data for mapping and monitoring.
16
3. DATA AND CASE STUDY
The following chapter presents the study area selected for research, the datasets and tools used This research is entirely conducted with open source geospatial data from OSM and Sentinel-2 satellite imagery.
3.1. Case Study
This research is mainly based on Kampala city, though the city of Dar es Salaam was selected as a second case study to assess the transferability of Building feature characteristics of informal settlements. The two East African cities of Kampala and Dar es Salaam were selected based on the availability and access to open source building polygons and their ranking and among the top fastest growing African cities. Kampala, the capital city of Uganda and Dar es Salaam (the major city of Tanzania) are African cities experiencing an era of unprecedented urban growth. Out of the world’s 30 fastest growing cities, the top 10 are African including Dar es Salaam which is ranked second behind Kampala [3].
Kampala (Figure 4) with an estimated population of 1.5 million in 2014 and an area of about 8,451.9 km2 [84] is divided into five divisions namely: Kampala Central Division, Kawempe Division, Rubaga Division, Makindye Division and Nakawa Division. The emergency of informal settlements in Kampala City has been gradual and sustained over a long period of time, which is attributed to the failure of Kampala Structure Plans to cater for the growth and development.
Dar es Salaam (Figure 4), the major port city of Tanzania is the center for industry, commerce and banking activities in the country. It has a population of about 4.36 million with an area coverage of about 1,590 km² [3]. It is made up of three districts Kinondoni in the north, Ilala in the Centre, Temeke in the south [85]. Dar es Salaam houses about 10% of the nation’s population with approximately 70% of the urban households living in deprived areas [86,87]. More than three-quarters of residents live in informal settlements like Tandale.
17 Figure 4: Case Study
18 3.2. Datasets and Pre-Processing
3.2.1. OSM Data
The datasets of Kampala and Dar-es Salaam cities were used for identification of informal settlement areas. For both cities detailed building outlines were downloaded from the Geofabrik website [88], which offers up-to-date countrywide shapefiles for geodata extracted from OSM. Detailed building polygons exist for the selected cities due to a recent release of building datasets for Uganda and Tanzania by Microsoft to the OSM database. Under the Microsoft’s AI for Humanitarian Action program, a two-step process with semantic segmentation followed by polygonization resulted in 18M building footprints — 7M in Uganda and 11M in Tanzania. The building footprints generated from Bing imagery were detected using the Microsoft Cognitive Toolkit (CNTK) open source deep-learning toolkit and ResNet34 with RefineNet up-sampling layers [89,90]. Since OSM data is mostly captured by non-experts, some pre-processing steps were necessary in order to gain consistent datasets. Topological errors like Duplicate features and small gaps of buildings were fixed using both automatic and manual tools in ArcGIS pro and AutoCAD Map 3D [91]. The attribute tables were also examined to drop unwanted columns and also features that belonged to classes such as “wall”, “toilet” etc. were dropped. A visual examination of the polygons was carried out to assess their correctness and completeness when overlaid on a basemap (Figure 5).
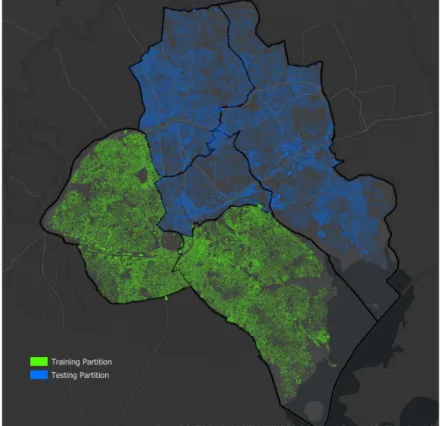
19 In Table 1, the total number of buildings for the datasets are listed. In order to create a training and test dataset for unsupervised classification, OSM data of Kampala was split into two partitions as shown in Figure 6.
City # Buildings
Kampala (training partition) 214,885 Kampala (test partition) 214,191
Dar es Salaam 971,008
Table 1: Number of buildings and city per dataset
Figure 6: Partitions of the city of Kampala
3.2.2. Satellite Imagery
Several previous studies have successfully used Sentinel 2 data for slum detection and urban analytics [15,92] [93–95]. The pros of using sentinel-2 imagery lie in the fact that it offers a combination of spatial (10m), spectral (13 bands) and temporal resolution (5 days at the equator) based on two identical satellites [96]. Three (red, green and blue) of the Sentinel’s 13 bands provide a 10m resolution, hence were selected for use in this research to monitor
20 Informal settlements, though most informal settlement buildings are smaller than this spatial resolution of 10m*10m. The images of the dates in Table 2 were selected based on perceived visually similarity, quality and minimal cloud cover.
Acquisition Date Bands Used 01-01-2016 4,3,2
23-08-2017 4,3,2 31-12-2019 4,3,2
Table 2: Details of Sentinel-2 satellite images 3.2.3. Reference data
The map selected to validate regions mapped out as informal regions in Kampala (Figure 7) was prepared by AcTogether (Ug) in 2014, does not include the slum settlements which have recently come up in the city. However, it provides the locations of the slum settlements manually delineated through Fields surveys and Public Participation. The slums in Kampala city are not clustered at specific locations but have scattered presence all over the city with varying sizes and shapes. The settlements are located along the main roads in elongated and irregular shapes, along railway lines and near the lake. Unfortunately, recent Informality maps for Dar-es Salaam were difficult to come by.
Figure 7: Distribution of Informal Settlements in Kampala based on Average Household Size [97]
21
4. RESEARCH METHODOLOGY
The method consists of three main phases (Figure 8). First phase consists of enriching the building outline features with geometric and topologic parameters,
The second phase entails hotspot clustering and classification of these characteristics to identify informal settlements in similar context cities, and the final phase involves spatio-temporal monitoring of informal settlements using sentinel-2 imagery.
Figure 8: Methodology Flowchart 4.1. Data Enrichment and Computation of Parameters
Before carrying the clustering and classification process, geometric and topological measures to allow grouping of features into different clusters were determined. The measures chosen for enriching the building features were size, shape and shortest distance to a neighboring building. A building’s shape was described by the number of vertices it has i.e. vertex number (VN). More complex buildings have many vertices and vis versa. The size was described by calculating its area (A) [98,99]. The Nearest Neighbor Distance (NND) and was used to describe the topological relations to neighboring features [100]. Buildings in informal
22 settlements tend to be very close to each other with limited gap between them. They are also small in size and have simple shapes like for rectangles or squares houses. The normalization of computed variables was carried out since they have varying scales and to avoid influence of some variables over others during use in the machine learning algorithms. The Min-max normalization approach was used where all the values were mapped between [0–1].
𝑿 =
(𝑿 𝑿𝐦𝐢𝐧)(𝑿𝐦𝐚𝐱 𝑿𝐦𝐢𝐧)
(Min-Max Normalization Equation)
Where,
X
is an original value,X’
is the normalized value, andX
min,X
max are the minimum and maximum values of this particular property.4.2. Informal Settlement Buildings Clustering and Classification
In the first step, clusters are determined based on similarity of building feature characteristics using hotspot clustering analysis. The clusters are then reclassified to reduce the number of clusters. If a building belongs to the same cluster based on the features characteristics, its binned in one cluster and vis versa. This is done on the Kampala training partition. The second step involves using different classifiers to select one that suits the training partition data. The selected classifier is them used to determine informality regions in the Kampala Testing Partition and Dar-es-Salaam dataset.
4.2.1. Clustering of Informal Settlement Buildings
As shown in chapter 2, informal settlement areas have building features characterised by simple shapes, small buildings and have limited gaps between them.
In order to determine the pattern of spatial distribution and where low and high values of the building feature characteristics are grouped, hotspot analysis based on the use of Getis-Ord Gi* statistic was carried out on the Kampala training partition dataset to identify statistically significant hot and cold spots [61]. Since hotspot analysis requires the presence of clustering, there is need to test for the presence of clustering in the dataset by assessing spatial autocorrelation to identify clustering within the entire dataset. The Spatial Autocorrelation (Moran’s) tool in ArcGIS measures spatial autocorrelation by simultaneously measuring feature locations and attribute values. If features that are close together have similar values,
23 then that is said to be clustering, and vis versa. The Moran’s I returns values which include the z-score and p-value which will indicate if clustering is found in the data or not.
The Optimized Hotspot Analysis (OHSA) tool from ArcGIS Pro used for the hotspot analysis is identifies statistically significant hot and cold spots for multiple testing and spatial dependence using the using the False Discovery Rate (FDR) correction method [101]. The features are grouped into seven major clusters i.e. features in the +/- 3 Gi_Bins were statistically significant at the 99% confidence level; features with 0 for the Gi_Bin field was not statistically significant, those in the +/2 bins reflected a 95% confidence level, and features in the +/1 bins reflected a 90% confidence level. Upon computing these GiZscores where cold spots in all the feature characteristics most likely represent informal settlement buildings, a cross validation test using Independent samples t-test on the hotspot analysis results in order to differentiate between formal and informal zones and to determine whether there is statistical evidence that the associated group means are significantly different between them [102]. The GiZscores for both groups; informal, and formal regions are compared and when the p-value is less than 0.001, the null hypothesis can be rejected and the results of GiZscore can be illustrated as statistically significant [11].
The features identified as cold spots were then reclassified and grouped into one class and all the others as another class, which produces new reclassified results for the feature characteristics of Size, shape and NND. The three reclassified results are combined and if a feature has all its feature characteristics as cold spots, its grouped as informal and if not, its clustered as formal. This produces one resultant cluster dataset for the building features which shows both informality and formality in the Kampala training partition dataset. These results (especially the cold spots) were compared to areas delineated as slums in Kampala generated by a collaboration between Slum Dwellers International (SDI) and other organizations [46, 89].
4.2.2. Classification of Informal Settlements based on Building Characteristics To predict where informal settlement regions are based on building features characteristics of shape, size and NND, based on the clusters from the training partition dataset, supervised machine learning classification was carried out on data of the same city (Kampala Testing Partition) and on data of a different city (Dar-es Salaam). Firstly, the clustering results were
24 applied to train, validate and test several classifier algorithms in order to select one that suits these datasets. Models were built using the python Scikit-learn library, taking advantage of the capabilities and features of this library. These models included Logistical Regression, Decision Tree (DT), Multilayer Perceptron (MLP), Random Forest (RF) and Support Vector Machine (SVM). The choice of these classifiers in based on their use in previous studies to classifier buildings based on their characteristics and also their ability to provide good accuracy with reference to chapter 2. The script involved splitting the Training partition dataset into 70% for training and 30% validation. Classification was performed first on the training data and accuracy measures, including overall accuracy, precision, recall and f-measure were noted. This was carried out in order to select the best classifier for the datasets. The selected classifier is then used to predict which features belong to Informal settlements in Kampala Testing Partition and Dar-es Salaam.
4.3. Monitoring the growth of Informal Settlements
The sentinel- 2 imagery after pre-processing and band composition were clipped to the Kampala Boundary. The acquired informal settlement regions from the classification phase above provides for polygons representing informality. We also assembled polygons for regions representing three categories: “built (without informal)”, “vegetation”, and “water”. All these regions were generated on the 2019 Image (Figure 9). This is based on the assumption that the OSM building outlines used to classify informality were as up-to-date as of October 2019. All the images were then sliced up into equal-sized tiles of 255*255 m to ensure uniformity in the datasets and placed in folders of “Tiles_2019”, “Tiles_2017” and “Tiles_2016” each with 5427 tiles. The tiles were saved as tiff files with attached geo-information which is required to plot the model predictions to the original locations in the map.
25
Figure 9: Informal and Formal Tiles
The tiles in folder Tile_ 2019 were labelled based on the four categories created based on their intersection with the created polygons. All the tiles belonging to “built-up”, “vegetation”, and “water” were grouped into one folder as Formal and the Informal tiles placed in an Informal Folder. Regrouping the four categories into two was more accurate than training a binary classifier directly from the available data. The tiles were then split into training (80%) and testing sets (20%) for model-validation for use in the CNN model.
A baseline CNN model based on general architectural principles of the Visual Geometry Group (VGG) on which other models can be compared is established. The CNN architecture involved stacking convolutional layers with small 3×3 filters followed by a max pooling layer. These layers form a block, and these blocks can be repeated where the number of filters in each block is increased with the depth of the network such as 32, 64, 128, 256 for the first four blocks of the model. Padding is used on the convolutional layers to ensure the height and width shapes of the output feature maps matches the inputs. This function can then be customized to define different baseline models, e.g. versions of the model with 1, 2, or 3 VGG style blocks. The model was fitted with stochastic gradient descent, a conservative learning rate of 0.001 and a momentum of 0.9. Since the problem was a binary classification task i.e Formal and Informal,
26 the prediction of one value of either 0 or 1 was required. An output layer with 1 node and a sigmoid activation was used and the model optimized using the binary cross-entropy loss function. One-block (32 filters), two-block (32 and 64 filters) and three-block (32,64 and 128 filters) VGG models were all compared on the dataset. Two approaches to address overfitting of the training dataset: dropout regularization and data augmentation were explored to select the best suited one. Upon selecting the best model with the adequate model parameters, Predictions were performed on the Independent tile datasets for “Tiles_2017” and “Tiles_2016” to automatically predict informal settlement tiles out of all the tiles. A polygon layer was then built for the new informality tiles. This prediction step leads to tiles that are either formal or not. Polygons of the image tile Boundaries are created and those that belong to informal group are overlaid onto the map for visual interpretation.
27
5. RESULTS
This chapter describes the implementation details of the methodology and presents the results of this study. The source code of this implementation can be found at https://github.com/Bakked9/MastersThesis.
5.1. Clustering Analysis
5.1.1. Clustering Indices for Building Characteristics
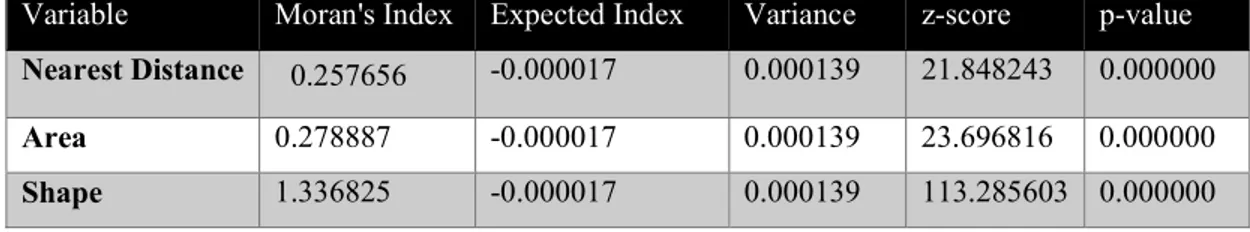
The Moran's Indices for the Area, shape and NND are all close to 0.2, and have p-values of 0.0 (Table 3). The z-score is a standard deviation which measures how many SDs away an element is from the mean, while the p-value is a measure of probability that a random process created the observed pattern. A small p-value is an indicator that the spatial pattern is not random and vis versa. A positive Moran’s I result indicates that neighboring areas or points are similar with respect to attribute values, while negative Moran’s I shows that nearby regions are less similar in attributes than one would expect in a random pattern [103]. This goes to show that clustering exists within the dataset with respect to the measurement variables and hence Hotspot analysis can be carried out on the data.
Variable Moran's Index Expected Index Variance z-score p-value Nearest Distance 0.257656 -0.000017 0.000139 21.848243 0.000000 Area 0.278887 -0.000017 0.000139 23.696816 0.000000 Shape 1.336825 -0.000017 0.000139 113.285603 0.000000
Table 3: Spatial Autocorrelation (Moran's I) Results
5.1.2. Optimized Hotspot Analysis
The optimized hotspot analysis resulted into Gi_Bin fields which identified the statistically significant hotspots, along with the non-significant and cold spots, indicating the type of clusters for the feature characteristics. In the case of the Training partition, the Gi_Bin field showed that patches spread around the selected area was characterized by cold spots, non-significant types, and hotspots types that are distributed allover (Figure 10). The areas identified as non-significant cluster types provide some sort of boundary between the cold and
28 hot spots. Whereas the cold spots were located in a small area mainly on the north and central parts, the hotspot clusters were spread out in on the north, south, east and west sides.
Figure 10: OHSA Results Maps for Size, Shape and NND
5.1.3. The Association between the Cold spots and Informal settlements
Table 4illustrates the results of the t-test analysis, using a 95% confidence level for each feature characteristic. Since the Sig (2-Tailed) values i.e. the p-value for the GiZscore and Nneighbours predictors are very small i.e. p<0.001, we reject the null hypothesis of Levene's test and conclude that the variances in the GiZscore and Nneighbours predictors of Formal is significantly different from that of Informal. The Informal groups mean numbers of neighbors are larger than those of the formal areas. The mean GiZscores are the informal areas are also smaller than those of the formal areas. This shows that the informal regions are more likely to be cold spots with low values of Shape, size and NND.
29 SIZE(AREA) Group N Mean Std. Deviation Std. Error Mean Sig.(2-tailed) GiZScore ColdSpot(Informal) 104884 -4.4855 2.0227 0.0062 0.000 HotSpot (Formal) 36868 3.6859 1.8595 0.0097 Nneighbors ColdSpot(Informal) 104884 958.00 302.407 .934 0.000 HotSpot (Formal) 36868 363.13 129.434 .674
NEAREST NEIGHBOUR DISTANCE (NND)
Group N Mean Std.
Deviation Std. Error Mean Sig.(2-tailed) GiZScore ColdSpot(Informal) 123467 -5.6911 2.8813 0.0082 0.000
HotSpot (Formal) 41942 5.1848 3.3074 0.0161
Nneighbors ColdSpot(Informal) 123467 936.37 281.848 .802 0.000 HotSpot (Formal) 41942 344.97 119.569 .584
SHAPE (VERTEX NUMBER)
Group N Mean Std. Deviation Std. Error Mean Sig.(2-tailed) GiZScore ColdSpot(Informal) 129377 -4.8803 1.9626 0.0055 0.000 HotSpot (Formal) 34552 5.8729 4.6398 0.0250 Nneighbors ColdSpot(Informal) 129377 850.26 319.712 .889 0.000 HotSpot (Formal) 34552 512.44 286.337 1.540
Table 4: Independent samples t-test analysis Results
Cold spots in this analysis represent areas that have low values of Area, Shape and NND. Informal settlements are characterised by buildings that have simple shape, small is size and are densely located in a particular location i.e. short NNDs between polygons (see figure 10). With this, the cold spots resulting from the OHSA are considered to be locations with informality based one the building typologies used to characterise them.
To simplify the data for further analysis, all the OHSA results were classified to bin the data points into two classes i.e. “Informal” and “Formal”. This was done through reclassification of the Gi_bin results with a threshold of -2 or lower (95% cold spot confidence level) as Informality and the rest as formality. As shown in figure 11 and 12, the regions that identified as Informal share common locations across the map with respect to the building typologies. The results were combined to highlight only those areas that had been classified as informality in all the typologies. The resultant dataset was then used as a training set for the Classification step.
30
Figure 11: Buildings Classified as Formal and Informal
31 5.2. Prediction of Informal Settlements using Machine Learning
The training data set was split into train and test to in order to enable training and validation of the models. Table 5 shows the accuracies obtained by training the data with all the algorithms. The highest accuracy was obtained using the Random forest classifier i.e. 89% and the lowest obtained from Logistical regression (74%) and Support Vector Machine (75%). In order to assess the skill of the model on new data, the K-Fold Cross validation was carried out and the Test-split from the original Training dataset (Figure 13). To further assess the performance of the model, a confusion matrix has been computed for the actual and predicted values for each category (formal/informal) for the entire dataset using the pre-trained models for each city, whereas an overall validation accuracy of the entire dataset is also illustrated.
Classifier Accuracy Precision Recall F1-Score
Logistical Regression 0.74 0.54 0.74 0.62 Decision Tree 0.84 0.84 0.84 0.79 Random Forest 0.89 0.88 0.89 0.88 ANN(Multilayer Perceptron) 0.81 0.79 0.80 0.77
Support Vector Machine 0.75 0.56 0.75 0.64
Table 5: Accuracy Assessment of Classifiers
Classifier Logistical
Regression (logreg)
Decision Tree (tree)
SVM Random Forest ANN
Mean accuracy 0.7484 0.8469 0.7484 0.8897 0.7484
Variance 0.0008 0.0193 0.0008 0.0163 0.0168
32
Figure 13: K-Fold Cross Validation of Classifiers
Based on the accuracy assessment results above, the Random Forest Classifier performed better than the other classifiers and hence was used to classify the data in the Kampala testing partition and the city of Dar es Salaam. The prediction accuracies for the two cities (table 6) were good enough to comfortably continue with Analysis
Town Accuracy Precision Recall F1-Score
Kampala_Test Set 0.81 0.80 0.81 0.78
Dar es Salaam 0.79 0.78 0.79 0.78
33
Figure 14: Informal Regions in Kampala (Left) and Dar es Salaam (Right)
The Informal settlement regions in both cities of Kampala and Dar-es-Salaam is shown in figure 14. The informality regions in Kampala are in all four Divisions except the central region. The central region is mainly characterized by already planned areas with planned streets, and mostly elevated buildings from the colonial times. It is also the Central Business District (CBD) where Business and Administration of the city is carried out. This little or no idle land on which informality may grow. For Dar es Salaam Informality is mostly shown in the center of the city across all municipalities. The largest Slum Tandale (located in the south of Kinondoni) was highlighted by the Classifier Model which shows that it is a good enough model.
5.3. Monitoring Informal Settlement Growth
The image tiles representing informal settlements were mostly composed of compact buildings and tiles appear compact with a mixture of brown and light pixels (Figure 15). Tiles comprising of relative dense areas of built-up > 50 percent and vegetation < 30 percent were
34
identified as those overlapping with the Informal regions hence classifying them as
Informal areas. False positives existed in the study area that also comprising of areas of
dense buildings and bare-soil areas due to similarity in pixel intensity. The image tiles used
to train the CNN models as shown in figure 15 show a significant difference between formal and informal regions.
CNN Model Accuracy
(%)
Precision Recall f1-score 1-VGG 84.547 0.704 0.70 0.676 2-VGG 84.327 0.6395 0.74 0.6414 3-VGG 86.534 0.7271 0.77 0.6085 Baseline VGG3 + Dropout 80.353 0.774 0.73 0.6965 Baseline VGG3 + Data Augmentation 90.3 0.8214 0.79 0.7545 Pre-Trained VGG16 68.433 0.5915 0.64 0.5117
Table 7:Accuracy Assessment of CNN Models
The training dataset generated was used as input for training different CNN models after randomly split of 80% (training) and 30% (testing). The models were fine-tuned implementing varying parameters to improve the model. Table 7 summarizes the overall accuracy for each model with the use of a pre-trained VGG16 model achieving the lowest accuracy with 68.433% the second lowest was Baseline VGG3 + Dropout model with 80.353%. The best accuracy was achieved with the 3-block VGG model combined with Data Augmentation i.e. 90.3%. The three VGG-based architectures offer improved performance with increase in capacity. Since the training dataset was small, artificially expanding its size by creating modified versions of images (Image Data Augmentation) improved the accuracy of the model. The predictions made on the new images for the years 2016 and 2017 produced promising results for predicted tiles as Formal and Informal (Annex 8.3). Tiles that were predicted with a probability of ≥ 70% as informal were all considered as belonging to informal regions. This was done to avoid inclusion of a lot of tiles with mixed categories especially because most boundaries between the categories are fuzzy in nature.
Annex 8.3 show the image tiles predicted as Informal settlements, represented as polygons. With visual inspection, the quantity of polygons increased through the four-year period. Informal settlements grew outwards to the neighbouring image tiles over the years. The
North-35 eastern and central parts of the study area have the least concentration and change in informal settlement regions. Since the central region is the CBD of the city, it also experiences limited development of Informal settlements over the period of time.
Informal Formal Informal 2016
Formal Informal Informal
2017
Figure 15: Classified Image Tiles
Figures 16 shows the changes of informal regions from 2016 to 2019. The maroon squares represent informal regions in January 2016, whilst the pink squares represent informal regions that developed by August 2017 and the cream squares represent informal regions that developed by the end of December 2019. The expansion of informal settlement regions is evident in areas Namuwongo and Bwaise. The map shows that the relative location of informal regions has not changed over time even if they now occupy more land. Informal regions remain on the fringes of the city.
36
Figure 16: Change in Informal Settlement Regions in Kampala. This shows Informal tiles that existed in January 2016, new informal tiles that had developed by August 2017 and also by December 2019.
![Figure 1: Informal Settlements In Africa [7, 8]](https://thumb-eu.123doks.com/thumbv2/123dok_br/15196155.1017451/13.918.150.732.821.998/figure-informal-settlements-in-africa.webp)
![Figure 2: Machine Learning Cheat Sheet [73]](https://thumb-eu.123doks.com/thumbv2/123dok_br/15196155.1017451/24.918.166.747.479.805/figure-machine-learning-cheat-sheet.webp)

![Figure 7: Distribution of Informal Settlements in Kampala based on Average Household Size [97]](https://thumb-eu.123doks.com/thumbv2/123dok_br/15196155.1017451/32.918.206.714.649.994/figure-distribution-informal-settlements-kampala-based-average-household.webp)