CROWN DELINEATION INFLUENCE ON STANDING VOLUME CALCULATIONS IN
PROTECTED AREA
K. Stereńczak*, S. Miścicki,
Department of Forest Management, Geomatics and Economics, Faculty of Forestry, Warsaw University of Life Sciences – SGGW, 159 Nowoursynowska str., PL-02-776 Warszawa, Poland.
* Corresponding author e-mail: [email protected]
Commission VIII, WG VIII/7
KEY WORDS: Forestry, LIDAR, Inventory, Crown Delineation, Protected Area
ABSTRACT:
The aim of this study was to evaluate the automatically determined parameters of tree crowns, which are then used in two-phase inventory method of growing stock. Research was performed in forest stands of different age, located in the Stolowe Mountains National Park (south-western Poland) where the dominant species was Norway spruce (Picea abies L.). On the test area
of approximately 500 hectares, 35 sample plots were measured. On LIDAR-based Crow Height Model (CHM), in the places corresponding to the position of 500 m2 circular ground samples, automatic segmentation was carried out. The extent of the crown was associated with the height of the tree. Two variants of the assigning separate crowns in the sample were used: (1) according to the centroid position, (2) according to the location of any fragment of the crown inside the sample plot boundary. In each of the variants five series of measurements with different relative height of the range 0.65-0.8 (with a gap of 0.05) were carried out. Relationship between the volume of living trees measured on the ground and LIDAR parameters (average height of trees and tree canopy projection area) automatically measured based on CHM was determined. Multiple correlation coefficient differed depending on the location to extract coverage crowns and ranged from 0.687 to 0.788. The variant of counting of all trees with crowns or pieces inside the sample appeared to perform better. The relationship between the above-indicated characteristics was stronger after elimination of dead trees (about 0.1 for each of cases). This means that for measurements of the growing stock in forests under protection, it is necessary to improve the process of automatic segmentation of the crown, by identification and elimination of dead trees – usually present at sample plot.
1. INTRODUCTION
1.1 General Instructions
Airborne Laser Scanner (ALS) have been used for environment study for almost 20 years now (Baltsavias, 1999a, 1999b). Lot of different applications and research was done so far. Number of publications about using of ALS passed in the thousands per year. It is even impossible to read them all. Main forest parameters received with LIDAR data are: tree height (Nilsson, 1996; St-onge et al., 2004; Stereńczak and Zasada, 2011), volume (Naesset, 2002; Maltamo, 2004; Hollaus et al., 2007), biomass (Lefsky et al., 1999; Popescu et al., 2011) and many others (Næsset et al., 2004). Analysis can be based on a sample plot level or single tree level (Yu et al., 2010). Single tree detection methods were studded from very beginning. There were a lot of methods described in the literature. Two test carried out to compare different methods (Kaartinen and Hyyppä, 2008; Vauhkonen et al., 2010) proved that single tree methods give the best results for stands for which were developed. If we would like to receive the best results, algorithms have to be parameterized additionally regarding to specifying stands structure and species composition.
1.2 Tree Crown Delineation
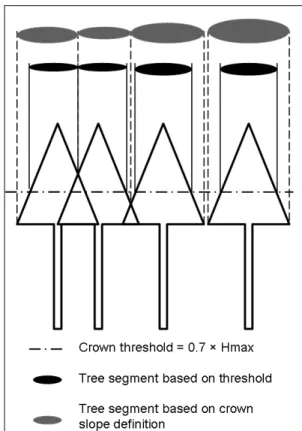
Airborne Laser Scanner (ALS) was used for environment study but one from unsowed problem yet is properly crown definition. Many of them were already described (Kaartinen and Hyyppä, 2008). Figure 1 presents difference between crowns segments defined based on methods concentrating on slope of the crown
surface and based on threshold, below which pixels are removed and not concerned as part of the crown.
Figure 1. Tree crown delineation philosophy and its influence on crown segment size
The trees of the same size, just in a different relation to each other, can be delineated in very different way. As it can be noticed, depending on delineation philosophy, crown size can significantly change. Trees in stands growing usually very close to each other, they branches penetrate each other and interindividual competition cause different crow deformation. So even for single species monoculture stands, accuracy of tree detection and crown delineation vary regarding to stocking size and species.
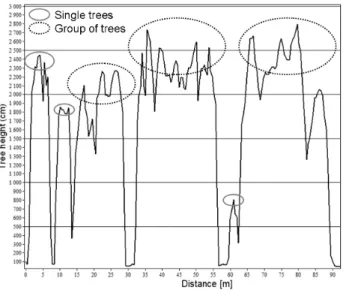
Most commonly Crown Height Model (CHM) is used for crown delineation. It is always some kind of approximation of real tree crown surface, interpolated in different way depended of used algorithm. As we can see relations tree to tree is very different (Fig. 2) and depends especially on density.
Figure 2. Forest stand cross-section in CHM
All methods of crown delineation have some disadvantages because just single growing trees crowns can be described accurately. If trees are merged together it is impossible to detect right shape of crown.
Additionally, paradigm of forest silviculture is changing to sustainable forest management. Forests are changing in many areas from pine or spruce monocultures into stands with more complex species composition, age and height structure. This will cause additional problems.
1.3 Motivation and aims
Detection and accurate determination of tree segments influence volume or biomass estimation (Popescu et al., 2003; Kwak et al., 2010). Figure 1 presents method used in the study to delineate crown segments. Motivation behind this philosophy was that height threshold cause smaller segment variations, than other methods. This follows from the fact that we observe a higher part of the tree, which often is not distorted by neighborhood with other trees, while their shape is proportional to the size of the tree (Fig. 2).
Aim of the study was to find the best selected height threshold and sampling rule for standing volume calculations in protected area.
2. MATERIALS AND METHODS
2.1 Study area
Area of interest is situated in The Stolowe Mountains National Park (south-western Poland, near the border with Czech Republic). Created in 1993, the Park covers an area of 63.39 km², of which forests accounts for 57.79 km². Forested regions are covered mainly by Norway spruce (Picea abies L.).
Spruce stands within the park are in the poor health condition. Spruce monocultures are very susceptible to the adverse effects of many abiotic and biotic factors. Deciduous forests originating from natural regeneration are preserved only in small fragments in an inaccessible area.
2.2 Field data
The terrestrial measurements were performed during July 2009 by the team of TAXUS SI. Permanent circular sample plots with a radius of 12.62 m were distributed in a systematic grid arrangement each 400 meters on the entire area of the Stolowe Mountains NP. Coordinates of each plot’s centre were measured using DGPS method. All living and dead trees with dbh≥8 cm inside the sample plot were measured.
2.3 Airborne Laser Scanner Data
Data acquisition was performed in August 2008 using Altman's Optech 3100 system installed on the board of Cessna 206 plane. The main system components are: scanner with LIDAR sensor head, data storage devices, laptop and remote display. The position and orientation of the system during the flight was carried out with a set of Applanix POS-AV 510, which consists of a system that combines a standard geodetic dual-frequency GPS receiver and high-end inertial recorder deflection and rotation angles (Inertial Measurement Unit - IMU).
Sensor type Optech 3100 Flight height 700 m Data recording Up to 5 echoes Scanning angle +/- 18°
Scan frequency 100 kHz
Table 1. ALS data characteristics
Digital surface models were generated using TreesVis Software (FELIS, Germany).
2.4 Volume calculations
The volume of each sampled tree was calculated using formulae currently applied in the planning of forest management in Poland (Bruchwald et al., 2000). Stem volume was assumed to be the volume of ‘merchantable timber’ and the lower dbh threshold was taken to be 8.0 cm. Plot volume – divided into the ‘volume of living trees’ and the ‘volume of dead trees’ – was derived as a sum of the individual trees. Results obtained from the ground measurements were used as reference data.
2.5 Single tree segmentation
Segmentation was conducted in Halcon MVTec software, in the following way:
a) 0.5 m resolution Canopy Height Model (CHM) was loaded; b) Median filter was applied (circle, 1 pixel radius);
c) Primary segmentation was carried out;
d) Segments which shape is not similar to tree were connected to neighboring segments, according to the condition: diameter ratio of the ellipse described on crowns extends beyond the range 0.3-3);
e) Layer heights are determined (automatically or manually); f) Primary segments are allocated to the height layers; g) After allocation the segments are combined;
h) While there are more than one height layer, those from one height layer are grouped as separate spatial objects (groups of primary segments – stands/parts of the stands with similar height/crown size);
i) Height layers are re-filtered using Gaussian filter, of varying sizes - the higher layers of larger and lower smaller; j) In this case three groups were established - the height limit
was 28 m and 16.6 m, filter size of 7, 5 and 3 pixels, respectively, for layer heights;
k) After this segmentation average area of each tree segment were determined. If the crown had a surface area greater than the mean + standard deviation, it was again filtered Gaussian filter of 2 pixels less at first and segmented one again.
l) Segments which shape is not similar to tree were connected to neighboring segments, according to the condition: diameter ratio of the ellipse described on crowns extends beyond the range 0.33-3.5);
m) For every final segment, based on maximum height from CHM was determined and pixels below 0.7×Hmax were removed
For final segments such parameters as maximum height (Hmax), minimum height (Hmin) and crown radius (Cradius) were calculated.
Based on these characteristics, the mapped forest fragments, which corresponded to the size and location of the ground sample plots, the following characteristics were calculated: the number of trees (NT), total tree height (SUMH), average tree height (HA), the sum of crown projection area (CAR), the sum of crown volume (VC). The crown volume was taken as a cone with base equal to the projection of the crown and height such as the length of the crown. All the features were related to trees with a minimum 7 m height. Dead trees were removed based on orthophoto interpolation.
2.6 Variants comparison
In the study the extent of the crown was associated with the height of the tree (Fig. 1).
max
H i
C= × (1)
where:
C = crown extend CHM value
Hmax = maximum CHM value inside final single tree region
i = tested threshold height
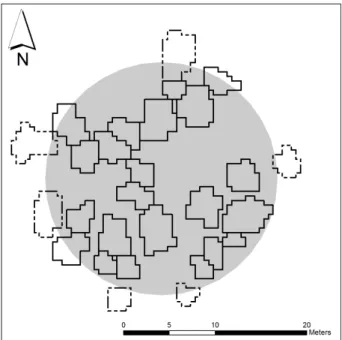
In the presented study the test based on 34 sample plots was carried out. Two variants of the assigning separate crowns in the sample were used: (1) according to the centroid position (‘centroid’), (2) according to the location of any fragment of the crown inside the sample plot boundary (‘touch’) (Fig. 3). In each of the variants five series of measurements with different relative height of the range 0.65-0.8 (with a gap of 0.05) were carried out.
For each selected height threshold and sampling rule calculated correlation between the volume of live trees (field
measurements) and the features measured based on LIDAR data. Set of features was determined on the basis stepwise regression with the backward elimination model. The best solution was chosen based on the highest value of correlation (R).
Relationship between the stock volume of trees measured on the ground and LIDAR parameters based on CHM was determined in first set. Due to impact of dead trees, in second analysis, dead trees were excluded from analysis. All calculations were conducted using STATISTICA 8 (StatSoft, Inc.)
Figure 3. Results of two sample rules based on centroid (polygons (trees segments) with solid line) and ‘touch’ (polygons (trees segments) with dashed line and with solid line)
based on sample plot area (gray circle with 12.62 m radius)
3. RESULTS
3.1 Segmentation accuracy
Accuracy evaluation was carried out in 9 different stands, on 5 sample plots. Photogrammetric measurements were performed in the DEPHOS photogrammetric station, and were used as a reference data. The spatial resolution of the images was 0.15 m. The accuracy of the segmentation obtained for spruce was 82.3%. The species specific segmentation process correctly detected 1156 of 1404 trees located in the stands from 27 to 110 years old. The 186 trees (13.3 %) were not detected and the 62 tree peaks (4.4 %) identified during stereo photogrammetric observations were removed due to the occurrence of two vertices of a tree in a single segment. In presented test segmentation properties were not species specific, but general (described in 2.5 section). This can cause a little worse detection rate, and accuracy about 75 % (visual comparison both segmentation results).
3.2 Volume analysis
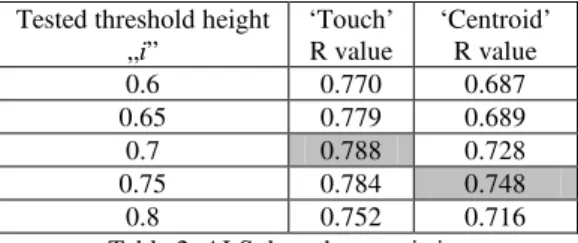
Strength of the correlation between the volume of trees (defined on the ground) and the characteristics of the LIDAR data set was greater in the variant "touch". Optimal cut was in this case the relative tree height of 0.7-0.75 (Tab. 2). In ‘centroid’ variant, strength of association was slightly smaller, and it was the best cut for the relative height of 0.75.
Tested threshold height „i”
‘Touch’ R value
‘Centroid’ R value
0.6 0.770 0.687
0.65 0.779 0.689
0.7 0.788 0.728
0.75 0.784 0.748
0.8 0.752 0.716
Table 2. ALS data characteristics
Whatever the variant was, in depended variables, best explanation of volume were given by: SUMH, VC and CAR. For ‘centroid’ variant and relative tree height equal 0.75 these variables had following values and correlation coefficients.
Parameters Value p
The free term 88.5 0.25
SUMH (m×sp_area-1) 0.728 2.71E-03 VC (m3×sp_area-1) 0.270 1.07E-05 CAR (m2×sp_area-1) -2.66 1.07E-03 Area of a sample plot: sp_area = 500 m2
3.3 Volume improvements after dead trees removal
Rejection of dead trees from the analysis, resulted with greater strength of correlation (Fig. 4). In variant of ‘centroid’, where applied cut was 0.75 of maximum tree height, the correlation coefficient was R = 0.849 (0.748 without dead wood exclusion). The parameters of the equation and their importance were as follows:
Parameters Value p
The free term 9.319 0.88
SUMH (m×sp_area-1) 0.825 6.90E-03 VC (m3×sp_area-1) 0.605 1.20E-05 CAR (m2×sp_area-1) -2.65 1.88E-02
SUMH*VC -0.00042 3.21E-02
Area of a sample plot: sp_area = 500 m2
Figure 4. Determination value between live trees volume calculated based on field measurements and calculated from LIDAR based characteristics (SUMH, VC, CAR, SUMH×VC)
4. DISCUSSION AND CONCLUSIONS
Segmentation results were comparable with that received in other studies (Vauhkonen et al., 2010). Analyzed area is very rough regarding to complicated and varied Digital Terrain Model and large number of dead trees.
Based on regression analysis it was proved that variant ‘touch’ is better for volume calculations than ‘centroid’. This unexpected finding can be cause by larger than 500 m2 real plot size. In addition using GPS measurements caused additional error in sample plot locations. This influenced results, especially in stands with large differences in spatial forest structure (for example: with variation in trees density and height).
Used models are well fitted. Received correlation is comparable with other study for Norway spruce (Maltamo et al., 2004; Hollaus et al., 2007). Received results are very promising especially in context of difficult forest species and spatial composition as well as rough terrain in the study area.
Results proved need for single tree delineation and its parameters extraction. It is due to fact that the best correlation between LIDAR based volume and field measurements was based on: sum of crown volume, sum of tree heights and the sum of crown projection area respectively. Regarding to this last parameter, single tree detection is of little importance.
Correlation between volume based field measurements and based on LIDAR characteristics was much higher when dead trees were excluded from analysis. It is especially important for protected areas where dead trees are quite frequently part of the environment, and their spatial location is very inhomogeneous. Future works will be concentrated on additional sample plots location corrections and finding suitable method for dead trees exclusion. Incorrect spatial correspondence between orthophotos and LIDAR based CHM, causes problems in automatic methods for dead trees detection. Additionally lack of accurate Georeferencing between datasets, decrease the value of correlation between compared variables and increase the error of performed analysis.
5. REFERENCES
Baltsavias, E.P., 1999a. Airborne laser scanning : basic relations and formulas. ISPRS Journal of Photogrammetry and Remote Sensing 54, 199-214.
Baltsavias, E.P., 1999b. A comparison between photogrammetry and laser scanning. ISPRS Journal of Photogrammetry and Remote Sensing 54, 83-94.
Bruchwald, A., Rymer-Dudzińska, T., Dudek, A., Michalak, K., Wróblewski, L., Zasada, M., 2000. Empirical formulae for defining height and dbh shape figure of thick wood. Sylwan. 144 (10), 5-13 (in Polish with English summary).
Hollaus, M., Wagner, W., Maier, B., Schadauer, K., 2007. Airborne Laser Scanning of Forest Stem Volume in a Mountainous Environment. Sensors 7, 1559-1577. Kaartinen, H., Hyyppä, J., 2008. Tree Extraction. SDI Raport. Kwak, D.-A., Lee, W.-K., Cho, H.-K., Lee, S.-H., Son, Y.,
Kafatos, M., Kim, S.-R., 2010. Estimating stem volume and biomass of Pinus koraiensis using LiDAR data. Journal of Plant Research 123, 421-432.
Lefsky, M.A., Harding, D., Cohen, W.B., Parker, G., Shugart, H.H., 1999. Surface Lidar Remote Sensing of Basal Area and Biomass in Deciduous Forests of Eastern Maryland , USA. Remote Sensing of Environment 67, 83-98. Maltamo, M., 2004. Estimation of timber volume and stem
density based on scanning laser altimetry and expected International Archives of the Photogrammetry, Remote Sensing and Spatial Information Sciences, Volume XXXIX-B8, 2012
tree size distribution functions. Remote Sensing of Environment 90, 319-330.
Maltamo, M., Mustonen, K., Hyyppä, J., Pitkänen, J., Yu, X., 2004. The accuracy of estimating individual tree variables with airborne laser scanning in a boreal nature reserve. Canadian Journal of Forest Research 34, 1791-1801. Naesset, E., 2002. Predicting forest stand characteristics with
airborne scanning laser using a practical two-stage procedure and field data. Remote Sensing of Environment 80, 88-99.
Nilsson, M., 1996. Estimating tree heights and stand volume. Remote Sensing of Environment 56, 1-7.
Næsset, E., Gobakken, T., Holmgren, J., Hyyppä, H., Hyyppä, J., Maltamo, M., Nilsson, M., Olsson, H., Persson, Å., Söderman, U., 2004. Laser scanning of forest resources: the nordic experience. Scandinavian Journal of Forest Research 19, 482-499.
Popescu, S.C., Wynne, R.H., Nelson, R.F., 2003. Measuring individual tree crown diameter with lidar and assessing its influence on estimating forest volume and biomass. Canadian Journal of Remote Sensing 29, 564-577. Popescu, S.C., Zhao, K., Neuenschwander, A., Lin, C., 2011.
Satellite lidar vs. small footprint airborne lidar: Comparing the accuracy of aboveground biomass estimates and forest structure metrics at footprint level. Remote Sensing of Environment 115, 2786-2797. St-onge, B., Jumelet, J., Cobello, M., Véga, C., 2004.
Measuring individual tree height using a combination of stereophotogrammetry and lidar. Canadian Journal of Forest Research, 34, 2122-2130.
Stereńczak, K., Zasada, M., 2011. Accuracy of tree height estimation based on LIDAR data analysis. Folia Forestalia Polonica 53, 123-129.
Vauhkonen, J., Ene, L., Gupta, S., Heinzel, J., Holmgren, J., PitkÄnen, J., Solberg, S., Wang, Y., Weinacker, H., Hauglin, K.M., Lien, V., Packalen, P., Gobakken, T., Koch, B., Næsset, E., Tokola, T., and Maltamo, M. 2010b.
Comparative testing of single-tree detection algorithms. In
Proceedings of SilviLaser 2010, the 10th International Conference on LiDAR Applications for Assessing Forest Ecosystems, 14–17 September 2010, Freiburg, Germany. Yu, X., Hyyppä, J., Holopainen, M., Vastaranta, M., 2010.
Comparison of Area-Based and Individual Tree-Based Methods for Predicting Plot-Level Forest Attributes. Remote Sensing 2, 1481-1495.
6. APPENDIX
The presented work was performed under the project N N309 111937 "Development of methods of measurement of forest resources by using airborne laser scanning (a case of the protected mountain area)" Funded by the Polish Ministry of Science and Higher Education (2009-2012).