Improving cost efficiency in healthcare
supply chain organizations to increase
quality: assessment of the creation of a
Group Purchasing Organization in the
Portuguese Healthcare System.
Eduardo Bobone Villax - 152116281
Dissertation written under the supervision of Prof. Inês Mendonça.
Dissertation submitted in partial fulfilment of requirements for the MSc in Management with Specialization in Strategy and Entrepreneurship, at
Universidade Católica Portuguesa. May 2018
2
Abstract
Title: Improving cost efficiency in healthcare supply chain
organizations to increase quality: assessment of the creation of a
Group Purchasing Organization in the Portuguese Healthcare System.
Author: Eduardo Villax
One of the biggest challenges that the healthcare industry faces today is the accentuated growth of operating costs. Fighting this growth cannot be done without taking into account the quality of services provided in healthcare units. Improving cost efficiency through the implementation of more efficient and effective purchasing strategies is one way to reduce costs.
The first objective of this dissertation was to understand the link between supply chain cost efficiency and quality in healthcare organizations taking the
Portuguese Healthcare System as an example. The second objective was to assess the potential of increasing quality through cost reduction that the creation of a Group Purchasing Organization could have in the Portuguese Healthcare System. An analysis of the evolution of costs between 2011 and 2017 was made with secondary data from financial and operational reports made available by the Portuguese Healthcare System. It was found that positive variations in cost efficiency can generate positive variations in quality and therefore new
purchasing strategies should be addressed to strengthen this linkage. Regarding the implementation of a Group Purchasing Organization, an analysis of the current purchasing model and its capacity to save financial resources was undertaken. It was concluded that the creation of a Group Purchasing Organization could increase quality due to its potential to save money and therefore boost cost efficiency.
Key words: Healthcare Supply Chain; Cost Efficiency; Quality; Group Purchasing Organization.
3
Resumo
Titulo: Melhorar a eficiência de custos na cadeia de abastecimento
dos hospitais para aumentar a qualidade: avaliação da criação duma
Organização de Compras de Grupo no Serviço Nacional de Saúde
Português.
Autor: Eduardo Villax.
Um dos maiores desafios que o setor da saúde enfrenta atualmente é o crescimento acentuado dos custos operacionais. Tentar inverter esse crescimento não pode ser feito sem ter em conta a qualidade dos serviços prestados nas unidades de saúde. Melhorar a eficiência de custos através da implementação de estratégias de compras mais eficientes e eficazes é uma das formas de reduzir custos.
O primeiro objetivo desta dissertação foi compreender a relação entre eficiência de custos na cadeia de abastecimento e qualidade nas organizações de saúde, tendo como exemplo o Serviço Nacional de Saúde Português. O segundo objetivo foi avaliar o potencial de aumento da qualidade através da redução de custos que a criação de uma Organização de Compras de Grupo (ou central de compras) poderia ter no Serviço Nacional de Saúde Português.
Uma análise da evolução dos custos entre 2011 e 2017 foi feita com dados secundários de relatórios financeiros e operacionais disponibilizados pelo Serviço Nacional de Saúde Português. Verificou-se que variações positivas na eficiência de custos podem gerar variações positivas na qualidade e, portanto, novas estratégias de compra devem ser abordadas para fortalecer essa ligação. Em relação à implementação de uma Organização de Compras de Grupo, foi realizada uma análise do atual modelo de compras e sua capacidade de poupar recursos financeiros. Concluiu-se que a criação de uma Organização de Compras de Grupo poderia aumentar a qualidade devido ao seu potencial para poupar dinheiro e, portanto, aumentar a eficiência de custos.
Palavras-chave: Cadeia de Abastecimento de Saúde, Eficiência de Custos, Qualidade, Organização de Compras de Grupo.
4
Acknowledgements
I would like firstly to really thank my supervisor in this dissertation, Professora Inês Mendonça to have gone through this long process together with me. More than a supervisor, Professora Inês Mendonça was a very helpful and available person that gave me motivation to go until the end and never quit.
To my parents for all the love and the possibility of pursuing this Masters degree at a top university such as CATOLICA LISBON.
To all my friends that have gone through this amazing two year experience with me, you guys are epic and without you this wouldn’t have been the same.
Finally, I can’t finish this paragraph without thanking my colleagues at SONAE MC that gave loads of motivation every day that I started writing my dissertation after long and intensive days of work.
5
Table of Contents
Abstract ... 2 Resume ... 3 Acknowledgments……….………4 Table of Contents………...5 Table of Figures………..6 List of abbreviations………..7 I. Introduction……….………..………...8 1. Problem Statement……….………..………..8 2. Research Questions……….8 3. Topic presentation………...………8 4. Methodology……….11II. Literature Review……….12
1. Supply Chain Management………...………12
1. Global Supply Chain Management (costs, types of waste)……….…..12
2. Healthcare supply operations………...……13
3. Commercial supply chains VS healthcare supply chains………..15
2. Quality Management in Healthcare……….…….……….15
1. Definition and levels of quality………15
2. Managing quality in healthcare………16
2.1 Quality control………...16
2.2 Relationship between costs and quality……….17
2.3 Financial ratios and metrics……….….19
2.4 Performance indicators………21
3. Collaborative purchasing………...22
1. Definition of Group Purchasing Organization (GPO)………22
2. Advantages and disadvantages of GPOs………...23
3. Group Purchasing organizations in Portugal Healthcare System………24
III. Methodology and Data Collection………...……….27
1.Study design………...……….27
1.1 Contextual overview………27
1.2 Scope of the study……….27
2. Data Collection……….28
2.1 Relation between costs and quality………..28
2.2 Current model performance………...………..29
IV. Results………..………30
1, Quality indicators……….………..30
1.1 Readmission rate………....30
1.2 Consultations provided in a timely manner………...…………31
1.3 Delay time until surgery……….33
2. Cost indicators………...……….34
2.1 Cost per medicine package……….………..34
2.2 Mix of costs incurred by the PHS and by the patient with medicines……….35
3. Current model overview and performance……….…...…37
3.1 Evolution of framework agreements………..37
6
V. Conclusion and future research………..………..40
1. Evolution of costs………...…40
2. Evolution of quality……….………….…41
3. Relation between quality and costs………...…….41
4. Evolution of the current purchasing model performance………...……….42
5. The opportunity of a GPO in the Portuguese Healthcare System……….43
6. Limitations and future research………...……44
Appendix……….………..……….46
References………..………..48
Table of figures
Figure A: Theoretical relationship between quality and costs………18Figure B: Money does not necessarily buy quality………..19
Figure C: Key healthcare financial ratios………...…20
Figure D: Readmission rates per periods of 30 days in Portuguese Healthcare System units………30
Figure E: Percentage of consultations provided to patients within the maximum guaranteed time between 2013 and 2017………..………..….32
Figure F: Delay time until surgery between January 2013 and October 2017…….33
Figure G: Total cost of medicine packages between 2011 and 2018 for generics and in-house used medicines………..………..….…..34
Figure H: Average price per medicine package between 2011 and 2017………..……35
Figure I: Mix of costs of in-house medicines between 2011 and 2017 …………..…....36
Figure J: Percentage of in-house medicines total cost incurred by each stakeholder between 2011 and 2017………..…36
Figure K: Evolution of framework agreements between 2014 and 2018……….37
Figure L: Purchasing activity of the SPMS from 2014 to 2017………..39
Figure M: Purchasing procedures of the SPMS in the Portuguese Healthcare System………...42
7
LIST OF ABBREVIATIONS.
Accronym
Full Denotation
GPO Group Purchasing Organization
PHS Portuguese Healthcare System
SPMS Serviços Partilhados do Ministério da
8
I. Introduction
1. Problem statement.
This thesis aims at understanding the link between supply chain cost
efficiency and quality in healthcare organizations, and assess the
potential of the creation of a Group Purchasing Organization in the
Portuguese Health System to increase quality through cost reduction.
2. Research Questions.
1: What is the link between supply chain cost efficiency and quality in
healthcare?
2: What is the potential of the creation of Group Purchasing
Organization to increase quality through cost reduction in the
Portuguese Healthcare System?
3. Topic presentation.
Quality in healthcare organizations is very important to ensure customer’s safety and satisfaction. Monitoring several performance indicators through the
collection of massive amounts of data and the continuous improvement of these indicators is fundamental to keep an effective and trustful quality system. Quality in healthcare organizations is mostly defined as the aspect that has to deal with care levels compliance to sector regulations, attention and respect of commitments to users by the organizations (Kwon et al., 2016). This definition aims at providing the best quality healthcare services to the end user. One way of improving quality is by increasing the efficiency of healthcare organizations supply chain that will boost cost efficiency and resource availability. Boosting cost efficiency will allow to release financial resources to invest in other areas. Regarding resource availability, the improvements can tackle problems related
9
with equipment and supplies such as missing, malfunctioning and calling for cumbersome processes to acquire (Mendonça, 2017).
Supply chain inefficiencies are very costly and even if this theme has recently attracted attention by scholars, researchers and government officials, the Pricewaterhouse Health Research Institute reported that in 2008, $1.2 trillion out of $2.2 trillion in healthcare spends is a waste of money (Kavilanz, 2009). Considering that the United States is the world’s leading economic power (Investopedia, 2017), there is surely room for improvement in these numbers. For many years healthcare supply chains were considered different from commercial supply chains (e.g. manufacturing companies, global service providers) and as consequence we have today an important gap between
healthcare and commercial supply chains (Kwon et al., 2016). This gap is mainly explained by the fact that commercial supply chains evolved more and faster due to the adoption of innovative and powerful supply chain tools such as Vendor Management Inventory (VMI) or Collaborative Planning Forecast Replenishment (CPFR). Some of these tools were also introduced in healthcare supply chains but in the wrong timings: late and slowly.
Cooperative purchasing is a procedure that consists in the cooperation of two or more organizations in the purchasing process, usually in the same industry, by sharing purchasing volumes, market information and demand resources (Burns & Lee, 2008; Schotanus & Telgen, 2007; Bakker et al., 2008). This cooperation results in the creation of a Group Purchasing Organization (GPO) that typically increases integration and purchasing centralisation (Monczka et al., 2010). This technique is widely spread across the world: over 70% of healthcare spends are managed through GPOs (Kwon et al., 2016). But in Portugal and particularly in the National Healthcare System, there has been very little or unsuccessful adoption (Rego et al., 2013).
Considering the heavy cost structure of healthcare supply chains and the
importance of cost containment without compromising quality, we will address the two research questions presented above in the context of the Portuguese National Healthcare System. The objective will be to understand what is the link between costs incurred by healthcare organizations and the quality of services provided. The second objective of this study will be to understand the potential
10
that the creation of a Group Purchasing Organization in the Portuguese Healthcare System would have to increase quality through cost reduction. The managerial relevance of this topic stands in the need of continuously improve healthcare operations and particularly those that are more cost intensive: supply costs accounted for 30% to 40% of total operational costs of the Portuguese National Health System in 2009 (INFARMED, 2012). Thus, introducing collaborative purchasing in healthcare supply chains through the creation of GPOs has proven its effectiveness in containing rising costs by reducing product prices in two ways: through pooled purchasing leverage of hospitals buying products on nationwide contracts and through the
establishment of price ceilings beneath which hospitals negotiate on their own (Burns et al., 2008; Monczka et al., 2010).
The scope of this work will be the whole Portuguese National Health System and particularly the supply chain of the healthcare units that compose it. We intend to analyse supply chain operations starting in the demand points that lead to order placements and negotiation with suppliers until the entry of material in the warehouse. This may also include inventory management inside the
warehouse. We will be treating both the supply of pharmaceuticals and medical-surgery materials (consumables), and the associated services needed to provid care.
In the outline of this dissertation, there will be five main chapters. After this introductive chapter, a literature review will be conducted on relevant subjects for our topic such as supply chain management in the healthcare industry, quality management in healthcare and collaborative purchasing. This chapter will also include an overview of the Portuguese National Healthcare System. In chapter 3, there will be a data collection process in order to get answers to our research questions and to draw conclusions of these. The analysis of the results obtained will be provided in chapter 4. The last chapter will focus on the main conclusions of our research, give insights about the limitations found during the study and propose ideas for future research.
11
4. Methodology.
Considering our first objective of understanding the link between supply chain cost efficiency and quality in healthcare organizations, we will make use of
secondary data such as the financial records of hospitals and operational reports. This data should be easily accessible because it is provided by the Portuguese government and it is for public access.
Regarding the implementation of a Group Purchasing Organization and its effect on quality, secondary data will be collected in order to understand the current operation of the Portuguese Health System in terms of purchasing activities and its performance.
A deductive approach will be used through this study to compare the data collected within different period and to draw conclusions that answer to the presented research questions.
12
II. Literature Review
1. Supply Chain Management
1.1 Global Supply Chain Management (costs, types of waste)
The Institute for Supply Management defines supply chain management as “the identification, acquisition, access, positioning, management of resources and related capabilities the organization needs or potentially needs in the attainment of strategic objectives. Looking at the narrower and more customer-centric definition, supply chain management is the sum of total operations performed and the parties that execute them, direct or indirectly, to produce and deliver a customer request (Kros & Brown, 2013).
All the activities completed along the supply chain have direct or indirect costs associated that have an important impact in a company’s performance. Above, we briefly resume the different costs that apply both for companies that deliver goods and companies that deliver services.
The acquisition cost of a product is the price paid by the company for a certain item. This price can be subject to a discount of quantity, as we will see in part III of this chapter.
Transport is responsible for the movement of physical goods between points in the supply chain. Shipping costs, incurred with the transportation of goods between the producer and the company, account for the majority of
transportation costs. The importance of these costs is highly affected by the transportation type chosen: rail, road, water, air or pipeline (Waters, 2003) After transportation, there is need to keep the inventory in a safe place and storage costs are incurred. These are all the costs associated to stock that is stuck in the warehouse. There are fixed costs such as facility leases, insurance and owned equipment. Variable costs are those associated with travel distances, touches and paper (handling costs) (Minghini 2016). This is where much can be
13
done to boost efficiency in the warehouse by optimizing routes and reducing the number of times that an employee touches the same pallet, and by replacing paper by electronic devices.
According to Ohno (1988), waste refers to all elements of production or service provision that only increase costs without adding value, that is, the activities that do not add value from the customer perspective but are performed within the production process. Suzaki recognized 7 sources of waste that should be eliminated (Askin & Goldberg, 2002): waste from overproduction, waste of motion, transportation waste, processing waste, wasted time (queuing), defective products and excess inventory. Reducing waste in the supply chain reduces costs and employees’ workload while improving global efficiency. Even in industries with very complex process specifications and compliances rules such as healthcare, there is room for waste reduction.
1.2 Healthcare supply operations.
“The operations and supply function in hospitals has historically been viewed as having a limited scope, many times falling under the term materials
management” (Kros and Brown, 2013). This reality has been changing over the last 15 years and an increasing number of hospitals have been implementing supply chain tools to modernize their supply systems. Nevertheless, there is still room for improvement. For example, this sector is operating heavily Less Than Truckload (LTL) in the domain of transports and distribution; more than 50% of the operations are performed LTL which increase costs and the probability of damaging materials. Warehouse utilization rates are as low as 60 to 70 % of the capacity and stock rotation rate is only 2 times against for example 44 times in consumer electronics (Dooner, 2014). Regarding the logistic cost, the healthcare industry is one of the biggest consumers in this field with the latter accounting for 38% of the total expense while the same is 5% for the retail industry and 2% for the electronic industry (Johnson, 2015). The logistic cost is not the only big challenge in healthcare supply chains as this industry must also follow very strict rules when transporting pharmaceutical material.
14
Healthcare supply chains face rigorous regulatory requirements in the
distribution process of pharmaceuticals to ensure the quality of these from the manufacturer until reaching the warehouse in the hospital. All the companies dealing with pharmaceutical products must follow the Good Distribution Practices.
That is why healthcare organizations must take into account all stakeholders taking part in the process until the products enter the warehouse:
manufacturers, wholesalers, warehouses, freight consolidators, freight forwarders and brokers (Schmitt, 2014). Quality and compliance issues may arise at any point of the production and distribution chain and particularly from third party providers. Therefore healthcare organizations should audit and control all their business partners that intervene in the pharmaceuticals purchasing process (EMA, 2013).
In the European continent, the Good Distribution Practice guidelines are provided by the European Commission with the document “Good distribution practice of medicinal products for human use” (Nov. 5, 2013). This document highlights the importance of complying with quality standards in the distribution of healthcare products and gives insights in key areas such as storage,
management of outsourced activities, hygiene and transportation of products requiring special conditions (e.g. temperature controlled transport). Besides keeping quality standards, the Good Distribution Practice guidelines aims at reducing and teach how to deal with falsified medicinal products (MHRA, 2013). Due to these specifications and other factors, healthcare supply chains were considered most of the time totally different than commercial supply chains (Hu, 2011).
15
1.3 Commercial supply chains VS healthcare supply chains
Commercial supply chains refer to manufacturing, retail or global services providers companies and healthcare supply chains are those that supply hospitals. Commercial supply chains are said to be years ahead of healthcare supply chains. This gap has roots in the perspective that was built around healthcare supply chains giving it limited scope and equating it to materials management (Kros & Brown, 2013). Another major reason to justify this gap is linked with a complex and dynamic internal and external environment that characterizes hospitals. The complex technology used, the distinctive characteristics of health service operations and the presence of multiples
stakeholders makes it hard to implement supply chain practices commonly used in industrial settings (De Vries & Huijsman, 2011). As a consequence, we observe many supply chain tools that have been implemented and deeply developed in industrial supply chains such as Supplier Relationship Management (SRM), standardisation or the lean concept that have only been introduced recently in healthcare supply chains (Duffy, 2009).
2. Quality Management in Healthcare
2.1 Definition and levels of quality
“Many experts have attempted to define quality. While definitions vary, there are three standard levels of quality that are accepted today” (Dunn, 2010). The first is conformance quality and it is the most rudimentary level of quality. It means ensuring to the customer the minimum quality standards defined by the organization. The second level is requirements quality where the company’s manager is responsible to meet the customer’s requirements and expectations showing that he is running a good organization. The highest level is quality of kind: the service or product provided by the company beats customer’s expectations or delights the customer.
16
In healthcare, the focus is in service quality that is linked to the previous
definition of quality with some nuances. We can classify health service quality in 3 different dimensions:
- Technical and professional quality: it is based on technical accuracy and correct practises. Consistent medical diagnoses, compliance with industry specifications, and proper tests are all examples of technical and
professional quality. Competence and knowledge of medical staff, including the surgeon’s operating skills and the nurses’ ease and
familiarity with drug administration, is also considered technical quality. (Kros & Brown, 2013).
- Quality of management: “the ability to use the available resources efficiently through an organizational system that limits waste, and work under constraints and directives imposed” (Giannini, 2015).
- Quality perceived by the use: difference between customers’ expectations and customer’s perceptions that allows the healthcare provider to
understand the same user’s needs and meet its expectations. (Giannini, 2015)
2.2 Managing quality in healthcare.
2.2.1 Quality control
In order to assess and manage quality in a healthcare unit, data must be
constantly collected, monitored and analysed. The data collected will allow using quality control tools with the primary objective of achieving quality of kind. Kauro Ishikawa developed 7 quality control tools that enable healthcare
managers to address, analyse and solve the vast majority of quality issues. The 7 quality control tools are: cause- and-effect diagrams, check sheets, control charts, flowcharts, histograms, Pareto diagrams and scatter diagrams. These tools help managers to control quality of the day-to-day operations of healthcare units and to spot problems that need to be solved. To assure that an adequate level of quality is achieved, managers may also use the Deming Management Method. Developed by the latest, it consists in a set of 14 points of behavioural and organizational practises that aim at keeping high quality standards. Deming said
17
that a manager should always appreciate a system correctly, have good knowledge of variation, understand the theories of knowledge and have sensitivity for the concepts of human nature.
Managing quality control and continuously introducing ways to improve quality will have an impact in key financial ratios and metrics healthcare related that will be our main focus in which regards quality management.
2.2.2 Relationship between costs and quality.
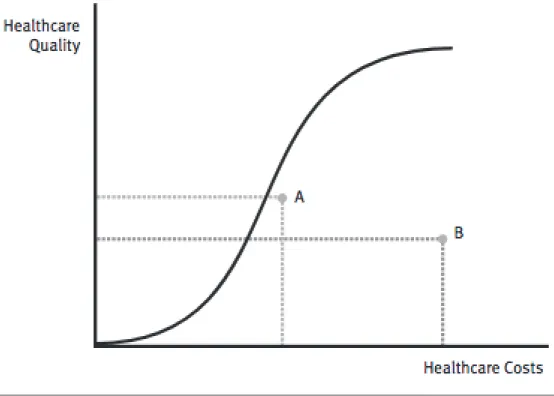
Given that costs are present in the majority of the key healthcare financial ratios that we will present later, it is important to introduce and define the theoretical relationship between quality and costs. The theoretical relationship between quality of care and healthcare costs has been represented by graphs like the one in figure A (Bodenheimer and Grumbach, 2009; Donabedian, Wheeler, and Wyszewianski, 1982).
As we can see, the curve is S-shaped. In the beginning, increasing costs will only increase quality residually. As costs continue to increase, quality will start to increase exponentially until reaching a final stage. At this point, each increase in cost will have a meaningless impact in quality; the growth in quality is not worth the amount invested.
18
Figure A: Theoretical relationship between quality and costs. (Joshi et al., 2014)
Donabedian (2003) summarized the relationship between quality and costs by defining 3 rules.
Firstly, to achieve any level of quality, financial resources will have to be spent: quality costs money.
Secondly, even though higher costs are usually associated with higher quality, every unit of cost added will not necessarily increase the overall quality as showed by points A and B in figure B: money does not necessarily buy quality. Thirdly, as seen in figure A, at some point, continuing investing financial resources will only bring small enhancements in quality and therefore some improvements in quality are not worth the added cost. “In this kind of situation, some would argue that the large increase in costs is not justified, given the disproportionately small improvement in quality” (Joshi et al., 2014).
19
Figure B: Money does not necessarily buy quality. (Joshi et al., 2014).
With the relationship between costs and quality in healthcare defined and the concept of quality control introduced, the measurement of quality is the next subject to be addressed.
2.2.3 Financial ratios and metrics.
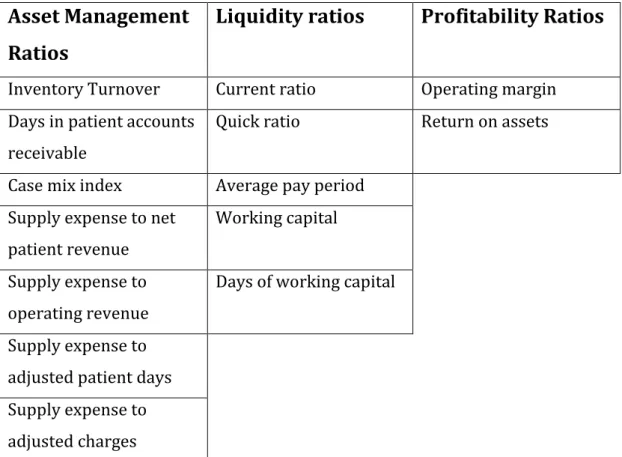
Quality supporters such as Deming (1982) and Harteloh (2004) argued that quality was a fundamental driver of productivity and performance. In Figure C, we introduce some key healthcare financial ratios that will help us later to understand the link between quality and financial performance in healthcare (Zelman et al., 2009).
20
Asset Management
Ratios
Liquidity ratios
Profitability Ratios
Inventory Turnover Current ratio Operating margin Days in patient accounts
receivable
Quick ratio Return on assets Case mix index Average pay period
Supply expense to net patient revenue
Working capital Supply expense to
operating revenue
Days of working capital Supply expense to
adjusted patient days Supply expense to adjusted charges
Figure C: Key healthcare financial ratios (Kros and Brown, 2013).
Given our focus in supply chain operations, we will only develop further asset management ratios and profitability ratios that are among the most important in this field.
• Inventory Turnover Ratio: Cost of Goods Sold / Average Inventory Cost of goods sold is the cost incurred with supplies (e.g. pharmaceuticals or surgery material) to provide care to patients. This ratio tells us how many times inventory is out of stock and restocked or turned over during the year.
• Supply Expense to Net Patient Revenue: Supply expense / Net Patient Revenue.
Supply expense is the same as the cost of goods sold, explained in the previous ratio. The net patient revenue is sum of the net patient service revenue and the premium revenue. This ratio is very helpful when analysing supply expenses performance on a period-over-period time frame. If the ratio increases over time,
21
it may indicate that that changes in supply management behaviour are occurring such as consumption, prices or supplier without any changes in patient revenue.
• Supply Expense to Total Operating Revenue = Supply Expense / Total Operating Revenue
The only difference in the calculation between this ratio and the supply expense to net patient revenues is that all the revenues are taken into account for latter one and not only the net patient revenue. It measures the relative intensity of supply utilization in support of patient care and day-to-day operations.
According to the healthcare industry standards, companies that are performing better have a ratio between 13 and 14 per cent.
• Supply Expense to Adjusted Patient Days = Supply Expense / Adjusted Patient Days.
Adjusted patient days is the formula that measures the mix between outpatients and inpatients, patients staying less than 24 hours and those staying more than 24 hours in a healthcare facility.
Adjusted Patient Days = (Total Gross Revenue / Total Inpatient Revenue) * Number of Patient Days
Number of patient days is the sum of the total number of days spent by each patient in the healthcare unit.
• Operating Margin = (Operating Revenue – Operating Costs) / Operating Revenue.
It is the most common ratio for any type of organization. The healthcare industry average in 2010 was 3,4 per cent (Carlson and Galloro, 2011).
2.2.4 Performance indicators.
“Performance indicators are a popular mechanism for measuring the quality of healthcare to facilitate both quality improvement and systems management” (Braithwaite et al., 2017). Besides financial ratios, performance indicators may also be used to assess the quality of services provided by healthcare units. The
22
World Health Organization established some indicators in order to compare healthcare performance between different countries. The measurement of these indicators aims at conferring the level of health provided to the population by a health system, understanding to which extent responsiveness to human needs are being met and evaluating the health resources productivity (Smith et al., 2009). There are general indicators that enable to assess the overall health status of the population and its evolution over different periods such as the life expectancy or avoidable mortality. To monitor more specifics aspects of
healthcare operations, there are performance indicators such as the readmission rate after a patient discharge from hospital (Daras et al., 2017) or the total time that a patient waits for a surgery (Waddel, 2008). With the data collected about these indicators in healthcare units, it is possible to provide insights about operational performance that reflects the level of quality practised.
In this chapter were introduced important quality concepts such as control and monitoring of quality, the relationship between costs and quality, and a set of tools to measure it. Witch the next chapter comes an overview of the Group Purchasing Organization concept and its incidence in the Portuguese Healthcare System.
3. Collaborative purchasing.
3.1 Definition of GPO.
“A group purchasing organization (GPO) is an entity that utilizes collective buying power to obtain significant discounts from vendors, which can be suppliers, distributors and manufacturers”. (Yang et al., 2016). Weinstein defined a healthcare GPO as an intermediary in the supply chain for
pharmaceuticals and medical equipment with the hospitals and clinics being stakeholders that aim at aggregating purchases and thereby achieving lower prices from suppliers (Weinstein, 2006). Two or more companies, usually from the same industry, form this entity. In the case of healthcare, an example of a GPO would be an entity that negotiates and purchases products for 2 or more
23
hospitals from a set of vendors. That means that one single vendor may be supplying more than one hospital.
The vendor is better off selling through a GPO because it offers possibly higher volumes purchased but requires that the vendor pay to the GPO a Contract Administration Fee (C.A.F.), a percentage of all revenue contracted through it. The companies benefiting from the GPO are better off because they may have cost reduction due to increased bargaining power but may have to pay a membership fee (Hu et al., 2011).
3.2 Advantages and disadvantages of GPOs.
The formation of GPOs may bring lots of advantages to the companies composing the group but may also bring disadvantages. From Appendix A that includes the main advantages and disadvantages from collaborative purchasing, below we resume the more important ones for our study.
At individual member level
The companies integrating a GPO will mainly benefit from cost reductions (e.g. cost, transaction and administrative costs) and savings in human resources, given that some purchasing effort will be transferred to the group alongside with increased information on supply markets that improves the decision making process (Schneller, 2009). Lower responsiveness in emergency situations when smaller quantities are needed, less direct contacts with the suppliers and
standardization are the disadvantages at this level. The only concern at his level is the possibility of negotiating a higher price within the GPO than if the price was negotiated directly with the supplier (Dimitri et al., 2006).
At group / supply chain level
Advantages at this level are multiple. Better information and standardisation enables a more rationalised choice. The consolidation of purchasing volumes enables negotiating better conditions with the suppliers and the reduction of
24
duplicated purchases. With the increase of the number of participants in the GPO, increases also the coordination costs (Tella & Virolainen, 2005).
At macro / political level
In the field of politics, the reduction of overall supply chain costs will
consequently decrease the amount paid by taxpayers. There is also a positive effect in the prevention of corruption in the public sector. Regarding
disadvantages, innovation can be highly affected as GPOs tend to favour suppliers with a wide product range rather than the ones with a single innovative product. At the macro level, there is major concern about keeping market dynamics given that setting up a GPO increases considerably buyer concentration (Blair and Durrance, 2013).
3.3 Group Purchasing organizations in Portugal healthcare system.
“It may be argued that the best solution for Portuguese Public Hospitals would be the establishment of a national GPO” (Rego et al., 2013). Actually, over the past years, there have been many attempts from the health authorities to
implement and control group purchasing structures. Nevertheless, due to wrong timings or wrong approaches, the reported purchases channelled through this type of structures were very few. The creation of these organizations has even experienced resistance and low acceptation from hospital staff, explained primarily by strict compliance rules. The introduction of collaborative purchasing organizations in the Portuguese National Healthcare System has followed an opposite path to the one proposed by Schotanus and Telgen that approaches the commonly observed evolution in this field by different nations. According to Definitive Healthcare Data, a U.S. repository of healthcare data, it was estimated that already over 90% of the total number of hospitals in the U.S. were members of a GPO in 2017.
The Portuguese Ministry of Health created in 2010 the SPMS – Serviços
Partilhados do Ministerio da Saude (Ministry of Health Shared Services), a public institution owned by the government. This entity’s mission is providing services
25
related to procurement and logistics, financial management, human resources and information technology systems to institutions that are part of the National Health System such as hospitals (SPMS, 2015). The constitution of the SPMS aims to promote efficiency and effectiveness of the National Healthcare System
associated entities through the attainment of savings when purchasing medicines, consumables, medical devices and services linked to field of healthcare. The participation of the SPMS in the purchasing processes varies according to the purchasing model attributed to each product or service: there is the distributed model and the centralized model. In the distributed model, the institution centrally defines the basic conditions for future contracts between suppliers and companies that are members of the National Health System through the conclusion of framework agreements; the individual purchases are then performed decentrally by each healthcare unit. In the centralized model or aggregated, the SPMS undertakes the individual purchases on behalf of the healthcare units through framework agreements or through other procedures of public contracting if there is no agreement in place for the type of good or
service (SPMS, 2015).
The total savings amount for the National Health System is defined by the cost reduction, incurred by the attainment of better conditions in the purchase of goods and services by the institutions that compose it: transactional savings; and by the reduction of resources allocated to buying processes that arises from the centralization and aggregation of all purchases: procedural savings. The sum of these two sources of savings represents the global savings for the National Health System.
The global savings of the National Health System is boosted through:
- The reduction of transactional expense that arises from the conclusion of framework agreements that set up maximum prices for products and services and from the centralization and aggregation of purchases that enables the increase of bargaining power and consequently more competitive prices.
- The reduction of procedural expenses that arises from the retrenchment of costs and workforce effort in the execution of buying procedures under
26
agreements, by the reduction of the number of competing proposals for each award and the elimination of costs with tender advertisement. Since the introduction of the centralized purchases and the intervention of the SPME in the buying process, the Portuguese government has taken a big advantage and saved large amounts of money. In 2017, the SPME estimates that 985 million euros of purchases have been performed centrally enabling global savings of 145 million euros (Publico, 2017). The introduction of a GPO could boost this number and cover the purchase of a wider range of products and services.
27
III. Methodology and Data Collection.
1. Study Design
1.1 Contextual overview.
The healthcare industry has faced for long years very high costs and principally increasing costs. As an example, the United States saw their healthcare costs rise by 933 billion dollars from 1996 to 2013 (Forbes, 2017), making the United States the country with the biggest health expenditure per capita. According to the OECD, all its members experienced an annual growth in healthcare
expenditure between 2003 and 2009 and only 3 countries were able to reduce it between 2009 and 2016. In the cost structure of healthcare organizations, operational costs account for a very important part of the total and Portugal is not an exception: the INFARMED estimates that 30% to 40% of the overall costs were operational costs in 2012. Therefore, reducing operational costs is an important and hardworking task because with it comes another challenge: try to increase quality levels or at least keep the current ones. Bearing this in mind, this study focused on supply chain costs and its influence in the quality of services provided in healthcare organizations. After having established a relation
between supply chain costs and quality, this study intends to assess the potential of increasing quality through cost reduction that the creation of a Group
purchasing Organization could generate in Portuguese Health System.
1.2 Scope of the study.
Considering the goals of this study, the two research questions will be addressed to the Portuguese Health System, which will facilitate the process. The strong linkage of the author to Portugal was also taken into account to make this decision. As the Portuguese Health System is owned by the government, there are multiple financial, operational and performance reports that are public and of easy access; some of these reports are even mandatory for the healthcare units to disclose them. The Portuguese Healthcare System is composed by 77 general hospitals and by 22 specialized hospitals covering all the geographical
28
regions of Portugal (Pordata, 2017). The data for the analysis will be collected from all the hospitals with no restriction whenever it is available.
2. Data Collection
The data to undertake this study will be collected from multiple reports that are available online and provided by the Portuguese Healthcare System. The study will mainly focus in the period between 2011 and 2017, period which has more data available and consistent. Assuming a positivistic philosophy, where all previous literature is considered accurate (Collis & Hussey, 2003), conclusions will be drawn according to the consulted literature.
2.1 Relation between costs and quality.
The first objective of this study is to understand the link between cost efficiency and quality in healthcare supply chains. This objective aims at defining the relation of money spent on the quality provided to the healthcare consumer: a person that seeks to be treated or that seeks for a diagnosis. According to Donabedian (2003), one of the major outcomes on quality that may arise from the variation of costs incurred by a healthcare unit is that each extra monetary unit spent does not necessarily have a positive impact on quality. This leads one to another interesting hypotheses: reducing costs may increase quality (Kros & Brown, 2013). With the increase in cost efficiency, resources may be allocated to other areas in need and therefore increase the overall quality.
To better understand this relation between costs incurred and quality, secondary data from the Portuguese Healthcare System will be collected in order to analyse and validate these hypotheses. Considering the information available and the goal of seeing the evolution of costs since 2011, data collected about cost
indicators will mainly be about medicines used in the institutions that compose the Portuguese Health System. Regarding quality, the data collected was
extracted from operational performance reports where trends about quality evolution are more easily understandable. As an example, these reports can measure the readmission rate to hospital after a patient discharge or the average
29
waiting time for a surgery to be performed. Key financial ratios were not taken into account as information was considered too little, with high level of
granularity and therefore not suitable for making comparisons between different periods.
2.2 Current model performance.
The second part of this research will aim at assessing the potential of increasing quality through cost reduction that the creation of a Group Purchasing
Organization could generate. An analysis of the current purchasing model will be undertaken to understand its performance and possible weaknesses. The goal of analysing the current purchasing model is to track the evolution of cost
efficiency since the introduction of centralized purchases and the intervention of the SPMS in the buying process with the implementation of framework
agreements in 2013. Therefore, the performance analysis of the current purchasing model will only consider costs and purchases that were directly channelled through the SPMS (centralized/aggregated model) or those that were performed by the entities of the Portuguese Health System under framework agreements (distributed model). It will then be assessed whether the
implementation of a Group Purchasing Organization would better fit the Portuguese Health System in order to increase the quality of the services provided.
30
IV. Results.
1. Quality indicators
1.1
Readmission rate
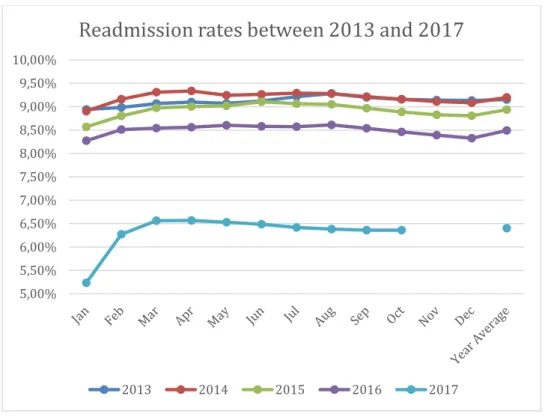
.With the objective of assessing quality levels and the evolution quality has experienced over the last years in healthcare services providers, data from the Portuguese Healthcare Service will be collected on different quality indicators. The first indicator to be presented and analysed is the readmission rate in a healthcare unit in a period of 30 days. This indicator measures the percentage of patients that are readmitted to the hospital within 30 days after their discharge from it. Data has been collected on 49 different healthcare units that belong to the National Healthcare System covering all the geographies of the country from January 2013 until October 2017.
Figure D: Readmission rates per periods of 30 days in Portuguese Healthcare System units. (SNS, 2018). 5,00% 5,50% 6,00% 6,50% 7,00% 7,50% 8,00% 8,50% 9,00% 9,50% 10,00%
Readmission rates between 2013 and 2017
31
Looking at the data collected, this quality indicator has been improving for the last 4 years except between 2013 and 2014 where it has experienced a very small increase. The biggest enhance is reported in the last year of the analysis where the indicator decreased by more than 2 percentage points. Even if the data about 2017 is not complete (at the time of the study, data for November and December is not available), this number is still trustworthy as rates from the 2 last months of the year are never the highest and are always above the average. As this quality indicator has been falling continuously in the last 3 years, it can be stated that quality improved during these years in the Portuguese Healthcare System if we consider the readmission rate per periods of 30 days.
1.2
Consultations provided in a timely manner.
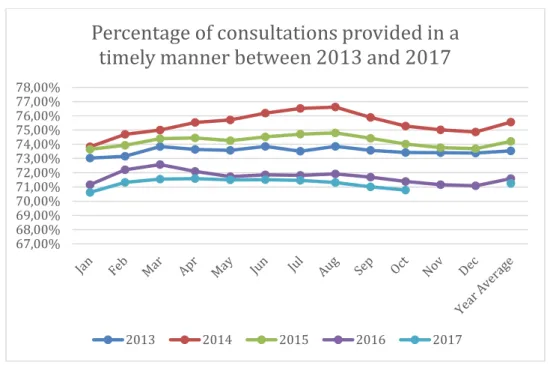
The maximum response time guaranteed is an indicator developed by the Portuguese Health system that assesses the capacity of a health unit providing a consultation to a patient in a period of a time that is acceptable according to his clinical situation. This indicator depends on multiple aspects of the clinical situation of the patient and can range from 7 to 120 consecutive days after the patient’s request; this indicator does not cover urgency situations. It is calculated by dividing the total number of consultations provided within the maximum response time guaranteed by the total number of consultations provided.
32
Figure E: Percentage of consultations provided to patients within the maximum guaranteed time between 2013 and 2017. (SNS, 2018)
Data about medical appointments was collected in all geographical regions of Portugal between January 2013 and October 2017. It was then evaluated
according to the maximum response time guaranteed with the results shown in Figure E. Looking at the data collected, there is no clear trend reported in the evolution of this indicator as it increased between 2013 and 2014 and then decreased until 2017. The global evolution between the 5 years analysed is negative with the indicator dropping from 73,54% to 71,25% in the last year and staying above the average of the whole period, 73,27%. The weak performance of this indicator can be explained by the evolution of the absolute number of medical appointments that experienced a significant growth during the period in analysis, as shown in Appendix C. This number rose consecutively between 2013 and 2017 with more 1.4 million surgeries performed in 2016 than in 2013. This immense growth in this indicator’s activity had a very negative impact in quality.
67,00% 68,00% 69,00% 70,00% 71,00% 72,00% 73,00% 74,00% 75,00% 76,00% 77,00% 78,00%
Percentage of consultations provided in a
timely manner between 2013 and 2017
33
1.3
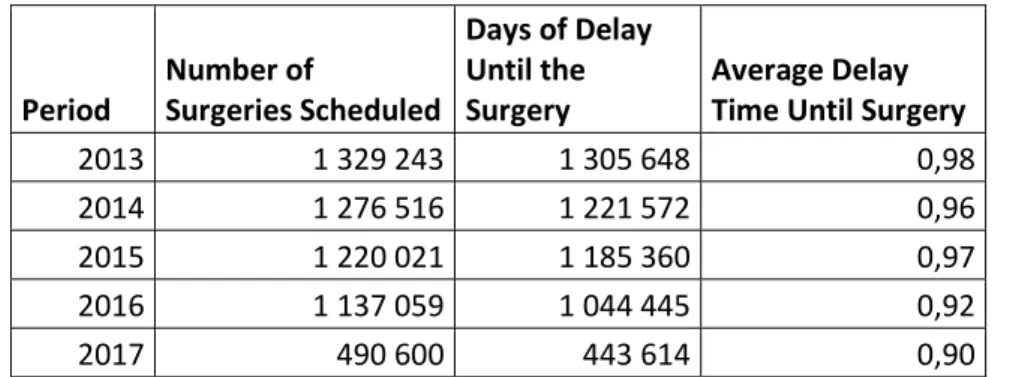
Delay time until surgery.
Continuing the analysis of the quality of services provided in the Portuguese Health System, another indicator that can be useful to understand its evolution in the last years is the delay time within each surgery is performed. This is the gap of time between the first date in which the surgery is scheduled and the date where the surgery is actually performed. The smaller the average delay time for a surgery is and the better it is for the performance of healthcare unit as more patients get treated in the adequate time.
Period Number of Surgeries Scheduled Days of Delay Until the Surgery Average Delay Time Until Surgery
2013 1 329 243 1 305 648 0,98
2014 1 276 516 1 221 572 0,96
2015 1 220 021 1 185 360 0,97
2016 1 137 059 1 044 445 0,92
2017 490 600 443 614 0,90
Figure F: Delay time until surgery between January 2013 and October 2017. (SNS, 2018)
Data was collected monthly between January 2013 and October 2017 and covers all the geographical areas of Portugal (Figure F). The total number of surgeries scheduled have been decreasing every year of the period analysed; this number fell 14,4% between 2013 and 2017. Consequently, the total days of delay also decreased during the period. But both have not been decreasing at the same rate. If we look at the average number of days of delay until the surgery, it has been significantly decreasing every year between 2013 and 2017. It fell almost 8% from 0,98 days to 0,90 days. The evolution of this indicator is very positive and even if the total number of surgeries scheduled has considerably decreased between 2013 and 2017, the quality level has increased according to the days of delay within each surgery is performed.
34
2. Cost indicators
2.1 Cost per medicine package
Considering the objective of assessing whether the trend of supply chain costs in the Portuguese Health System was increasing or decreasing for the last years, data has been collected on different cost indicators. More than understanding if costs have been rising or dropping, it is important to understand the evolution of cost efficiency. Considering this last statement, the first cost indicator to be analysed will be the average cost per medicine package. The scope of the data collected is all the medicine packages that were delivered to patients of the Portuguese Health System in community pharmacies and public subsystems. The data was collected between 2011 and 2018 and covers two different types of medicines:
- In-house use: medicines that are administrated to the patient during his stay at the hospital.
- Generics: medicines that are prescribed to the patient, to be administrated after his leave of the hospital.
Year Nº of Packages (Generics) Total cost (Generics) Nº of Packages
(In-house) Total cost (In-house) 2011 42 420 591,00 487 874 135,71 139 850 812,00 2 124 571 961,50 2012 49 425 719,00 389 109 333,54 140 017 420,00 1 855 642 761,08 2013 58 198 520,00 421 054 450,64 149 086 465,00 1 849 703 510,90 2014 62 474 459,00 452 086 139,01 153 020 413,00 1 873 043 848,45 2015 64 060 231,00 460 614 902,67 154 964 976,00 1 891 939 587,36 2016 64 533 900,00 464 549 301,05 155 972 138,00 1 887 107 629,07 2017 65 549 512,00 471 249 527,66 157 349 422,00 1 913 103 570,76 Figure G: Total cost of medicine package between 2011 and 2017 for generics and in-house used medicines. (SNS, 2018).
The number of packages used has been rising both in generics and in-house used medicines since 2011 (Figure G). The total cost of each type of medicine followed the same trend during this period despite a few exceptions. Looking further at the price per package, shown in figure H, we can see the positive evolution of this cost indicator. Notwithstanding some slight increments, the price per package of both generics and in-house medicines fell between 2011 and 2017.
35
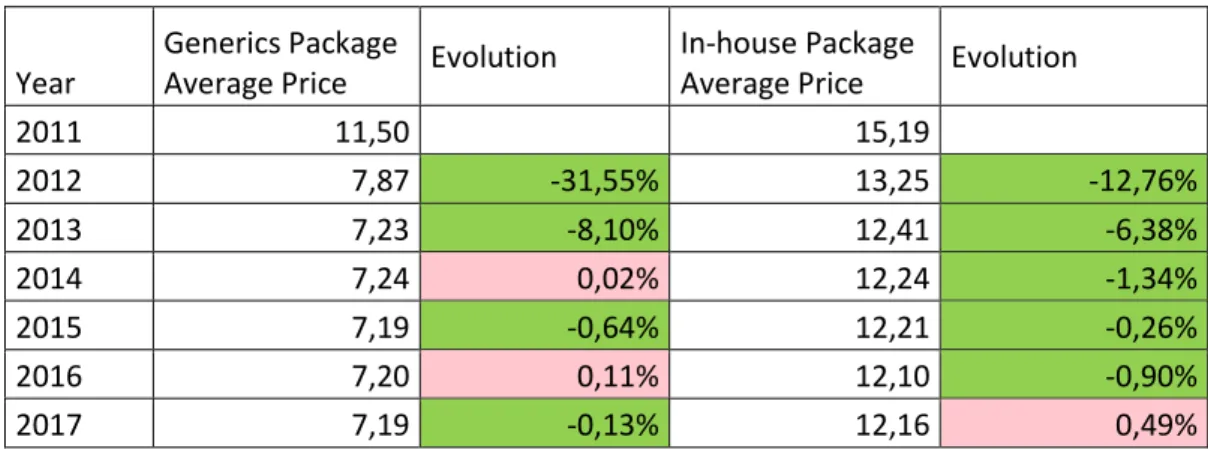
Year
Generics Package
Average Price Evolution
In-house Package
Average Price Evolution
2011 11,50 15,19 2012 7,87 -31,55% 13,25 -12,76% 2013 7,23 -8,10% 12,41 -6,38% 2014 7,24 0,02% 12,24 -1,34% 2015 7,19 -0,64% 12,21 -0,26% 2016 7,20 0,11% 12,10 -0,90% 2017 7,19 -0,13% 12,16 0,49%
Figure H: Average price per medicine package between 2011 and 2017. (SNS, 2018).
The global reduction between 2011 and 2017 was of 37% for the generics and 20% for the in-house used medicines. This reduction can be explained by the evolution of the pharmaceutical drugs industry in what regards to development and innovation but also by the increasing costs efficiency of the Portuguese Health System. This is achieved with more bargaining power over suppliers, boosted by the conclusion of framework agreements (SPMS, 2015).
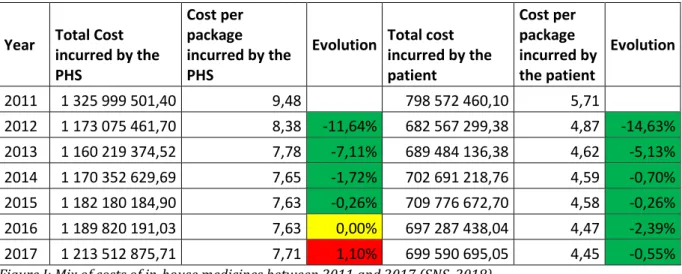
2.2 Mix of costs incurred by the PHS and by the patient with
medicines
.After analysing the total amount spent with medicines and the average price per package, it is important to decompose the mix of costs incurred between the Portuguese Health System and the patient. With this assessment, it can be then concluded which stakeholder is taking more advantage of a decrease in the overall medicines cost per package and which stakeholder is losing more value with an increase. For this analysis, data was collected between 2011 and 2017 about the total cost incurred by each stakeholder with in-house used medicines (Figure I). To assess the evolution of the mix, the total cost was divided by the total number of in-house medicine packages consumed each year, retrieved from Figure G.
36
Year Total Cost incurred by the PHS Cost per package incurred by the PHS
Evolution Total cost incurred by the patient Cost per package incurred by the patient Evolution 2011 1 325 999 501,40 9,48 798 572 460,10 5,71 2012 1 173 075 461,70 8,38 -11,64% 682 567 299,38 4,87 -14,63% 2013 1 160 219 374,52 7,78 -7,11% 689 484 136,38 4,62 -5,13% 2014 1 170 352 629,69 7,65 -1,72% 702 691 218,76 4,59 -0,70% 2015 1 182 180 184,90 7,63 -0,26% 709 776 672,70 4,58 -0,26% 2016 1 189 820 191,03 7,63 0,00% 697 287 438,04 4,47 -2,39% 2017 1 213 512 875,71 7,71 1,10% 699 590 695,05 4,45 -0,55% Figure I: Mix of costs of in-house medicines between 2011 and 2017 (SNS, 2018)
The evolution of the cost per in-house medicine package incurred by the patient fell continuously from 2011 until 2017 with a global decrease of 22% during the whole period in analysis; the patient was paying 1,26€ less per package in 2017 than in 2011. Looking at the side of the Portuguese Health system, the evolution is fairly similar except a small increase of the cost in the last year of the period, reflecting the increase of the price per package between 2016 and 2017. That is why the Portuguese Health System was the part worse off according to the variation of the cost structure: it saw its percentage of the total cost increase (Figure J).
Year Percentage of total cost incurred by the PHS
Percentage of total cost incurred by the Patient Stakeholder better off 2011 62,41% 37,59% 2012 63,22% 36,78% Patient 2013 62,72% 37,28% PHS 2014 62,48% 37,52% PHS 2015 62,48% 37,52% Neutral 2016 63,05% 36,95% Patient 2017 63,43% 36,57% Patient
Figure J: Percentage of in-house medicines total cost incurred by each stakeholder between 2011 and 2017 (SNS, 2018)
37
The patient was worse off between 2012 and 2014. Between 2014 and 2015, there was no part better off as both experienced exactly the same percentage of decrease and consequently maintained their share of the total cost. Linking this analysis to quality, the consumer of the Portuguese Health System was paying less in 2017 than in 2011 which may increase the overall quality perceived by the patient.
3. Current model performance and overview
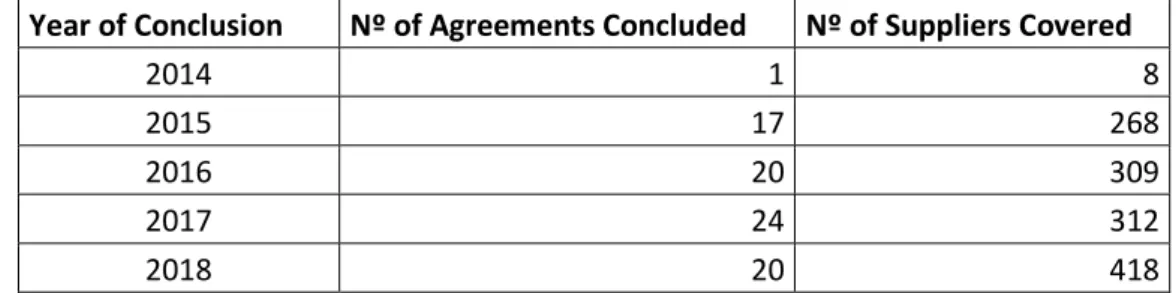
3.1
Evolution of framework agreements
Framework agreements aim at selecting companies that fill the needs of the institutions of the Portuguese Health System being that it simplifies the
acquisition process and consequently help reducing the total cost of materials purchased. (SNS, 2018). Framework agreements only take effect in the
distributed model where the healthcare unit undertakes the purchase without the intervention of the SPSMS. This indicator was considered in this study due to its potential of reducing overall purchasing costs and to reduce the total
purchasing effort, a common characteristic to a GPO. The first framework agreement was concluded in 2014 and since then this number has been increasing every year (Figure K).
Year of Conclusion Nº of Agreements Concluded Nº of Suppliers Covered
2014 1 8
2015 17 268
2016 20 309
2017 24 312
2018 20 418
Figure K: Evolution of framework agreements between 2014 and 2018. (SNS, 2018)
The total number of suppliers covered by framework agreements has also been rising since its implementation in the buying process. Given that more than 90% of the contracts are in force for only 3 years, some of the agreements may
38
concluded again. Nevertheless, the evolution of this indicator is quite positive as the total number of agreements and suppliers covered has increased since 2014 and the trend seems to stay positive as in 2018, only until March, 20 agreements were celebrated with more than 400 suppliers. With the number of framework agreements rising as well as the number of suppliers covered by these, the amount of savings is expected to grow accordingly, due to better trading conditions and simplified buying processes (SPMS, 2015).
3.2
Savings generated by the SPMS on purchases.
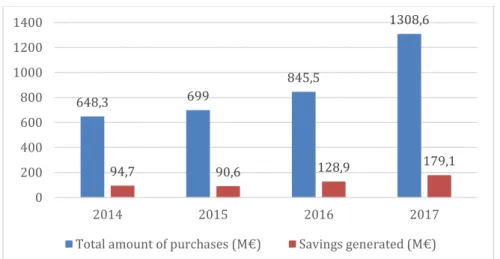
Since the beginning of the intervention of the SPMS in the buying process in 2013, the Portuguese Health System has benefited considerably with the results showing big gains in cost efficiency. Since its creation, this entity has seen its field of activity increasing exponentially. Indeed, in 2017, the total volume of purchases channelled through the SPMS was of 1.308 million euros, which represents an increase of 55% against the period of 2016 where this number was of 845 million euros (Figure L). Though the growth was not so strong, the purchasing activity also increased in 2015 and 2016 at the rates of 7,8% and 21% respectively. The total amount of purchases undertaken by the SPMS doubled between 2014 and 2017. As a consequence, the amount of savings generated by the activity of this entity in the buying process of products and services for the Portuguese Health System also experienced a considerable growth in this period with exception for 2015. The total savings almost doubled from 2014 to 2017 and reported a 39% increase between 2016 and 2017.
39
Figure L: Purchasing activity of the SPMS from 2014 to 2017. (SPMS, 2018)
These savings took place from a wide range of purchases of products and services. These purchases are divided by health related expenses such as medicines and medical equipment (92% of the total amount), and cross-sectional expenses such as electricity or facilities maintenance, as shown in Appendix D. The cross-sectional expenses are not directly related to health but these are costs that need to be incurred to provide care and therefore, they were considered in the analysis. Regarding the nature of savings, 96% were
transactional savings resulting from the attainment of better purchasing
conditions created by the SPMS for the entities of the Portuguese Health System, which includes framework agreements. The remaining were procedural savings related to the reduction of expenses with resources allocated to the execution of the procedures and their publication costs. Concerning the source of the savings, 65% came from the aggregated/centralized model where purchases are directly performed by the SPMS and 35% came from the distributed model where the entities of the Portuguese Health System make the purchases under framework agreements. The 116,9 million euros saved in the aggregated model contrast with the 42,5 million euros (33%), reported in 2016. It turns out that an
inversion of proportions is taking place as the centralized model increased and the distributed model decreased in what regards to savings. This turnaround can be explained by the activity of the SPMS that is becoming much more
comprehensive and its role within the Portuguese Health System as an entity that centralizes purchases.
648,3 699 845,5 1308,6 94,7 90,6 128,9 179,1 0 200 400 600 800 1000 1200 1400 2014 2015 2016 2017
40
V. Conclusion and Future Research
The study undertaken in this dissertation aimed at assessing ways to increase the overall quality of services provided by the Portuguese Healthcare System primarily with the reduction of supply chain costs. Given that supply chain costs are a wide concept, this study focused on supply chain costs efficiency to make the analysis of different periods more consistent. An extensive analysis of cost and quality indicators was conducted to understand the evolution of these two factors and their linkage within the period between 2011 and 2017. The analysis was performed with data retrieved from operational, financial and performance reports made available by the Portuguese Health System and the SPMS.
Conclusions were drawn and deductions were made considering all the data collected as accurate and trustworthy.
1. Evolution of costs.
Considering the data collected about the total cost incurred with medicines (Figure G), costs rose consecutively between 2013 and 2017 excluding one small exception. The periods where this indicator has increased can be explained by two main factors. The activity of healthcare units may have also increased with for example more patients treated and more surgeries performed. The other factor that can generate higher costs is the loss of cost efficiency (Zelman et al., 2009). These two phenomena can happen at the same time and the opposite is also true: less activity and gains of cost efficiency can generate lower costs. Therefore, cost efficiency was the key element to assess the performance of the Portuguese Healthcare System in what regards to costs. The better and more consistent indicator for this assessment was the price per package of medicines for both generics and in-house. The evolution of both between 2011 and 2017 was very positive with the price per package falling through the whole period at a rate of 37% for generics and 20% for in-house. The price increases during the period, besides being very few, were always above 0,5%. Cost efficiency
41
not taken into account for the analysis such as the cost per patient that decreased 8% from 27.218€ to 24.943€ (SNS, 2017).
2. Evolution of quality.
Data collection about quality was more extensive as there were multiple reports focusing on the operational aspect of health and its continuous monitoring. To perform the analysis were chosen the ones with more consistent information and connection to this issue. These reports reflect the quality of services provided in the Portuguese Healthcare System as they measure indicators that assess if the population is being better or worse treated through the years. Two of the three indicators selected for the analysis experienced very positive evolutions for the period between 2013 and 2017: the readmission rate and the waiting time for a surgery. Both indicators improved consecutively each year between 2015 and 2017. The total number of medical appointments provided within the maximum response time guaranteed was the only quality indicator that saw its performance weaken during the period. This poor performance was mainly caused by the considerable growth of medical appointments between 2013 and 2016 that rose at an average yearly rate of 7,5%.
3. Relation between costs and quality.
A service provided with high quality does not have necessarily high costs associated and high costs does not guarantee good quality of services by itself; but there is always need to incur in costs to provide some level of quality. Starting with this theory about healthcare costs developed by Donabedian, this study focused on establishing a linkage between costs and quality and assessing if one has a direct influence in the other. As stated before, costs in the Portuguese Healthcare System have been rising consecutively since 2013 but cost efficiency has experienced a significant growth during the period between 2011 and 2017. The impact of cost efficiency in quality is not pure. Nevertheless, considering that the global evolution of two quality indicators between 2013 and 2017 is
42
considerably positive and the third with a negative evolution mainly caused by a large growth of the activity, there is a positive relation between cost efficiency and quality: positive variations in cost efficiency can generate positive variations in quality. Furthermore, the customer of the Portuguese Health System is not paying more for the quality of services provided. As shown in Figure H, the total cost incurred by the patient with in-house medicines packages dropped
consecutively between 2011 and 2017. That means that for a certain level of quality provided, the patient is not paying more.
4. Evolution of the current purchasing model performance.
An analysis of the current purchasing model considering exclusively the transactions that were performed through the procedures set up by the SPMS was undertaken. Created in 2010, the SPMS intervenes in the buying process since then and since 2013 that its performance and savings have been
monitored. Through the centralized/aggregated model and the distributed model, healthcare units may make use of this entity to purchase products and services. The process is as follows in Figure M and always start with the
healthcare unit need for a product or service and finishes with the purchase. In blue arrows are represented the activities where the SPMS has intervention and in red arrows the ones where it has not.
Healthcare Unit Need Product/service covered by the centralized model SPMS purchases the product/service Healthcare Unit Need Product/service covered by the distributed model Healthcare unit purchases the product/service under a framework agreement Healthcare Unit Need Product/service not covered by any of the two models Healthcare unit purchases the product/service independently to the supplier
Figure M: Purchasing procedures of the SPMS in the Portuguese Healthcare System. (SPMS, 2018).
43
The activity of the SPMS grew exponentially between 2014 and 2017 and in the latest year, more than 1300 million euros were purchased through the
distributed model and the centralized/aggregated model. As a consequence, it generated savings of 179 million euros in 2017. This was motivated by a more comprehensive scope of the activity of the SPMS, that covered the purchases of more types of items, and by the substantial growth of framework agreements concluded. The total savings increased significantly since this indicator has been monitored and principally between 2015 and 2017 with a growth of 98%; the total amount purchased through the SPMS also increased by 87% during this period. This means that increasing the amount purchased through the SPMS enhances global savings because better conditions are achieved for a bigger range of items.
5. The opportunity of a GPO implementation in the Portuguese
Healthcare System.
The operation of the centralized/aggregated model is the closest to a GPO (Figure N) that can be found in the purchasing procedures of the Portuguese Healthcare System. Healthcare Unit Need Communication of the need to the Group Purchasing Organization Group Purchasing Organization purchases the product/service
Figure N: Purchasing process for a healthcare unit integrated in a GPO (Burns & Lee, 2008)
An entity, the SPSM in this particular case, negotiates and establish the
purchasing conditions for a certain range of products and services directly with suppliers. The acquisition is then performed centrally for all the institutions that compose the Portuguese Healthcare System; the healthcare units have no