C
ARBON
C
APTURE AND
S
TORAGE IN THE
C
OMMUNITY OF
P
ORTUGUESE
L
ANGUAGE
C
OUNTRIES
O
PPORTUNITIES AND CHALLENGES
May | 2015
A
A
n
n
g
g
o
o
l
l
a
a
B
B
r
r
a
a
z
z
i
i
l
l
C
C
a
a
p
p
e
e
V
V
e
e
r
r
d
d
e
e
E
E
a
a
s
s
t
t
T
T
i
i
m
m
o
o
r
r
E
E
q
q
u
u
a
a
t
t
o
o
r
r
i
i
a
a
l
l
G
G
u
u
i
i
n
n
e
e
a
a
G
G
u
u
i
i
n
n
e
e
a
a
-
-
B
B
i
i
s
s
s
s
a
a
u
u
M
M
o
o
z
z
a
a
m
m
b
b
i
i
q
q
u
u
e
e
P
P
o
o
r
r
t
t
u
u
g
g
a
a
l
l
S
S
ã
ã
o
o
T
T
o
o
m
m
é
é
a
a
n
n
d
d
P
P
r
r
í
í
n
n
c
c
i
i
p
p
e
e
Acknowledgements This publication has been prepared by the partners of the project CCS‐PT: Perspectives for capture and sequestration of CO2 in Portugal, to stimulate the debate about the role of
CO2 capture and storage in the Community of Portuguese Language Countries. More
information on the CCS‐PT project is available at http://ccsroadmap.pt.
The project partners would like to thank the Global CCS Institute for its financial and technical contribution, and those colleagues from the CPLP member states that contributed to the analysis of the CCS opportunities in each country. Contributors for this publication were: Portugal: Júlio Carneiro, Instituto de Ciências da Terra, Escola de Ciências e Tecnologia, Universidade de Évora. Angola: António Olímpio Gonçalves, Departamento de Geologia, Faculdade de Ciências, Universidade Agostinho Neto. Brazil: Rodrigo Iglesias, CEPAC/Pontifícia Universidade Católica do Rio Grande do Sul. Cabo Verde: Carlos Moniz, Instituto Nacional de Meteorologia e Geofísica, Moisés Borges, Direcção Geral do Ambiente. East Timor: Elisa Pereira, Ministério do Ambiente. Mozambique: Anísio Pinto Manuel, Direção Nacional de Energia Elétrica. São Tomé and Príncipe: Guilherme Mota, Agência Nacional do Petróleo. Disclaimer This publication was made possible through funding from the Global CCS Institute, in the interest of broadening the discussion on CCS as a key climate change mitigation option. The views contained in this publication do not necessarily represent those of the Global CCS Institute or its Members. The Global CCS Institute does not give any representation or warranty as to the reliability, accuracy or completeness of the information contained in this publication and, to the maximum extent permitted by law, does not accept any liability arising in any way (including by negligence) for any use or reliance of the information contained in this publication.
ISBN: 978‐989‐20‐5745‐3
© Escola de Ciências e Tecnologia, Universidade de Évora, Évora, 2015.
All rights reserved. Users may download, print or copy extracts of content from this publication for their own and non‐commercial use. No part of this work may be reproduced without quoting the publication. Commercial use of this publication is not allowed.
All photos presented in this report are royalty free.
R&D project partially funded by:
TABLE OF CONTENTS
Executive Summary iii
1
The CPLP, Community of Portuguese Language Countries 1
2
Status of CCS activities in CPLP countries 3
Brazil 3
Portugal 4
3
Prospects for CCS activities in the CPLP 6
3.1
Industrial and energy context and CO
2storage opportunities 6
Angola 7
Cape Verde 9
East Timor 11
Equatorial Guinea 13
Guinea-Bissau 15
Mozambique 17
São Tomé and Príncip 20
3.2
Sectors with potential for CCS activities 22
3.3 Summary
of
CO
2storage opportunities 25
3.4
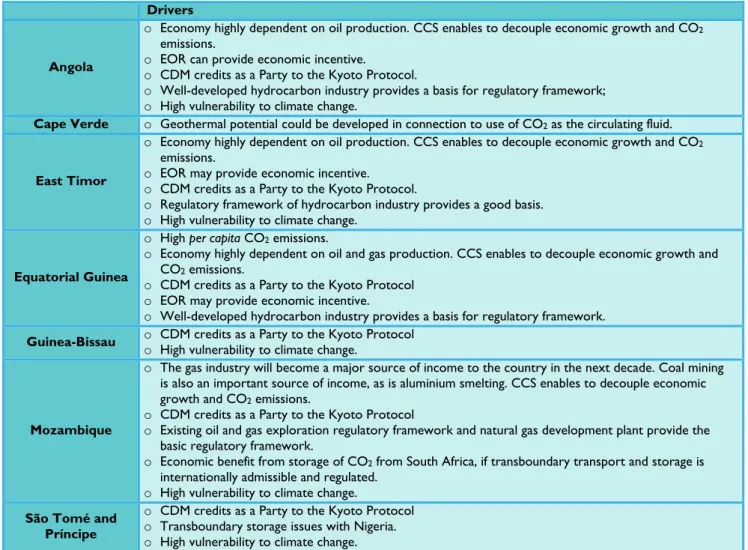
Drivers for deployment of CCS activities 25
3.5
Challenges for deployment of CCS activities 26
4
The way forward – realizing the potential for cooperation 28
4.1
Recommended actions 28
4.2
Funding opportunities 29
5
Conclusions 31
References 32
Executive Summary
The community of Portuguese Language Countries (CPLP) comprises nine member states, spread over four continents: Europe (Portugal), America (Brazil), Africa (Angola, Cape Verde, Equatorial Guinea, Guinea‐Bissau and São Tomé and Príncipe) and Oceania (East Timor). The member states cover a range of Industrial, Economic and Environmental profiles, but share strong cultural and economic links.
CO2 Capture and Storage (CCS) is not perceived as a
priority for the authorities of any of the CPLP countries, although Brazil and Portugal have been involved in CCS activities for several years. All other CPLP countries, recognized as highly vulnerable to climate change impacts, have never engaged in any debate about the relevance of CCS to their environmental and climate change policies. This publication is an effort to bring CCS onto the agenda of these CPLP countries. It presents an oversight of the industrial, energy and CO2 emissions
profiles, and discusses the CO2 storage opportunities in
those countries. Brazil, which is responsible for 80% to 85% of the emissions in the CPLP, and Portugal are discussed only in terms of previous or ongoing CCS activities.
Drivers for deploying CCS activities need to be sought elsewhere other than the CO2 emissions profile of those
CPLP member states, but the drivers exist and are mostly connected to the fossil fuel production in Angola, East Timor, Equatorial Guinea and Mozambique. Use of CO2
for EOR purposes, but also CO2 capture connected to
downstream oil (refineries) and gas processing and LNG investments planned in those countries are possibilities that should be discussed in the framework of the national climate change mitigation policies.
The rapid population and economic growth rate in the CPLP countries must be met by growing energy production and increasing manufacturing capacity. Investments are programmed in fossil fuel power plants in Angola, Equatorial Guinea and especially in Mozambique, while investments in cement factories are planned in almost every country. Aluminium smelting in Mozambique can also be an early opportunity for CCS
projects, while the possibility for Bio‐CCS projects should be considered given the vast bioenergy potential in almost every country, except Cape Verde, and particularly in Guinea‐Bissau, Equatorial Guinea and Mozambique.
CO2 storage opportunities linked to use of CO2 for EOR or
to depleted oil and gas fields are clear options for Angola, East Timor and Equatorial Guinea, while Mozambique and Guinea‐Bissau have extensive onshore sedimentary basins, spreading to offshore, which will have good opportunities for storage in deep saline aquifers. Mozambique may also have some storage capacity in unminable coal seams, if CO2 injection in this
geologic environment proves to be a valid scenario. In Cape Verde and São Tomé and Príncipe, two archipelago countries, the costs of insularity and population dispersion imply that CCS is unlikely to be a relevant technology. Nevertheless, the use of CO2 in
Enhanced Geothermal Systems could be of interest in Cape Verde, as well as R&D activities related to CO2
storage in basaltic environments.
Transboundary transport and storage issues may be of interest to São Tomé and Principe, which shares an offshore basin with Nigeria; to Angola, which may need to transport CO2 across the Democratic Republic of
Congo territory to the Cabinda Enclave, and certainly to Mozambique, which could develop a business case from storage of CO2 captured in South Africa.
The most pressing challenges for deploying CCS in any of these countries is the poor knowledge of the technology, a common feature to all CPLP countries, the lack of a clear business model applicable to developing and least developed countries and the need to assess the role that CCS can play in the economic context, energy system and emissions reductions of each country.
Cooperation within the CPLP could overcome these challenges and a set of recommendation is provided to start CCS activities in those countries identified with the highest potential.
1 The CPLP, Community of Portuguese Language
Countries
he Community of Portuguese Language Countries (CPLP) is a multilateral forum aiming to foster cooperation amongst the nine sovereign states in which Portuguese is an official language. The CPLP was founded in 1996 by Angola, Brazil, Cape Verde, Guinea‐Bissau, Mozambique, Portugal, São Tomé and Principe, which were joined as full members by East Timor in 2002 and Equatorial Guinea in 2014.
The Community has the following general objectives [1]: o Political and diplomatic cooperation, especially
for strengthening its presence in the international arena;
o Cooperation in all areas, including education, health, science and technology, defence, etc.; o Implement and support projects for promotion
of the Portuguese language.
The CPLP in the global context
The nine member states of the CPLP occupy a territorial area of more than 10.7 million km2, an area larger than
the United States, China or India, and almost twice the area of the European Union. Located mostly in the southern hemisphere (Fig. 1), the CPLP countries covers quite different realities such as Brazil, fifth largest country in the world, and São Tomé and Principe, the second smallest state in Africa. Brazil alone is 79.51% of the land area of the CPLP while São Tomé and Principe is
only 0.01% [2].
The total population of the CPLP in 2013 exceeded 262 million people, about half of the EU population and 80% of the USA population, but with much faster demographic growth, with an annual average population growth of 1.2% per year. By 2050 the population of the current CPLP member states is expected to exceed 360 million people. Brazil has, by far, the largest population, above 200 million people (76%), but the population is growing more rapidly in Equatorial Guinea (2.8%), Mozambique (2.7%) and Angola (2.5%).
In 2013, the nominal Gross Domestic Product (GDP) of CPLP countries was USD 2620 billion. Average gross national product (GNP) per capita was USD 6821, but with a very asymmetric distribution, since Portugal, Equatorial Guinea and Brazil decisively inflate that mean. The remaining six members have an average GNP of USD 4147, with the lowest values recorded in Mozambique (USD 590) and Guinea‐Bissau (USD 520). Angola, Cape
T
‘Angola, East Timor, Guinea‐Bissau and
Mozambique are rank among the
world’s most vulnerable countries to
climate change.’
Fig. 1– CPLP member states.
Fig. 2 – Evolution of CPLP countries CO2 emissions and in the global context in 2012. Source: JRC [3].
Verde and Mozambique are, however, among the 10 African countries with the highest income growth between 2000 and 2012, while Guinea‐Bissau is at the opposite pole, the sixth African country with the worst performance [2]. Equatorial Guinea has the highest per
capita income in Africa, with a two‐digit GDP growth
rates for much of 2000 ‐ 2010, although it has experienced modest or even negative growth in recent years. Despite the economic growth, East Timor, Equatorial Guinea, Mozambique, São Tomé and Principe and Guinea‐Bissau still have high poverty rates, at or above 50% [2] and therefore are classified as Least
Developed Countries (LDC). It is expected that by 2016
Equatorial Guinea will move into the Developing Country classification, a status that applies to Brazil and Cape Verde [3]. Portugal is classified as a Developed Country.
This socio‐economic environment is reflected in low CO2
emissions rates from the fossil fuel combustion and cement production (Fig. 2) [2]. CO2 emissions have
consistently increased from 278 Mt in 1990 to 538 Mt in 2012, an average increase of 11 Mt per year [4]. These represent a small proportion of the global emissions since the per capita value remain low, reaching 2.05 tonnes in 2012, a value comparable to that of India, but with a gradual increase from the 1.4 t/a recorded in 1990 (Fig. 2).
The distribution of emissions is very asymmetric, with Brazil consistently accounting for 80%‐85% of CO2
emissions (Fig. 3), which reflects the Brazil’s dominant size in the CPLP. Guinea‐Bissau, East Timor, and the archipelago countries of Cape Verde and São Tomé and Príncipe, in 2012 were together responsible for CO2
emissions of less than 1 Mt. The distribution of per capita CO2 emissions, differs considerably, with Equatorial
Guinea (6.7 t/a) and Portugal (5 t/a) showing the highest values, with Brazil (2.2 t/a) and Angola (1.6 t/a) being the only other member states with per capita emissions above unity.
All CPLP countries, with the exception of Portugal, are located in tropical regions. According to several ‘vulnerability to climate changes’ indices [5‐9] Angola, East Timor, Guinea Bissau and Mozambique consistently rank amongst the world’s most vulnerable countries to climate change. One such index, ND‐GAIN [7], assesses the vulnerability and the readiness to face climate change. It shows that Angola, Guinea‐Bissau, East Timor, Mozambique and São Tome and Principe are very vulnerable to climate change and the readiness to face those changes is low. The vulnerability of Cape Verde is also high, but readiness is better. Vulnerability to climate change is lower in the Equatorial Guinea, Brazil and Portugal.
Fig. 3 – Distribution of the 538 Mt CO2 emitted by CPLP member states in 2012. Source: JRC [3]. Angola 3.95% Brazil 85.53% Portugal 9.13% Mozambique 0.76% Equatorial Guinea 0.49% Guinea-Bissau 0.06% Cape Verde 0.03% S. Tomé and Príncipe 0.02% East Timor 0.04% 1.39%
2 Status of CCS activities in CPLP countries
ortugal is the only CPLP member to be an AnnexI Party to the United Nations Framework Convention on Climate Change (UNFCCC) and its emissions reduction targets were set within the EU‐15 burden sharing agreement. All other CPLP countries are Non‐Annex I parties to the UNFCCC and non‐Annex B parties to the Kyoto Protocol; with no commitment to reduce CO2 emissions. Consequently,
there has been no policy or economic drivers for engaging in CO2 reduction technologies such as CCS. Only
Brazil and Portugal have consistently developed CCS activities, with the drivers being the need to assess the impact of the technology in specific sectors, namely, the power and cement sectors in Portugal and the hydrocarbon upstream sector in Brazil. Stakeholders and authorities in the other CPLP countries have been involved in workshops about the technology, but that involvement never resulted in CCS activities or projects. This chapter addresses the past and ongoing activities in Brazil and Portugal, while the prospects for the other CPLP countries, the main focus of this report, are addressed in chapter 3.
Brazil
Brazil is, by far, the largest CO2 emitter in the CPLP. In
2010, it was responsible for 419 Mt of CO2 emissions
from fossil fuel combustion and cement production, roughly 85% of total emissions in the CPLP [10]. Nevertheless, per capita CO2 emissions in Brazil remain
relatively low, at 2.2 t/a in 2010, partly because over 80% of Brazil’s electricity is produced from hydropower (Fig. 4). On the other hand, emissions from industrial and fuel combustion sectors are high, because Brazil is one of the world’s largest manufacturers of cement, aluminium, chemicals, and petrochemical feedstock, and currently ranks as the world’s 12th oil producing country.
Accordingly, in the near future, CCS in Brazil is more
relevant for the industrial sectors than for power production.
Status of CCS activities
In December 2010 Brazil approved a law to reduce its emissions by 36.1% to 38.9% in 2020 compared to business‐as‐usual emissions, but CCS was not included in the emissions reduction portfolio. Nevertheless, state oil company PETROBRAS has been a long‐term proponent of CCS and has been injecting CO2 for Enhanced Oil
Recovery (EOR) since 1987, at the Buracica oil field and at the Miranga Pilot project, where CO2 injection began
in 2009 [11].
PETROBRAS currently operates a large‐scale integrated CCS project, the Lula Oil Field CCS Project, the only offshore CO2‐EOR project in the world. Since June 2013
CO2 captured from natural gas produced from the Santos
Basin, which lies between 5,000‐7,000 metres below sea level, is compressed and re‐injected into the producing reservoir for EOR purposes. Expectations are that 0.7 Mt/a CO2 will be injected. By 2020, PETROBRAS expects
to install 20 new floating production systems in the Pre‐ Salt province, many of them to include CO2 injection for
EOR purposes [12, 13].
PETROBRAS is also the leading force behind most of the R&D on CCS conducted in the country, with expected investments from 2010 to 2015 on the order of USD 150 million, mostly within the framework of two R&D Technology Programs [14]:
o EMISSÕES ‐ Technological Program for Atmospheric Emission Reduction, comprehensive and long‐term, including climate change impacts, vulnerabilities and adaptation;
o PROCO2 ‐ Technological Program on CO2
Management of Pre‐salt, with a focus on the issues of CO2 in the development of Santos Basin Pre‐salt
cluster.
In these programs together with the Federal University of Santa Catarina, PETROBRAS installed the CO2 MMV
Field Lab, the first of its kind in South America, designed
to fill knowledge gaps in CO2 management technologies.
Another important project is the CO2 Capture Laboratory
in the National Institute for Space Research (INPE), with a focus on the development of new materials for hydrocarbons combustion using a chemical looping process.
P
Fig. 4 –Share of CO2 emissions from the energy sector in Brazil, EU and USA and world in 2005 [13].
PETROBRAS is also active at the international cooperation level, being a member of the IEAGHG and CSLF, and participating in several international projects. As part of the CCP initiative, PETROBRAS has invested and developed an oxy‐combustion capture pilot trial on a fluid catalytic cracking unit at a research complex in Paraná, Brazil.
Many Brazilian universities and research centres are engaged in CCS R&D projects with support from PETROBRAS. In 2007, a joint venture between the company and the Pontifical Catholic University of Rio Grande do Sul (PUCRS) resulted in the establishment of a dedicated CO2 storage research centre, the CEPAC
(Centre of Excellence in Research and Innovation in Petroleum, Mineral Resources and Carbon Storage), currently one of the key R&D and capacity development stakeholders in the country. CEPAC carried out the CARBMAP project ‐ the Brazilian Carbon Geological Sequestration Map ‐ concluded in 2011. The project assessed storage capacity in the country and estimated an effective storage capacity of about 2000 Gt. Besides running many other R&D projects, such as the Porto Batista CBM/ECBM Pilot Site (being developed jointly with PETROBRAS and COPELMI) CEPAC has hosted several workshops to increase CCS knowledge within key stakeholders and the local community [11].
CCS in the coal industry
Although Brazil is not a major coal producer, it has mining companies active in several countries, including several CPLP members. Brazil’s coal industry is investing in CCS research to develop its low‐emission options and the Brazilian Mineral Coal Association (ABCM) has established the Clean Coal Technology Centre and plans to invest USD 6.5 million from 2010‐16, including building a dedicated CCUS laboratory. The ABCM also collaborates with the US NETL on a CO2 capture R&D
program, and on building capacity [15].
Bio‐CCS
Brazil has long been a leader in bio‐fuels production. The possibility of connecting this experience with CCS is recognized in the country and bio‐CCS is a focus of research. The University of São Paulo, through the Brazilian Reference Centre on Biomass and the Carbon Emission Policy and Regulation Group, is actively investigating the potential for bio‐CCS in Brazil and estimate that it could contribute up to 5% of the country’s emission reductions from energy production [11].
CCS in the Cement and Iron and Steel sectors
Despite the importance of the cement sector to the Brazilian economy, currently producing around 70 Mt/a of cement, and being the 5th largest producer in the
world, the sector does not seem to be engaged in any major CCS R&D in the country. The Iron and Steel sector is also quite important in Brazil, but no engagement in CCS activities is known.
Brazil's self‐assessment on CCS
In April 2014, at a CCS roundtable in Rio de Janeiro, participants were asked to self‐assess the status of CCS in the country. Participants considered that contribution of CCS to effectively address climate change was still not well understood by many officials in Brazil. Although the technology is well recognized by PETROBRAS, some business sectors and by many academics, the lack of government support was highlighted as a significant concern, with low priority given to the technology in national and sub‐national climate policies in Brazil. Increasing governmental engagement in the discussion, as well as providing supportive policies and regulations that enhance the diffusion and implementation of CCS, are key issues [16].
An important step towards the development of CCS in Brazil was the recent publication by CEPAC of the Brazilian Atlas of CO2 capture and geological storage [17].
It is expected that this publication will contribute to broaden the knowledge of CCS in Brazil, bringing more attention to stakeholders and increasing public perception.
Portugal
This publication integrates the CCS‐PT roadmap study for Portugal, a project that clarifies the role of the technology in the Portuguese context and its potential need in the power and industrial sectors in the coming future. The CCS‐PT project builds greatly on the data and information gathered in previous CCS activities in Portugal.
‘The carbon sequestration and climate
change network was promoted by
PETROBRAS’ to address challenges on
CCS and climate change. USD 17 million
were invested from 2006 to 2013.’
CO2 capture activities
Several CO2 capture studies have been conducted at
academic level, but the most relevant projects were led by or involved the industry and energy sectors. The main power production company in Portugal, EDP, has been involved in several CO2 capture projects co‐funded by the
EU, including [18]:
o The NanoGLOWA project, investigating the use of membrane technology to capture CO2, including a
pilot experiment at the Sines power plant in Portugal; o The DECARBIT project, aiming to enable zero‐ emission pre‐combustion power plants by 2020 with a capture cost of less than 15€/tCO2, and including
several pilot tests;
o The FLEXYBURN CFB project, aiming to develop and demonstrate a power plant concept based on the Circulating Fluidized Bed technology combined with CCS and including a 30MW pilot plant in Spain. Another power production company, TEJO ENERGIA, under the KTEJO project, assessed the technical‐ economic viability of retrofitting its Pego coal power plant, the 2nd largest in the country.
In industrial sectors, there has been activity on CO2
capture in the cement and oil refinery sectors. GALP ENERGIA, the main Portuguese oil company, undertook a pilot project for capture of CO2 by algae and its reuse as
biofuels. In the cement sector, the two Portuguese companies CIMPOR and SECIL have implemented pilot capture projects from clinker production through microalgae. The Portuguese cement sector companies are also involved in CCS studies carried out by the European Cement Research Academy.
CO2 transport activities
The main research study on CO2 transport in Portugal
was the EU co‐funded COMET project, which sought to define an integrated transport and storage infrastructure in Portugal, Spain and Morocco. The project involved most of the major CO2 emitters in Portugal, from the
energy and industry sectors, and included the definition of a pipeline network for CO2 transport considering the
cost optimization of the whole CCS chain. COMET provided the first integrated approach to the cost‐ effectiveness of CCS in the Portuguese context, work which was carried out and developed within the CCS roadmap. The project also included an assessment of the viability of CO2 transport by ship.
CO2 storage activities
Within the scope of the KTEJO and COMET projects, systematic analysis of the storage capacity in deep saline aquifers was conducted at the regional scale, resulting in effective storage capacity estimates of up to 7.6 Gt of CO2, the vast majority (above 90%) of which in offshore
environments. Storage capacity in the Douro coal basin is also being studied at University Fernando Pessoa.
Assessment of CCS status in Portugal
Portugal lacks specialized technical and scientific capacity in the various components of the CCS chain. As a first effort in building capacity, the EU COMET project included workshops and seminars in several Portuguese universities. The number of participants was usually above expectations, but it was recognized that the technology is still poorly known in the academic context. Knowledge about the technology among the wider public is certainly very low, as no systematic public awareness program has yet been undertaken. However, knowledge about the technology among the industry and regulators is quite high, since many of them have been, at some point, involved in CCS activities.
On the regulatory side, it is very positive that the CO2
storage activities are now regulated by Law 60/2012, the transposition of the EU CO2 storage Directive 2009/31/EC,
and it nominated the Direcção Geral de Energia e
Geologia as the licensing and regulating authority, with
the Agência Portuguesa do Ambiente being engaged as the authority for Environmental and CO2 emissions
accountability.
The publication of the CCS‐PT roadmap study, of which this report is an integral part, will contribute to a better understanding of the role that the technology can play in Portugal, enabling authorities, policy makers and stakeholders to make informed decisions regarding the deployment of the technology in the country. More information about the Portuguese CCS‐PT project can be found at http:\\ccsroadmap.pt and at the GCCSI website.
‘The CCS roadmap for Portugal clarifies
the role of the technology in the
Portuguese context and its potential
need in the power and industrial sectors
under a low carbon economy scenario.’
3 Prospects for CCS activities in the CPLP
he lack of CCS activities in the CPLP countriesother than Brazil and Portugal reflects the lack of drivers for deploying the technology. However, the eligibility of CCS projects within the Clean Development Mechanism (CDM) project level activities [19], the rapidly evolving CO2 emissions profile
of some of the CPLP countries and the reinforced interest in the use of CO2 for EOR purposes, have given an
incentive to assess the possibility of deploying CCS projects in CPLP countries.
3.1 Industrial and energy context and CO2
storage opportunities
This section briefly characterizes the endogenous fossil fuel resources, the energy and industrial sectors, CO2
emissions profile and discusses CO2 storage possibilities
for each of the CPLP countries where CCS activities have yet to be deployed. Portugal and Brazil, already engaged in several CCS projects, are not included in this analysis.
Angola
Endogenous fossil fuel resources
Angola is an OPEC member and the second‐largest oil producer in Sub‐Saharan Africa with almost 9.1 billion barrels of proven oil reserves. In 2013, Angola produced 94.0 Mtoe of oil (Fig. 5), amounting to almost 80% of total government revenue [20]. Natural gas production almost quadrupled over the past 20 years, from 2.5 Mtoe in 1990 to 9.5 Mtoe in 2012, but despite holding considerable reserves, Angola is still a small natural gas producer since 91% of the natural gas associated to oil production is re‐injected, vented or flared. Angola only began exporting liquefied natural gas in 2013 when Angola's first LNG plant, at Soyo, started operations [20].
Table 1‐ Primary energy sources 2012.
Biomass / Waste Hydro Oil Gas Energy (ktoe) 8384 343 4942 614
Share (%) 58.7 2.4 34.6 4.3 Source: IEA [20].
Primary energy consumption
Electricity supply covers only around 40% of the population [2] and in 2012, 59% of the primary energy consumption consisted of traditional solid biomass and waste [21] (Table 1). Angola consumed 4.9 Mtoe of petroleum products in 2012 (Fig. 5), almost 35% of
primary energy sources, and almost twice the volume consumed a decade ago [20]. Installed electricity capacity is 1.8 GW, of which 70% is from hydroelectric plants [21]. The remainder electricity generation
comes from 24 small to medium size thermal power plants [22]. Plans have been announced to increase the generation capacity to 9.0 GW by 2025 [23], mostly from dams. However, natural gas fuelled generation is likely to become increasingly important, with a 500 MW natural gas power plant in Soyo [24] scheduled to come online in 2015, and a 75 MW plant at Cabinda [24] also planned. The government aims that by 2025 electricity will be available for 60% of the population, with hydropower representing 15% of the sources, oil and gas 55%, and reducing the use of biomass to 30% [23].
Carbon intensive Industries
The cement market in Angola has enjoyed years of double‐digit growth since the end of the civil war [25]. Angola has two long run cement factories [26]: the SECIL factory, located in Lobito, has a capacity of about 250 kt/a of cement; and the NOVA CIMANGOLA factory, in Luanda, with a capacity of about 1.2 Mt/a. Recent years have seen the construction of three new cement factories; CIMENFORT in Benguela province, FCKS and CIF plants in Luanda. The installed capacity is now over 6 Mt/a, but prospects for the sector are still positive and two new plants are expected to start operations by 2016. Angola has a single small refinery, built in 1955, with a capacity of 39 000 bbl/d, but a new refinery in Lobito is scheduled to come online in 2017, with an expected processing capacity of 200 000 bbl/d [26].
High quality soil and good water supply makes farming a valuable industry for Angola and investments in fertilizers and methanol are likely to gain importance. In 2014, Angola approved a bill to promote biofuels and the Bio‐Energy Company BIOCOM is developing a plantation in Malanje for the production of ethanol and 160 000 MWh of bioelectricity per year [26]. Area: 1247000 km2 Population (2013): 21.47 million GNP (2013): USD 121 700 million 0 50 100 150 1990 1995 2000 2005 2010 Mtoe Natural gas consumption Natural gas production Oil consumption Oil production Fig. 5 – Fossil fuels production and consumption in Angola. Source: EIA [19]. Fig. 6 – CO2 emissions from consumption of fossil fuels, gas flaring and cement production. Source: CDIAC [9]. 0 0.5 1 1.5 2 0 10 20 30 40 1990 1995 2000 2005 2010 Pe r capi ta CO 2 e m is si oon s (t /a ) CO 2 emi ss io n s (M t/
a) OilFlaring CementGas
CO2 emissions
CO2 emissions from consumption of energy, gas flaring
and cement production increased from 4.4 Mt in 1990 to 30.4 Mt in 2010 (Fig. 6), a seven fold increase following the boom in oil production and gas flaring from 2002 onwards [10]. CO2 emissions due to venting or gas flaring
account for 45% of the total emissions. Cement and gas consumption still represent a small share of the emissions, but they have been increasing in recent years due to the new plants and factories that came online. Per
capita CO2 emissions are low ‐ 1.6 t/a in 2010.
Opportunities for CO2 storage
CO2 storage opportunities in Angola must be sought in
the sedimentary basins, namely in deep saline aquifers, depleted oil and gas fields and use of CO2 in EOR. Other
potential scenarios, such as storage in coal seams and in ultramafic and basaltic rocks, are not feasible due to the lack of extensive coal and volcanic provinces in Angola. Seven sedimentary basins are known in Angola [27], grouped into Atlantic basins and Interior basins (Fig. 7. The Atlantic basins, composed by the Cenozoic‐ Cretaceous coastal basins (Lower Congo basin, Kwanza basin, Benguela basin and Namibe basin) are those currently being explored and developed for hydrocarbon resources. Currently, oil production comes entirely from the Lower Congo basin, in the Cabinda and Soyo areas, almost exclusively from offshore fields. In the Soyo area there is small‐scale onshore production (Fig. 7).
The obvious targets for CO2 storage are the exploited oil
fields in the Lower Congo basin, particularly in the Soyo area since it is favourably located with respect to the main industrial sources. The Cabinda area may be less attractive given the longer transport distances. Transboundary storage and transport issues may be important for the Soyo and Cabinda areas, due to the proximity with Democratic Republic of Congo territory, and specifically to address issues of onshore transport to the Cabinda region.
The oil field sector that are becoming depleted present ideal opportunities since the cap‐rocks have proved their adequacy and the fields are well characterized. The possibility of utilizing CO2 in EOR in the depleted sectors
is of obvious interest and should be addressed from an economic perspective.
The Kwanza basin, particularly in its onshore sector, seems very promising and worth screening for CO2
storage in deep saline aquifers, given the existence of salt formations that could both provide good cap‐rocks and be the source of high salinity groundwater due to salt leaching. This basin has an extensive onshore sector (the largest from the Atlantic basins) and is very well located with respect to the sources in and around the country capital, Luanda.
On the other hand, the onshore sectors of the Benguela and Namibe basins are very narrow and are likely to be unsuitable for storage of large volumes of CO2, due to
geological structure constraints. Thus, in these basins, and particularly in the Benguela basin where stationary sources (cement factories) exist, efforts to assess CO2
storage capacity should probably focus on the offshore sectors, with the obvious penalty of higher storage costs compared to onshore storage scenarios.
The Interior basins, composed by the Kassanje graben, the Okavango basin and the Ovambo (Etosha) basin are virtually unknown since field work in those areas could only start following the end of the civil war. They are now being the subject of interest by the national oil company, SONANGOL. They are also very distant from the main industrial development centres and CO2
sources, and appear to have less interest for CO2 storage.
‘Depleted oil fields and use of CO
2in
EOR in mature oil fields are promising
options for CO
2storage in Angola.’
Fig. 7 – Sedimentary basins in Angola. Adapted from SONANGOL [26].
Cape Verde
Primary energy consumption
Cape Verde comprises an archipelago of 10 islands, located around 570 km from the west coast of Africa. Despite its scarce natural resources, Cape Verde has seen fast economic growth over recent decades [20] and since 2007 has been classified as a Developing Nation [3], being together with Brazil and Portugal, the only CPLP member states that are not classified as a Least Developed Country. This economic growth was reflected in an increase in primary energy consumption.
Table 2 ‐ Primary energy sources 2008. Biomass Wind Oil Energy (ktoe) 2.8 0.5 118
Share (%) 2.3 0.4 97.3 Source: IEA [20].
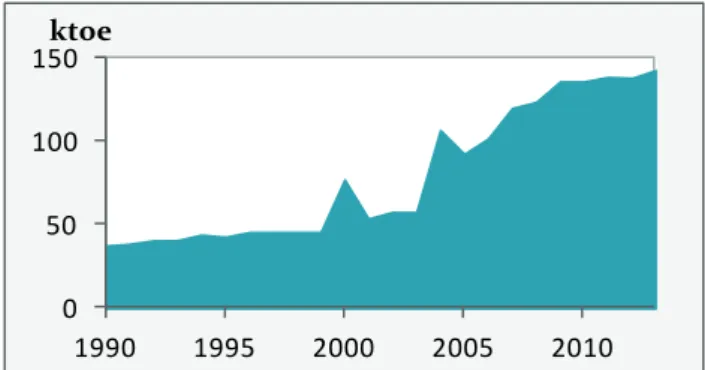
From 1990 to 2012, petroleum products consumption has increased by almost a factor of 4, with the bulk of that increase occurring since 2003, from 37.6 ktoe to 138.0 ktoe [20] (Fig. 8). Since Cape Verde does not have any endogenous fossil fuel resources, it needs to import all the petroleum products it consumes. Indigenous energy resources consist essentially of biomass, wind and
solar. Although potential is very high, wind energy production is still limited (Table 2).
As of 2013, the electricity grid covered around 87% of the population [2] (100% coverage in the main islands), water desalination consuming
up to 10% of the electricity production. Installed capacity in 2012 was 156.5 MW, with 78% of the capacity being provided by diesel thermal power plants, and the remainder being covered by wind (17%) and solar sources (5%) [28].
The fast economic growth needs to be met with a growing energy capacity, and the government plans to have an installed capacity of 300 MW by 2020 [29]. This energy need is likely to be met by renewable sources, since the country has excellent wind and solar capacities. Cape Verde is one of the 15 countries with the best wind resource in Africa and the potential for solar energy of Cape Verde is very high: 6 kWh/m² per day. A recent study has also indicated that there is 3 MW of geothermal capacity on Fogo island [30]. In total renewable capacity is estimated at about 2600 MW. The Cape Verde government commitment is that, by 2020, renewable sources will provide 50% of the power mix, with at least one island fully supplied by renewable energies [29].
CO2 emissions
The economy of Cape Verde is service‐oriented, with commerce, transport and public services being responsible for 70% of the country’s GDP. Given the archipelago nature of the country, with power production facilities specific to each island, the diesel power plants are not large single sources. Furthermore, there are no major industry CO2 sources, such as cement
factories or refineries. CO2 emissions are mainly
connected to oil products as the primary energy source. The trend of CO2 emissions has followed economic
growth, increasing by a factor of 4 from 1990 to 2010, but emissions are still low, staying at just 0.35 Mt in 2010, with the per capita values around 0.73 t/a (Fig. 9).
Prospects for CCS activities
Given the low level of CO2 emissions and the near
absence of large point sources, which is likely to continue, given the renewable energy potential and the
Area: 4033 km2 Population (2013): 499 000 GNP (2013): USD 1888 million Fig. 8 – Oil consumption in Cape Verde. Source: EIA [19]. 0 50 100 150 1990 1995 2000 2005 2010 ktoe Fig. 9 – CO2 emissions from consumption of fossil fuels. Source: CDIAC [9]. 0 0.2 0.4 0.6 0.8 0 0.1 0.2 0.3 0.4 1990 1995 2000 2005 2010 Pe r ca p it a CO 2 em is si o o n s (t /a ) CO 2 emi ss io n s (M t/ a) OilPer_capita
archipelago nature of the country, CCS is probably not a relevant climate change mitigation technology for Cape Verde.
There are, however, CCS related activities that could be relevant for Cape Verde. The Cape Verde islands are of volcanic origin, although only the Fogo Island remains active. On this island there are several natural emissions at fumaroles, mostly hot sulphur steam, but possibly also linked to natural CO2 [30]. It is suggested that research
activities be carried out into these natural emission sources to test leakage detection methodologies, especially airborne geophysics, and the effects of natural CO2 emissions to the surrounding environments.
Furthermore, basalts outcrop extensively in several islands of the archipelago, and can provide suitable conditions for research projects focused on CO2 storage
through in situ mineral carbonation in those rock types, complementary to the field tests being conducted in Iceland and in the Columbia River basalts in the USA.
A further relevant CCS activity for Cape Verde is envisaged in connection to the geothermal potential identified by GESTO ENERGY on Fogo Island [30]. A total geothermal capacity of around 3 MW was estimated for a reservoir inferred from geophysical data to be at least 100 m deep (Fig. 10). There are, however, doubts about the existence of a proper geothermal reservoir, since water samples were not conclusive. The use of CO2 as a
fluid to Enhance Geothermal Systems (EGS) is being studied actively at the R&D level (e.g. [31]). In this process CO2 is injected to recover heat from dry or
saturated rock, since CO2 is more efficient than water,
with a fraction of the injected CO2 being sequestered in
the rock by mineral carbonation or simply by migrating away from the injection and recovery wells. If the use of CO2 in EGS is proved technical and economically valid, it
may be an option for production of geothermal energy from dry rocks in the Fogo Island. The lack of major CO2
sources in the archipelago will be an obstacle for economic viability, but both geothermal projects and CCS projects are admissible activities in the CDM and issues about economic viability may be overcome if the value of CDM credits improves.
Therefore, although CCS is probably not a climate change mitigation technology required for Cape Verde, there are activities that can be relevant for the national and international R&D community and could motivate the involvement of the relevant authorities in CCS awareness events. The Cape Verde volcanic islands can be a natural laboratory for international cooperation on R&D related to natural CO2 emissions effects and monitoring, CO2
storage in basalts and eventually for use of CO2 as the
working fluid in EGS projects, since these may allow for exploitation of the existing geothermal resources under
the scope of CDM projects.
‘The use of CO
2as the circulating fluid in
EGS seems to be the most interesting
option for Cape Verde, especially in the
framework of CDM projects.’
Fig. 10– Geothermal potential in the Fogo island, Cape Verde. Adapted from Gesto Energy [29].
East Timor
Endogenous fossil fuel resources
East Timor became a sovereign state in 2002 and joined the CPLP that year. Despite a 2002 ranking of being amongst the poorest countries in the world, East Timor has seen since then an average economic growth of nearly 9% per year [2]. This rapid growth cannot be dissociated from offshore oil production at the Timor Gap. East Timor proven oil reserves are estimated at 554 million barrels. In 2012, Timor‐Leste produced 4.1 Mtoe of oil (Fig. 11). Natural gas exploration is yet to begin, but the reserves are vast, estimated at 201 Gm3, with
ongoing negotiations to define the location of processing facilities [20].
East Timor’s economy is one of world's most natural resource‐dependent, with around 90% of the government budget being derived directly from petroleum revenues.
Primary energy consumption
East Timor is heavily dependent on imports for power generation, with more than 75% of oil imports being used for electricity production through diesel‐generator sets [32]. Nevertheless, traditional use of biomass and waste are a significant proportion of the primary energy sources in the country, perhaps responsible for around
90% of the energy requirements for cooking and heating applications [20]. The electricity generation system is small and fragmented, and is mainly based on
small and medium size diesel power plants. The installed capacity in Dili, the capital, is 19 MW, while, in the rest of the country, capacity is roughly 16 MW. Another 10 MW are installed by large consumers as their sole power supply or as backup. The electrification is overwhelmingly concentrated in urban areas, with an electrification rate of only around 37% [32]. Plans are underway for the expansion of the power generation infrastructure, with the proposed installation of an additional 210 MW. The country has significant renewable energy potential, with hydropower able to supply 75 MW to 95 MW and with good prospects for wind and solar energy. By 2020, the government plans that 50% of the power is generated from renewable sources [33].
Carbon intensive Industries
Other than the diesel power plants, there are, currently, no major stationary sources in the country, such as refineries, cement or steel factories. However, the government has been promoting internal and foreign investments in key industrial areas. TIMOR GAP, the national oil company, has announced plans to build the first refinery and petrochemical plant at Nova Betano to provide diesel, gasoline, jet‐fuel, and LPG.
The East Timor government is committed to natural gas from the Great Sunrise gas field being processed in a LNG plant to be built onshore, in Beaço, on the south coast of the country [33]. However, no agreement has been reached yet with the joint venture owning the concession rights for the gas field.
Australian based companies BGC and SWAN ENERGY have announced the construction of a cement factory in Baucau, the 2nd largest city in the country, with a
processing capacity of 1.5 Mt of cement per year. Construction is scheduled to start in 2015 [34].
CO2 emissions
CO2 emissions are mainly related to the consumption of
petroleum products, namely for power production, given the absence of other large point sources. As such, CO2
Area: 14954 km2 Population (2013):1.178 million GNP (2013): USD 311 million Fig. 11 – Oil production and consumption in East Timor. Source: EIA [19]. 0 2 4 6 1990 1995 2000 2005 2010 Mtoe Oil production Oil consumption Fig. 12 – CO2 emissions from consumption of fossil fuels. Source: CDIAC [9]. 0 0.1 0.2 0.3 0.4 0.14 0.15 0.16 0.17 0.18 0.19 0.2 2002 2004 2006 2008 2010 Pe r capi ta CO 2 e m is si oon s (t /a ) CO 2 e m is io sn s (M t/ a) OilPer_capita
emissions are very low, reaching only 183 kt in 2010 [10]. Emissions have increased since 2002, when the country become a sovereign state, but per capita CO2 emissions
are still very small, just around 0.15 t (Fig. 12). Nevertheless, the planned industrial investments (refinery, petrochemical plant, cement factory and LNG plant) will increase significantly the emissions of the country in the coming years.
Opportunities for CO2 storage
According to the East Timor Strategic Development Plan [33], the increase in electricity production capacity will be achieved primarily through renewable sources, so it is not likely that the power sector emissions will increase significantly. Thus, the motivation for CCS activities in East Timor is likely to be connected with the oil and gas production and processing, and associated industrial investments (refinery, petrochemicals, LNG).
East Timor sits in an extremely complex tectonic setting, at the eastern end of and just south of the Banda Volcanic Arc, the surface expression of subduction as the Australian crustal plate moves underneath the Eurasian plate. For the last 5 million years that subduction has become ‘locked’ in the Timor region, causing the island of Timor to be thrust upwards [35].
The complex tectonic setting is reflected in the chaotic geology, with the island broken into many structural units. Basement (Lolotoi Complex) and metamorphic rocks (Aileu Complex), resulting from the continental collision (Fig. 13) are unsuitable for CO2 storage.
Mesozoic sediments lie in basins on top of these basement lithologies and Cenozoic and recent reefal limestones continue to be laid down (Fig. 14). The geology in the southern coast of the East Timor is dominated by these Meso‐Cenozoic sedimentary basins. However, the fragmented and chaotic nature of rocks leaves little prospects to consider CO2 storage, as is
proved by the many oil and gas seeps along the southern coast of the island [36]. The same tectonic constraints apply offshore.
CO2 storage is being considered in countries in complex
tectonic conditions (e.g. Japan, Indonesia), and the Nagaoka pilot injection site, in Japan, proved that CO2
storage sites can remain unaffected even if subjected to magnitude M=6 earthquakes in close vicinity to the injection site. Nevertheless, a precautionary approach should consider CO2 storage in East Timor only in
connection to the oil and natural gas fields, not only because containment conditions are guaranteed, but also because pressure increases would be smaller than considering storage in deep saline aquifers.
The possibility of utilizing CO2 for EOR in the exploited
sectors is of obvious interest and should be addressed from an economic perspective in the future, since production is still recent and fields may yet be far from maturity and depletion.
Although it is likely that in the near future large scale CO2
sources will be built in East Timor, the sensible approach is probably to consider that CCS activities in East Timor would most likely be connected to the oil and gas exploration industry, either through the use of CO2 in
EOR activities, or by injection of CO2 in depleted oil and
gas reservoirs in the offshore sectors currently being exploited. In that respect, it is relevant that Australian companies are involved in the production of hydrocarbons in the Timor Gap, given the Australian
experience in CO2 storage. Fig. 13– Simplified geology of East Timor. Adapted from Thomson et al. [34].
‘The tectonic setting of East Timor advises
for considering storage of CO
2only in
depleted oil and gas fields or for EOR.’
Fig. 14– Schematic of East Timor tectonic framework. Adapted from Thomson et al. [34].
Equatorial Guinea
Endogenous fossil fuel resources
Equatorial Guinea is the most recent member of the CPLP, having joined the community in July 2014. It is the third‐largest oil producer in sub‐Saharan Africa, after Nigeria and Angola, with proved reserves of 1.1 billion barrels, and with a production of 14.9 Mtoe in 2012, entirely from offshore fields (Fig. 15). Natural gas reserves are also significant, amounting to 36.8 Gm3, and
the country is a net exporter of natural gas, with dry natural gas production increasing from 1.2 Mtoe in 2001 to 7.3 Mtoe in 2012. Most of the natural gas is processed and exported from a local LNG plant which produced 4.9 Gm3 of LNG in 2012 [20]. The LNG plant runs a single
train, and a second train is to start operations 2016 [37].
Equatorial Guinea's economy is heavily dependent on the oil and gas industry, which accounted for almost 95 percent of its GDP and 99 percent of its export earnings in 2011 [2].
Primary energy consumption
Natural gas became the primary energy source after 2000, following the start of hydrocarbons production, and in 2008 was responsible for 77% of the primary energy supply. Oil products and traditional use of
biomass, which
dominated the energy sources in the 1990’s, are now responsible for
minor shares,
respectively 20% and 3%. Renewable sources were poorly exploited [38]. However, this scenario changed in 2013, when the Djibloho dam, on the
Wele River, went online with an installed electricity production capacity of 120 MW, about three times the previous existing capacity in the country [20].
The electrification rate is now one of the highest in Central Africa, covering 66% of the population [39]. There are still about 40 MW of electricity capacity provided by gas‐fired power plants (the Punta Europa plant and the AMPCO plant having a joint capacity of 34 MW) and by oil‐fired power plants. Hydropower potential is very high, estimated at some 2600 MW, and further investments are planned, including the Sendje river hydro scheme which is due for completion in 2015, with a capacity of 200 MW.
Carbon Intensive Industries
Apart from the oil industry, Equatorial Guinea’s economy is based on agriculture, forestry and fishing, so that no major industrial CO2 sources exist, other than the LNG
plant and gas flaring. Equatorial Guinea does not have an oil refinery, but the Government has announced plans to open a 20 Mbbl/d refinery in Mbini [20]. OPHIR ENERGY also announced the construction of a Floating LNG plant[40].
There are no cement factories in the country, but a factory with a production capacity of 3000 t/d has been commissioned and operations should start in 2016 [41]. With an estimated biomass potential of 400 tonnes/ha or more, Equatorial Guinea has extensive biomass coverage [42]. Potential for bioenergy production is high [43], but no investment plans have been announced yet. CO2 emissions
CO2 emissions in Equatorial Guinea experienced a
remarkable increase with the onset of hydrocarbon production in 2000. In 1999 CO2 emissions were at 0.36
Mt, but in 2000 those emissions increased almost 10 fold, to 3.1 Mt, with the vast majority coming from the flaring of gas at oilfields. CO2 emissions peaked in 2004 at Area: 28051 km2 Population (2013): 757 thousand GNP (2013): USD 15570 million 0 5 10 15 20 25 30 1990 1995 2000 2005 2010 Mtoe Natural gas consumption Natural gas production Oil consumption Oil production Fig. 15– Fossil fuels production and consumption in Equatorial Guinea. Source: EIA [19]. Fig. 16 – CO2 emissions from consumption of fossil fuels. Source: CDIAC [9]. 0 5 10 0 2 4 6 8 1990 1995 2000 2005 2010 Pe r ca p it a CO 2 em is si o o n s (t /a ) CO 2 emi ss io n s (M t/ a) Flaring Oil Gas Per_capita
![Fig. 2 – Evolution of CPLP countries CO 2 emissions and in the global context in 2012. Source: JRC [3].](https://thumb-eu.123doks.com/thumbv2/123dok_br/14999909.1009735/6.892.86.438.115.527/fig-evolution-cplp-countries-emissions-global-context-source.webp)
![Fig. 4 –Share of CO 2 emissions from the energy sector in Brazil, EU and USA and world in 2005 [13].](https://thumb-eu.123doks.com/thumbv2/123dok_br/14999909.1009735/7.892.95.414.970.1095/fig-share-emissions-from-energy-sector-brazil-world.webp)