ISSN 0104-6632 Printed in Brazil
www.abeq.org.br/bjche
Vol. 33, No. 04, pp. 835 - 850, October - December, 2016 dx.doi.org/10.1590/0104-6632.20160334s20140149
Brazilian Journal
of Chemical
Engineering
ASSESSMENT OF CO
2
EMISSION MITIGATION
FOR A BRAZILIAN OIL REFINERY
W. N. Chan
1,2*, A. Walter
1, M. I. Sugiyama
2, G. C. Borges
21
Universidade Estadual de Campinas (UNICAMP), Campinas - SP, Brasil.
2
Petróleo Brasileiro S.A. (PETROBRAS), Refinaria de Paulínia, Rodovia Professor Zeferino Vaz, km 132, CEP: 13147-900, Paulínia - SP, Brasil.
Phone: + (55) (19) 2116 6236; Fax: + (55) (19) 2116 6800 E-mail: [email protected]
(Submitted: November 3, 2014 ; Revised: June 26, 2015 ; Accepted: July 8, 2015)
Abstract - Currently the oil refining sector is responsible for approximately 5% of the total Brazilian energy related CO2 emissions. Possibilities to reduce CO2 emissions and related costs at the largest Brazilian refinery
have been estimated. The abatement costs related to energy saving options are negative, meaning that feasibility exists without specific income due to emission reductions. The assessment shows that short-term mitigation options, i.e., fuel substitution and energy efficiency measures, could reduce CO2 emissions by 6%
of the total current refinery emissions. It is further shown that carbon capture and storage offers the greatest potential for more significant emission reductions in the longer term (up to 43%), but costs in the range of 64 to162 US$/t CO2, depending on the CO2 emission source (regenerators of FCC units or hydrogen production
units) and the CO2 capture technology considered (oxyfuel combustion or post-combustion). Effects of
uncertainties in key parameters on abatement costs are also evaluated via sensitivity analysis.
Keywords: Carbon dioxide emissions; Mitigation; Energy efficiency; Carbon Capture and Storage (CCS); Oil refinery; Marginal abatement cost.
INTRODUCTION
Currently Brazil does not have a quantitative obli-gation of emission reduction of Greenhouse Gases (GHG) under the United Nations Framework Con-vention on Climate Change. However, according to the National Policy on Climate Change, adopted in 2009, Brazil has set the voluntary goal of reducing GHG emissions by at least 36% (compared to a busi-ness-as-usual baseline) by 2020 (Interministerial Committee on Climate Change, 2008).
In addition to the national regulatory framework, some Brazilian states, like São Paulo and Rio de Janeiro, have created their own State Policy on Cli-mate Change. São Paulo State has established the global reduction target of 20% of the emissions of carbon dioxide by 2020 relative to 2005 levels (São Paulo, 2009).
Brazil is now emerging as a leading force in the oil sector. Over the last three decades, PETROBRAS – the national oil company – has made a series of large offshore discoveries, becoming a world leader in deepwater technology (IEA, 2013a). Furthermore, the Brazilian refineries have been modified to meet the goals of reducing the sulfur content of diesel and gasoline and of increasing the conversion of heavy crudes into high-quality medium and light products. So far the bulk of investments has been on adapting existing units and to install deep conversion (delayed coking) and hydrotreatment units (Castelo Branco et al., 2011).
products, including petrochemicals; new Brazilian stringent environmental regulations related to clean fuels; launching of new production technologies (e.g., heavy ends upgrading, product quality im-provement, efficient fuel usage, refinery emission control strategies) embedded into more complex refining schemes and subject to increasing complex-ity of the logistic hardware that interconnects crude oil terminals, refineries, and distribution centers (Joly, 2012).
Worldwide the oil refining sector is a major energy user and thus a relevant CO2 emitter. This sector currently is responsible for approximately 6% of the total European industrial CO2 emissions, i.e. 3-4% of all anthropogenic emissions in Europe (CONCAWE, 2011). In 2011, the Brazilian refining sector was responsible for 5% of the total amount of 409 million tonnes (Mt) of Brazilian energy-related CO2 emis-sions (PETROBRAS, 2014a; IEA, 2013a).
Currently Brazil has 12 refineries, mainly concen-trated in the southeast region of the country, with a total refining capacity of 2.1 million barrels per day (bpd) (PETROBRAS, 2014a). Replan (Paulínia Re-finery) is the largest national refinery with a crude oil throughput of 430,000 bpd.
Emissions from Brazilian petroleum refineries have increased from 18.2 Mt CO2e in 2005 to 25 Mt CO2e in 2013 (Chan, 2006; PETROBRAS, 2014a). This trend has primarily been driven by continuing growth in the demands for cleaner fuels (diesel and gasoline), resulting in higher total energy consump-tion in refining.
This so-called “petroleum refining paradox” im-plies that efforts to produce cleaner fuels, which would contribute to reduce emissions of sulfur and nitrogen oxides in the transport sector, result in in-creased CO2 emissions from the refineries (Chan, 2006; Szklo and Schaeffer, 2007; Johansson et al.,
2012). Thus, it is important to consider strategies to reduce CO2 emissions associated with the petroleum conversion process.
CO2 emissions at refineries can be reduced through a number of routes, but there are three main categories that are considered as key mitigation op-tions (IPCC, 2007):
Energy efficiency;
Low-carbon energy sources (such as natural gas and renewable energy);
Carbon Capture and Storage (CCS).
To understand the dynamics of CO2 emission re-ductions and how oil companies will define their mitigation choices, it is important to study the abate-ment costs of possible mitigation options of CO2 emissions at refineries. The aim of the present study is to elaborate an assessment of CO2 mitigation op-tions and their costs for Replan, using the concept of Marginal Abatement Cost (MAC).
CHARACTERIZATION OF REFINERY CO2
EMISSIONS
Worldwide, the refining sector ranks third among stationary CO2 producers, after the power production sector and the cement industry (Gale, 2005).A refin-ery may use 1.5% up to 8% of its feed as fuel, de-pending on the complexity of the refinery. For a large-scale 300,000 bpd refinery, this will lead to CO2 emissions ranging from 0.8 up to 4.2 MtCO2/year (Gary et al., 2007).
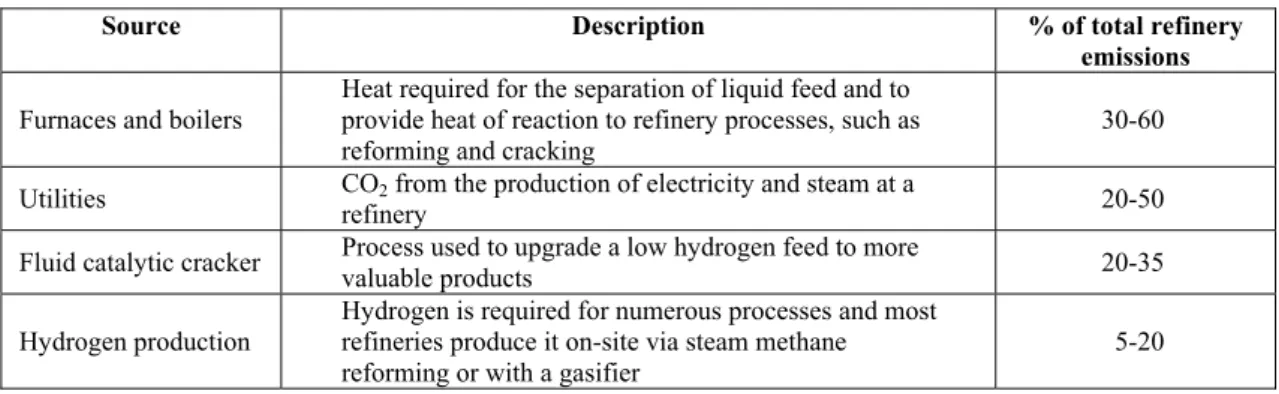
Oil refineries require energy to convert crude oil into marketable products. Along the process CO2 emissions are due both to fuel burning to supply energy for the refining processes and to the produc-tion of the hydrogen required by the conversion pro-cesses. For a typical complex refinery, the key sources of CO2 are presented in Table 1.
Table 1: Major CO2 emission sources for a typical complex refinery (Straelen et al., 2010).
Source Description % of total refinery
emissions
Furnaces and boilers
Heat required for the separation of liquid feed and to provide heat of reaction to refinery processes, such as reforming and cracking
30-60
Utilities CO2 from the production of electricity and steam at a
refinery 20-50
Fluid catalytic cracker Process used to upgrade a low hydrogen feed to more
valuable products 20-35
Hydrogen production
Hydrogen is required for numerous processes and most refineries produce it on-site via steam methane reforming or with a gasifier
Power plants have flue gas emitted from a single stack (or possibly two or three stacks for the very large ones). Conversely, refineries can typically have 20 to 30 different CO2 emission sources (process heaters), ranging widely in size, location, flue gas concentration and types of contaminants. These sources generally emit to the atmosphere through individual stacks, which are scattered throughout the refinery site. Furthermore, with the exception of some hydrogen plants, CO2 is emitted in flue gases and off-gases with fairly low CO2 concentrations, on the order of 3-12 %v/v (CONCAWE, 2011).
These characteristics potentially make end-of-pipe recovery of CO2 logistically and technically dif-ficult, as well as expensive. Considering that the di-mension of a large complex refinery may be over 5 km2, gathering these sources into a centralized cap-ture facility requires considerable investment in large cross-section ducting and induced draft fans, with additional energy requirements, often in situations where space is severely restricted (Straelen et al., 2010).
On the other hand, in the catalyst regeneration of Fluid Catalytic Cracking (FCC), the coke produced during cracking of the oil feed is burned to generate heat of reaction. In this process, the surplus heat can be used to generate steam and electricity. Because nearly pure carbon is being burned the concentration of CO2 in the flue gases is relatively high (about 20 %v/v). In this case, CO2 capture is technically feasi-ble, especially if oxi-firing is considered (CONCAWE, 2011). More details about CO2 capture options will be discussed below.
In addition to combustion, refineries generate CO2 through decarbonisation of hydrocarbon mole-cules to produce the hydrogen needed for hydrotreat-ing light and medium distillates. By far the most widely used process for hydrogen production is me-thane steam reforming. The average emission is about 10 tonnes of CO2 per tonne of hydrogen pro-duced (Hydrocarbon Publishing Company, 2010). Following the steam reforming reactions, CO2 needs to be removed from the CO2/H2 mixture to produce the high purity hydrogen stream normally required for downstream processes. CO2 removal can be ef-fected by chemical absorption in a solvent (usually an amine) or by the more energy efficient physical adsorption route (Pressure Swing Adsorption). In the former case a high purity CO2 stream is produced (up to 99%) that would just need drying and com-pression to be transported to a storage site. In the latter case the waste stream contains a mixture of CO2, H2, CO and hydrocarbon where the CO2 con-centration is in the 50% v/v range so that further
separation would be required to prepare a CO2 stream suitable for transport and storage (CONCAWE, 2011).
CO2 MITIGATION MEASURES FOR THE OIL
REFINING INDUSTRY
The contribution of oil refineries to the reduction of CO2 emissions based on the previously mentioned mitigation strategies is discussed in this section.
Energy Efficiency Opportunities
Recently, several studies have been published on the opportunities for energy efficiency and CO2 miti-gation in the oil refining industry (Petrick and Pelle-grino, 1999; Worrell and Galitsky, 2005; Szklo and Schaeffer, 2007; Hydrocarbon Publishing Company, 2010). The opportunities vary from specific actions in unit operations to site-wide energy measures such as process integration.
Worrell and Galitsky (2005) estimate an energy saving economic potential of 10-20% for most U.S. refineries. For the Brazilian oil refineries, Szklo and Schaeffer (2007) have estimated the potential for energy savings with a focus on two alternatives: the reduction of primary energy use and the implementa-tion of non-hydrogen consuming technologies for sul-phur removal. They estimate a near-to-medium term energy saving potential ranging from 10% to 20%.
Large energy savings can be achieved by means of heat integration and most studies have been con-ducted on parts of the refinery process (Plesu et al., 2003; Valino et al., 2008; Bulasara et al., 2009). Brown (1999) reported that typical energy savings from total site analyses are in the 20-30% range, and the results are limited to 10-15% as long as economic feasibility is considered.
According to Szklo and Schaeffer (2007), waste heat recovery is one of the most important options in the short-to-medium run, while fouling mitigation and new refining processes are promising technolo-gies in the medium-to-long run.
com-plexity (the reference refinery is normalized as 100). An index higher than 100 indicates that the given refinery has a primary energy consumption higher than the reference one (Castelo Branco et al., 2011).
In theory, energy efficiency can provide low-cost or even payout opportunities for GHG emissions reduction. On the other hand, energy efficiency has for a very long time been a priority at the refineries, however constrained by managerial issues. Many measures with great energy saving potentials have already been implemented at the refineries (Holmgren and Sternhufvud, 2008; Nordrum et al., 2011). It should be noted that further improvements in energy efficiency vary significantly across indi-vidual refineries (Johansson et al., 2012). In many cases the feasibility is low due to the high capital costs for waste heat recovery and to the low reduc-tions in emissions (Nordrum et al., 2011).
However, in practice, there are some limitations to the implementation of energy efficiency measures that result in postponing these projects: (1) lifetime of existing equipment; (2) reliability of existing equipment and (3) major changes can only be exe-cuted during maintenance turnarounds.
Switching to Low-Carbon Energy Sources
The potential for fuel shift at refineries is related to substituting liquid fuels that are used in furnaces or boilers for fuels with lower carbon content, such as natural gas.
The bulk of the fuel used in a refinery is a by-product of the refining process (refinery gas) and is composed of light hydrocarbons (mostly methane and ethane). However, these top fractions are not sufficient to cover the whole energy demand and the balance (about 23%, on average, in European Union refineries) has traditionally been met by low-value liquid residues, for example heavy fuel oil. Refiner-ies can use these liquid fuels for other purposes and instead import natural gas (CONCAWE, 2008).
The estimates of CO2 emission reductions due to fuel substitution are based on the assumption that refineries close to natural gas grids could displace all liquid fuels (Johansson et al., 2012). For example, Elkamel et al. (2008) showed that 30% of the CO2 emissions could be reduced by switching all liquid fuels for natural gas.
Carbon Capture and Storage
Energy efficiency is the main opportunity to re-duce CO2 emissions, but even an efficient refinery continues to demand energy to a large extent,
there-fore emitting considerable amounts of CO2. Thus, an option to further reduce these emissions is through CCS (Straelen et al., 2010).In general, the largest potential reductions of CO2 emissions in the refining industry are related to CCS (Johansson et al., 2012).
According to Freund (2005), three routes are re-cognized for the capture of CO2:
Post-combustion capture: is an end-of-pipe so-lution, where CO2 is removed from the flue gas before the flue gas is emitted to the atmosphere via the stack;
Oxyfuel combustion capture: in this case, pure oxygen rather than air is used for combustion. This eliminates nitrogen from flue gases. In refineries, burners may be oxy-fired. Also the operation of FCC on oxygen is under study;
Pre-combustion capture: is a process where the hydrocarbon fuel is pretreated to produce a CO2 and H2 stream from which CO2 can be separated. Gasifiers with pre-combustion capture would be used to supply the refinery’s utilities.
To date, the focus has been on post-combustion and oxyfuel combustion capture. Regarding oxyfuel the motivation is that it generates a cleaner CO2 stream and less heat is required. However, the oxy-fuel process requires oxygen, the producing process of which is very energy demanding (large electricity requirement for oxygen generation is due to the Air Separation Unit (ASU) via cryogenic distillation), besides the fact that the reconstruction of furnaces and/or boilers is also necessary. On the contrary, no reconstruction of existing equipment is necessary for post-combustion CO2 capture (Johansson, 2013).
Whatever the option selected, CO2 capture would result in high cost and significant additional energy consumption and CO2 emissions (CONCAWE, 2011). Indeed, it is important to consider the energy con-sumption by CO2 capture systems, but what is even more important is to know how this energy is provided, and the impacts in terms of costs and CO2 emissions. The capture technology will impose more or less energy consumption as steam or electricity. The Air Separation Unit (ASU) consumes almost exclusively electricity, while chemical absorption consumes mostly steam (Saggese, 2012).
using chemical absorption with monoethanolamine (Statoil, 2009). A pilot test of oxyfuel CO2 capture from FCC has been performed in Brazil and con-firmed no significant changes from normal opera-tions in product profile, stability of operation and the effectiveness of coke burn. The feasibility study in the oxy-firing FCC also indicates significantly lower CO2 capture costs compared to post-combustion capture (Mello et al., 2009).
Kuramochi et al. (2012) compared the techno-economic performance of several CO2 capture tech-niques for selected industries, including the oil re-fining sector. The findings of their study indicate that CO2 capture in oil refineries could be achieved at a cost in the range of 30 to 120 €/t CO2, depending on the targets of CO2 capturing and on the CO2 capture technologies considered. For instance, CO2 mitiga-tion costs for post-combusmitiga-tion capture in the short-to-medium term are found to be above 100 €/t CO2. Oxyfuel capture, in contrast, may provide relatively low CO2 avoidance costs, as around 50-60 €/t CO2. According to CONCAWE (2011), the cost of cap-turing is typically about 80% of the total CCS cost.
The specificity of oil refinery CCS projects will be mostly related to capture (CONCAWE, 2011). While it would be technically feasible to combine a number of sources and route all the flue gases to one CO2 capture plant, this would require several kilo-meters of ducting (i.e., for transport) and additional blower duties (i.e., to overcome pressure drops) (Simmonds et al., 2003).
Thus, such strategy would entail significant costs and require space for the infrastructure. Therefore, most studies focus on capturing CO2 from the largest sources or from the sources with the highest CO2 concentrations (e.g., hydrogen production). Another important aspect is to understand in what extension the refineries with capture can be integrated in a net-work infrastructure for transport and storage of the captured CO2 (Johansson et al. 2012). In this sense, Rootzén et al. (2011) discuss how the geographical distribution of large CO2 emitters and the distance to storage sites could affect the development of CO2 transportation networks.
In summary, the implementation of CO2 capture technologies in refineries presents some issues that must be taken into account: (1) space requirements to install the following systems: flue gas gathering, removal of sulfur and nitrogen oxides (gas scrubber), CO2 drying and compression, off-site, additional util-ity production, besides the amine treatment towers (post-combustion) or the ASU (oxyfuel combustion); (2) additional water availability for the gas scrubber and for the steam generation; (3) additional
waste-water treatment due to gas scrubbing and (4) addi-tional carbon footprint associated with the extra ener-gy consumption (steam and power generation due to firing natural gas in a combined heat and power plant). In the specific case studied in this paper, space and water availability could be constraints and further detailed feasibility analysis of CO2 capture must take these issues into account.
Last but not least, the CO2 capture technology struggles with several issues, especially with respect to public acceptance for onshore CO2 storage and uncertainties about the legal framework for CO2 cap-ture, transportation and storage (Johansson, 2013).
METHODOLOGY Definition of Calculation Parameters
In order to estimate the cost of each emission-re-ducing measure at Replan the following calculation parameters were considered.
Annual Plant Operation Time
A typical value of 8,500 hours per year (Kuramo-chi et al., 2012) was considered.
Lifetime of Investment
The economic lifetime of the investment was as-sumed to be equal to the technical lifetime of the abatement measure. In this study an average lifetime of 25 years was considered.
Discount Rate
The economic assessment could vary signifi-cantly, depending on whether the perspective is the public or private sector (Gouvello et al., 2010). There-fore, the average abatement cost of each mitigation option was determined on the basis of incremental costs compared with a baseline scenario at a discount rate of 10%, which is typically adopted by the pri-vate oil sector both for energy efficiency projects and for CO2 capture projects (Melien, 2005; Kuramochi
et al., 2012).
Pricing Structure
to 2020, which is the timeframe of the State of São Paulo Policy on Climate Change.
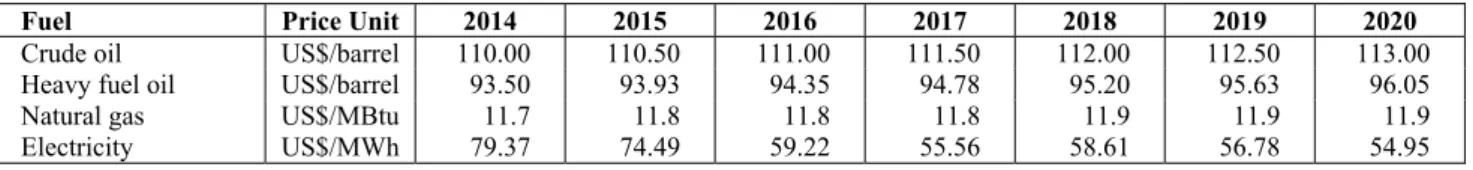
There is no global benchmark pricing for natural gas, as there is for oil (IEA, 2013a). Brazilian gas prices are aligned with the European market (FIESP, 2014). Brazilian fuel oil price is assumed to be 85% of the imported crude oil price. The forecast for tricity prices is based on the current tariffs of elec-tricity (AES Eletropaulo, 2014) and on the evolution of the marginal cost shown in the Brazilian Plan of Energy Expansion (Brasil, 2013).
The energy prices considered in this study are presented in Table 2.
Emission Factors
The considered CO2 emission factors are shown in Table 3.
Cost Estimates
This study used an incremental cost approach, based on Gouvello et al. (2010), to calculate the abatement costs. The cost of each emission-reducing measure (including new technologies, fuel switches and efficiency improvements) was estimated by com-paring the cost difference between two options: the option to implement the abatement technology and the option not to implement it (reference scenario) as described in Equation (1).
abatement reference
reference abatement
C C
AC
E E
− =
− (1)
where,
AC = Abatement cost of CO2 mitigation measure
abatement
C = Net annual cost of the abatement tech-nology
reference
C = Net annual cost of the technology in the reference scenario
abatement
E = Annual CO2 emission with the abatement technology
reference
E = Annual CO2 emission with the technology in the reference scenario
The net annual cost of each option includes costs for the investment, fuel, operation and maintenance, besides the revenue generated by the technology as described in Equation (2).
(
)
(
)
1 r
C INV.r. OMC FC REV
1 r 1
t
t +
= + + −
+ − (2)
where,
C = Net annual cost of the abatement technology or of the technology used in the reference scenario INV = Total investment or capital cost of the abate-ment technology or of the technology used in the reference scenario
OMC = Annual operations and maintenance cost of the abatement technology or of the technology used in the reference scenario
FC = Annual fuel cost of the abatement technology or of the technology used in the reference scenario REV = Annual revenue generated by the abatement technology or by the technology used in the refer-ence scenario
r = Discount rate
t = Lifetime of the technology.
Table 2: Considered energy prices (IEA, 2013a; AES Eletropaulo, 2014; Brasil, 2013).
Fuel Price Unit 2014 2015 2016 2017 2018 2019 2020
Crude oil US$/barrel 110.00 110.50 111.00 111.50 112.00 112.50 113.00 Heavy fuel oil US$/barrel 93.50 93.93 94.35 94.78 95.20 95.63 96.05 Natural gas US$/MBtu 11.7 11.8 11.8 11.8 11.9 11.9 11.9 Electricity US$/MWh 79.37 74.49 59.22 55.56 58.61 56.78 54.95
Table 3: CO2 emission factors (Chan, 2006; Brasil, 2014).
Unit Nominal value
Heavy fuel oil t CO2/GJ 0.079a
Natural gas t CO2/GJ 0.056
b
Electricity grid t CO2/MWh 0.5932c
Notes:
a The value is due to fuel burning in boilers and furnaces and is based on typical values of heavy fuel oil processed at Replan: carbon content = 87%; lower heating value = 40,260 kJ/kg; density = 0.995 t/m³ (Chan, 2006)
b The value is due to fuel burning in boilers and furnaces and is based on typical values of natural gas consumed at Replan: carbon content = 73%; lower heating value = 47,730 kJ/kg (Chan, 2006)
For a given technology over the study period (2014-2020), annual abatement costs are weighted with the corresponding annual CO2 mitigation to calculate the average annual abatement cost.
By definition, the MAC is the cost of reducing a unit of emissions regarding the current situation (Holmgren and Sternhufvud, 2008). A MAC curve can be shown as a graph that indicates the cost of each mitigating technology as a function of the po-tential for emission reduction (in general in million or billion tonnes of CO2). Therefore, a baseline (refer-ence scenario) with no CO2 constraint has to be de-fined in order to assess the marginal cost against this baseline. The MAC curve is constructed by assuming that the measures will be implemented in cost order, ranked from the cheapest to the most expensive. MAC curves are easy to understand: if a particular abatement level is targeted, one knows what measures need to be implemented in order to achieve the goal. In summary, MAC curves typically show the technological potential of abatement measures (Kesicki, 2011).
CASE STUDY: CO2 EMISSIONS MITIGATION
AT REPLAN
With a crude oil throughput of 430,000 bpd, Re-plan (Paulinia Refinery) is the largest Brazilian re-finery. It is located in Paulinia, State of São Paulo, and is focused on fuel production, particularly diesel. Like most large-scale petroleum refineries, Replan is a complex industrial installation including a variety of process units: crude and vacuum distillation (CVD), fluid catalytic cracking (FCC), catalytic re-forming (CR), delayed coking (DC) and distillate hydrotreating (DHT). There are also side processes, like hydrogen generation (HG) and onsite power generation.
In this study, the assumption was considered that Replan’s current figures of crude oil throughput (430,000 bpd) and total CO2 emissions (3.8 Mt CO2, based on the actual set of process units of Replan) remain constant during the period of analysis (2014-2020). The technologies discussed above were evalu-ated for Replan.
Energy Efficiency Opportunities
Many measures aiming at energy savings have al-ready been implemented at Replan (Chan, 2006). In this sense, opportunities for additional improvements in energy efficiency are limited.
Since it is unfeasible to make a complete investi-gation of all remaining energy efficiency opportuni-ties, focus was put on covering the main projects identified in an Energy Optimization Study devel-oped by the company. Conducted in 2013 at Replan, this assessment focused on 30 opportunities for ma-jor process units and identified energy savings of 10% of the total energy used at the refinery, con-sidering only projects with a payback of less than five years (PETROBRAS, 2014b).
Half of these 30 opportunities are more related to optimization measures focusing on higher yield of products. The most promising projects in terms of CO2 mitigation potential are described next.
Improved Heat Integration
The heat exchanger networks of the two CVD units and of the two DC units could be improved by adding a total of eight new heat exchangers. Addi-tionally, it is possible to send a pre-flash tower side-cut to the atmospheric tower and to recover more heat by increasing the circulation of atmospheric tower pump-around stream in the two CVD units.
Operation Improvement
Direct feeding of vacuum gas oil at 100 ºC from CVD units to FCC units (without cooling and stor-age) could enable the use of surplus heat to preheat boiler feed-water (BFW).
Waste Heat Recovery
Each of the two former DHT units has a signifi-cant amount of heat in the reactor effluent that is rejected to cooling water. Thus, there is some availa-ble heat in this stream that could be recovered by adding two new exchangers (in each DHT unit) to preheat the BFW makeup.
Hydrogen Management
A discharge of the pressure control valve of the hydrogen system (vent gas) could be routed to the fuel gas system rather than flare.
Energy Optimization for Utility Systems
Considering the CO2 mitigation potential, two op-portunities stand out:
more efficient steam production and less fuel gas consumption;
The use of medium pressure steam to preheat BFW is an advantageous option since there is an excess of this flow in the refinery.
Onsite Power Generation
In FCC units, it is common practice to utilize ex-pansion turbines or turbo expanders to generate elec-tric power by recovering energy released in the cata-lyst regeneration process (MacLean et al., 1985). At Replan one of the two FCC units has no turbo ex-pander. So, a new turbo expander could be installed to generate 8.4 MW. However, the implementation of this measure would only be feasible by 2020 after retrofitting the FCC unit.
Cost Estimation
In the case of energy efficiency opportunities, a typical value of 2.5% of the capital cost was con-sidered as the annual cost of operation and mainte-nance (O&M), except energy. The capital cost is relative to the installed equipments for each CO2 abatement measure (acquisition, taxes and installa-tion). The annual revenue is relative to the fuel sav-ings, considering natural gas prices. In the case of Replan, two factors must be taken into account. The first one is that, even considering all the internally generated fuels (refinery gas, FCC coke and other waste gases), there is a permanent energy deficit and, therefore, another fuel is necessary to complement the refinery fuel demand. The second factor is the selection of the complementary fuel between fuel oil and natural gas. But, at Replan, fuel oil burning in furnaces and boilers is restricted due to environmen-tal requirements. In other words, natural gas is the choice for use as complementary fuel (around 15-20% of internal supply). Thus, at Replan, any fuel saving results directly in a natural gas saving (i.e. natural gas is the marginal fuel). Table 4 summarizes the energy saving, the capital cost and the annual reve-nue for each alternative previously described (for each measure described in Table 4, the preliminary cost is based on estimated cost of major equipments (pumps, compressors, heat exchangers, vessels, etc.) considering the historical database of Petrobras. Each equipment cost should be multiplied by the Installation Factor and also the Import Factor. The Installation Factor includes shipping, foundations, piping, instrumentation, etc. Retrofittings have in-stallation costs greater than new equipments. The Import Factor is applied to the imported equipments
and it includes import and transport costs).
Substitution of Fuel Oil by Natural Gas
At Replan the use of liquid fuels has decreased over the years due to environmental requirements. Currently, only one steam boiler is fired with 50% heavy fuel oil due to operational safety in the case of irregular fuel gas (a mixture of refinery gas and natu-ral gas) supply to the boilers. This fuel oil consump-tion corresponds to 1.5% of the refinery total energy supply and the related emission is about 65,100 t CO2/year. Natural gas could replace the current use of heavy fuel oil, yielding a reduction of 19,000 tCO2/year.
Carbon Capture and Storage
Given the dominant role that fossil fuels continue to play in the energy consumption worldwide, the urgency of CCS deployment is increasing. According to IEA (2013b), it would be necessary to create a solid foundation for deployment of CCS starting by 2020.
Considering the hypothesis that Replan would have to meet targets to reduce CO2 emissions in the short-term (for instance, due to the State of São Paulo Policy on Climate Change), prompt actions should be taken in order to implement pioneer CCS projects up to 2020.
Most studies focus on capturing CO2 in a refinery from the largest sources, or from the sources with the highest CO2 concentrations. In this way, CO2 capture at Replan would be feasible for regenerators of FCC units (using oxyfuel combustion) and hydrogen pro-duction units (using post-combustion), respectively. Currently, FCC units account for emissions of 1 Mt CO2/year at Replan, while hydrogen production is responsible for emissions of 0.8 Mt CO2/year.
Cost Estimation
The cost estimation of CO2 capture technologies for Replan is based on economic and on the performance parameters in the short-term (10 years) presented by Kuramochi et al. (2012), as shown in Table 5.
Table 4: Capital cost and annual revenue for energy efficiency opportunities (Petrobras, 2014b).
Measure Energy saving
(GJ/h)
Capital cost (MUS$)
Annual revenue (MUS$/year)
M1. Improved heat integration 157.31 11.09 15.08
M2. Operation improvement 20.97 0.88 2.01
M3. Waste heat recovery 35.08 1.36 3.36
M4. Hydrogen management 16.75 0.50 1.61
M5. Energy optimization for utility systems 126.57 0 12.13 M6. Onsite power generation 30.27 30.70 3.92
Table 5: Short-term performance data for oil refineries with CO2 capture (Kuramochi et al., 2012).
Technique Process CO2 capture
Rate (t/t reference emissions)
Specific energy consumption (GJ/t CO2 captured)
Incremental capital cost (US$/t CO2
captured/year)
O&M cost Natural gas Steam Power
Oxyfuel FCC 0.94 - -3.3 2.5 274 4%
Post-combustion Hydrogen Production
0.85 5.7 - -0.1 352 8%
According to Table 5, it would be feasible to capture 0.94 Mt CO2/year at the FCC units and 0.68 Mt CO2/year at the hydrogen production. The capital cost (turn-key cost; 2012 basis) was estimated as 258 MUS$ for oxyfuel combustion capture and 239 MUS$ for post-combustion capture.
Nowadays, in the Replan surroundings there is no infrastructure either for CO2 transportation or CO2 storage. Thus, the costs of transport and storage would have to be added to the cost of CO2 capture. In order to estimate the abatement cost of the CCS technologies at Replan, it was considered that the cost of capturing is 80% of the total CCS cost (CONCAWE, 2011).
RESULTS
At this point, it is important to remember that the results should be considered as potential rather than effective CO2 emission reductions at Replan.
The implementation of the turbo expander and of
the CCS technologies would only be feasible in 2020 and onwards. For this reason two sets of results are presented. The first set includes short-term measures (period 2014-2019) while the second one includes both short-term and mid-term measures available from 2020 onwards.
Table 6 and Figure 1 present the results of the CO2 abatement actions in the period 2014-2019. In the pe-riod it would be possible to mitigate the emissions of 189 thousand t CO2 per year, i.e., 5% regarding the emissions of the reference case (2013). The accumu-lated reductions in emissions would be 1,134 thou-sand t CO2 in six years, at a cost that would vary from -144.72 to -114.04 US$/t CO2 (average values in the period, discounted to 2014 at 10% per year). The negative values indicate that mitigating measures are already cost-effective, just considering the benefits of energy savings and for the hypothesis taken into account. As there is no technological constraint, and all measures are already cost-effective, they could be implemented immediately.
Table 6: Abatement costs for CO2 emissions at Replan (period 2014-2019).
Measure Annual reduction
potential (1000 tCO2/year)
Total reduction potential (1000 tCO2)
Average cost 10% discount rate
(US$/t CO2) M1. Improved heat integration 75 450 -130.22
M2. Operation improvement 10 60 -136.09
M3. Waste heat recovery 17 102 -136.75
M4. Hydrogen management 8 48 -138.58
M5. Energy optimization for utility systems 60 360 -144.72 M7. Substitution of fuel oil by natural gas 19 114 -114.04
ab p g re In er A 1 o g te av to n in p co C th
Table 7 an batement act lementing al ate emission egarding the ncreased ene ring the emi Applying a fu
9 thousand t f 1.62 Mt CO arding the re echnology an
verage, abou o CCS techn ological dev n the decisio ossible to po ould be redu
According CO2 abatemen
he abatemen
M1. Improved M2. Operation M3. Waste hea M4. Hydrogen M5. Energy op M6. Onsite pow M7. Substitutio M8. CCS with M9. CCS with
Total
Figur
nd Figure 2 p tions, with n ll measures i ns by 1.85 M
emissions o ergy efficienc issions by 2 uel shift give
tCO2 per yea O2 per year ( eference cas nd would h ut 106.78 US$ nologies and
velopment su on process. F ostpone the uced due to th g to Johansso
nt costs vary nt options co
Tabl M heat integratio n improvement at recovery n management ptimization for wer generation on of fuel oil by h oxyfuel combu h post-combusti
re 1: MAC c
present the re nominal cost it would be p Mt CO2 per y of the referen cy could con 12 thousand es an abatem
ar. However (42.6% of th e) would be have a signi $/t CO2). The
the early-sta uggested a c For instance, investments he learning e on et al. (201 y significantl onsidered, on
le 7: Abatem
Measure
n
utility systems y natural gas ustion capture (
on capture (hyd
curve for CO
esults of all C ts in 2020. I possible to m year, i.e., 48. nce case (201
ntribute to lo tCO2 per ye ment potential
, the mitigat he emissions
based on C ficant cost e high costs d age of the te careful posit , if it would s in CCS, co effects.
2), estimates y depending n local parti
ment costs fo
(FCC units) drogen producti O2 emissions CO2 Im- miti-7% 13). ow-ear. l of tion re-CCS (on due ech-tion d be osts s of g on icu-lar cou al. Br Th var ma 21 the po me po for pri op co era tor in 13
or CO2 emis
Ann
(100
ion)
at Replan (p
rities, and on unt rates and (2011) hav razilian oil re he results sh rying in the al energy ma
0.8 US$/tCO e study of S orted negativ
easures in Sw otential of car
r natural ga ices determi ption (Castelo As previous mpared the al CO2 captu r. For instanc the short-to-7 US$/t CO
ssions at Rep
nual reduction potential 00 t CO2/year)
75 10 17 8 60 42 19 940 680 1851 eriod 2014-2
n the assump d fossil fuel ve evaluated efineries, ass how relative range of 20. anagement a O2 for foulin Stenhufvud a ve costs for
wedish refin rbon abatem s or LPG i ine the feas o Branco et a
sly mentioned techno-econ ure technique ce, costs for p -medium term O2. Oxyfuel
plan (year 20
Annual red potent (% of total e
2.0 0.3 0.4 0.2 1.6 1.1 0.5 24.7 17.9 48.7 2019). mptions made prices. Cast d the abatem suming two d ely high aba
.2-77.3 US$/ and in the ra ng mitigation
and Holmgr r a number neries. In the ment due to r is huge. The
sibility of t
al., 2011). ed, Kuramoch nomic perform
es for the oi post-combus m were foun capture, in 020). duction tial emissions Nom ( 0 4 2 6 5 7 9 7
e, such as di telo Branco ment costs discount rate atement cost /tCO2 for the ange of 115.
n. In contra ren (2008) r of abateme e last case, th
eplace fuel o e relative fu the mitigatio
hi et al. (201 mance of se il refining se stion capture nd to be abov
contrast, ma
inal cost in 202 (US$/t CO2)
pr C fo C p ca n p co rovide relati CO2. These v or the captu CO2 and 51 U
ort and stora apture costs atural gas ( rice of electr
S
A tradition onsidering v
Para
Energy saving Price of natura Price of fuel oi Price of electri Total investme
Discount rate Lifetime O&M cost
F
ively low c values are h uring proces US$/t CO2, r age. But it is
are strongly (in the post-ricity (in the
SENSITIVIT
nal sensitivi variations o
T ameter al gas il icity ent (INV)
Figure 2: MA costs, around higher than t
sses at Repl respectively) s important t
affected by -combustion
oxyfuel case
TY ANALYS
ity analysis of ±20% in
Table 8: Par
Un GJ/h US$/ US$/ US$/ MUS % year %IN
AC curve for
d 68-82 US those estima lan (130 US
, without tra to note that the price of case) and e). SIS was perform the follow rameters con nit h /MBtu / barrel /MWh S$ NV
r CO2 emissi
S$/t ated S$/t ans-the the the med wing par inv life ab Th Ta en rep Im eff po the nsidered for Nomina 157.31 (h 30.27 (po 11.90 96.05 54.95 11.09 (he 30.70 (po 257.56 (C 239.50 (C 10 25 2.5 (heat 2.5 (powe 4 (CCS/o 8 (CCS/p
ons at Repla
rameters: en vestment of fetime and O&
For compar atement cost he value rang able 8. The an ergy efficien
In the cate presentative mproved heat fect of the p ower generati
e price of ele
r the sensitiv
al value (base c
heat integration) ower generation eat integration) ower generation CCS/oxyfuel co CCS/post-combu integration) er generation) xyfuel combust ost-combustion
n (year 2020
nergy saving f each tec &M cost. rison the bas
t is the nomin ges of the pa nalysis is div ncy, fuel subs gory energy projects t integration
price of nat ion (in order ectricity). vity analysis case) ) n) n) mbustion) ustion) tion) n) 0).
g, all energy chnology, d
se case consi inal cost in 2 arameters ar vided into thr
stitution and y efficiency were con n (in order to
tural gas) an er to evaluate
s. Range sensitivit (±20% nom 125.85 24.22 – 9.52 – 76.84 – 43.96 – 8.87 – 24.56 – 206.05 191.60 8 – 12 20 – 30 2 – 3 2 – 3 3.2 – 4 6.4 – 9
y prices, tot discount rat
dered for eac 2020 (Table 7 re presented
ree categorie CCS. the two mo nsidered: (
o evaluate th nd (2) Onsi e the effect
used for ty analysis minal value)
5 – 188.77 – 36.32 14.28 – 115.26 – 65.94 13.31 – 36.84 5 – 309.07 0 – 287.40
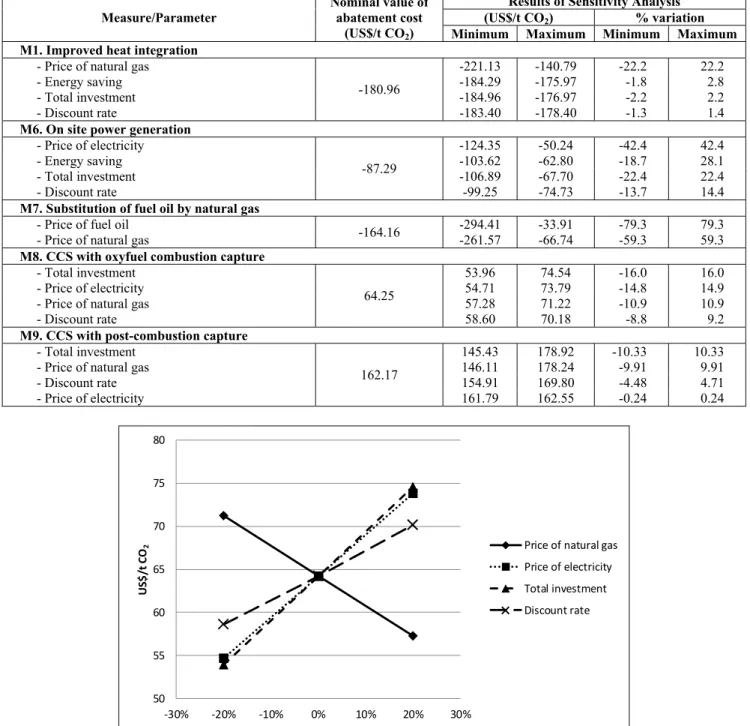
Table 9 displays the main results of the sensitivity analysis. As an illustration, Figure 3 presents the impacts of the main parameters on the CO2 abate-ment cost of the project related to CCS with oxyfuel combustion.
The lifetime and O&M cost have a small influence on the CO2 abatement cost for the three considered categories (maximum variations in the range of ±4%).
For the heat integration measure, the parameter that most impacts the abatement cost is the price of natural gas (range of ±22%). In the case of power
generation, the price of electricity causes the greatest impact on the abatement cost (range of ±42%)
In the category of fuel substitution, the parameter that most impacts the abatement cost is the price of fuel oil (range of ±79%), which is directly propor-tional to the price of crude oil. The price of natural gas also has a significant impact on the abatement cost (range of ±59%). However, as the CO2 reduction potential of fuel substitution is small, the direct im-pact of crude oil prices on the CO2 abatement costs is not significant.
Table 9: Summary of sensitivity analysis.
Measure/Parameter
Nominal value of abatement cost
(US$/t CO2)
Results of Sensitivity Analysis
(US$/t CO2) % variation
Minimum Maximum Minimum Maximum M1. Improved heat integration
- Price of natural gas
-180.96
-221.13 -140.79 -22.2 22.2 - Energy saving -184.29 -175.97 -1.8 2.8
- Total investment -184.96 -176.97 -2.2 2.2
- Discount rate -183.40 -178.40 -1.3 1.4
M6. On site power generation
- Price of electricity
-87.29
-124.35 -50.24 -42.4 42.4 - Energy saving -103.62 -62.80 -18.7 28.1 - Total investment -106.89 -67.70 -22.4 22.4 - Discount rate -99.25 -74.73 -13.7 14.4
M7. Substitution of fuel oil by natural gas
- Price of fuel oil
-164.16 -294.41 -33.91 -79.3 79.3 - Price of natural gas -261.57 -66.74 -59.3 59.3
M8. CCS with oxyfuel combustion capture
- Total investment
64.25
53.96 74.54 -16.0 16.0 - Price of electricity 54.71 73.79 -14.8 14.9 - Price of natural gas 57.28 71.22 -10.9 10.9
- Discount rate 58.60 70.18 -8.8 9.2
M9. CCS with post-combustion capture
- Total investment
162.17
145.43 178.92 -10.33 10.33 - Price of natural gas 146.11 178.24 -9.91 9.91 - Discount rate 154.91 169.80 -4.48 4.71 - Price of electricity 161.79 162.55 -0.24 0.24
Figure 3: Sensitivity analysis for CO2 abatement cost (CCS with oxyfuel combustion).
50 55 60 65 70 75 80
-30% -20% -10% 0% 10% 20% 30%
U
S
$
/t
C
O2 Price of natural gas
In the case of CCS with oxyfuel combustion, the parameters that most impact the abatement cost are total investment and price of electricity (range of ±15%). For CCS with post-combustion, the parame-ters that most impact the abatement cost are total investment and price of natural gas (range of ±10%).
In summary, the parameters that most affect the abatement cost are the prices of energy, especially the price of natural gas. The price of fuel oil only has a direct influence in the case of fuel substitution, while the price of electricity influences the cases of power generation and CCS with oxyfuel combustion. Total investment and discount rate have a significant influence on the abatement cost (± 10% on average) only in cases of higher total investments, like the projects of power generation and CCS.
CONCLUSIONS
The results of the assessment show that continued energy efficiency improvements and fuel switching represent the most promising strategies for CO2 emis-sion reduction at Replan in the short-term. Most of the estimated abatement costs are negative, meaning that the measures are already cost-effective and could be implemented immediately.
Despite these options, the overall abatement po-tential is relatively low (6.1% of the total emissions). Although a number of energy efficiency projects were identified, the cumulative total emission reduc-tion available through energy efficiency projects is relatively limited, since ongoing energy efficiency programs have identified and implemented nearly all opportunities.
In a long-term perspective, an additional reduc-tion in on-site CO2 emissions up to 42.6% could be achieved by implementing CCS technologies at Re-plan. The potential for CO2 capture varies depending on the choice of capture technology (oxyfuel com-bustion or post-comcom-bustion) and targeted CO2 emis-sion source (for example, targeting only flue gases from regenerators of FCC units or targeting also flue gases from hydrogen production). Assuming that carbon capture will be implemented only in the largest sources (regenerators of FCC units), the potential for CO2 emission reduction decreases to 24.7%.
Estimated abatement costs are very high for CCS technologies and, according to the results of sensitiv-ity analysis, they are mostly impacted by total invest-ment and energy prices (natural gas and electricity).
The high costs due to CCS technologies and the early-stage of the technological development suggest a careful position in the decision process, which involves the following aspects:
The definition of an optimum capture capacity at the refinery, considering gain of scale (which re-duces cost) and additional piping and blower duties (which increase cost);
The possibility to postpone the investments in CCS, resulting in reduced costs in the future due to the learning effects.
In a carbon-constrained scenario, considering the high carbon abatement costs associated with CCS projects (on average, about 107 US$/t CO2), private investors would certainly prefer to buy emission allowances of around 20 US$/t CO2, which is the 2020 price in the main carbon markets studied in the New Policies Scenario of World Energy Outlook 2013 (IEA, 2013a).
To overcome this huge difference in cost, public policies and regulatory frameworks should be de-ployed for promoting carbon mitigation measures in the Brazilian oil industry.
Since cost-effective and feasible options are lim-ited for refineries, the availability of sufficient allow-ances and offsets is an important element if regula-tory goals are to be achieved. In this way, carbon allowances could provide some synergy for the oil industry.
In the case of a Brazilian carbon-constrained sce-nario, an option is to consider a two-step CO2 mitiga-tion strategy to meet regulatory goals. CCS imple-mentation could be postponed by a period after 2020 until the technology becomes economically viable. During this period emission allowances could be used by the refining industry.
ACKNOWLEDGEMENTS
The authors wish to thank the support and con-tributions of the staff of Petróleo Brasileiro S.A.
(PETROBRAS) and the Universidade Estadual de Campinas (UNICAMP). This research was performed as part of a Ph.D. Thesis developed at the UNI-CAMP’s Mechanical Engineering Faculty (Energy Planning Systems).
NOMENCLATURE
AC Abatement cost of CO2 mitigation measures
ASU Air Separation Unit BFW Boiler feed-water bpd Barrels per day
abatement
C Net annual cost of the abatement technology
reference
C Net annual cost of the technology in the reference scenario
CCS Carbon Capture and Storage CO2e Carbon dioxide equivalent CR Catalytic Reforming
CVD Crude and Vacuum Distillation DC Delayed Coking
DHT Distillate Hydrotreating
abatement
E Annual CO2 emission with the abatement technology
reference
E Annual CO2 emission with the technology in the reference scenario
EII Energy Intensity Index
FC Annual fuel cost of the abatement technology or of the technology used in the reference scenario
FCC Fluid Catalytic Cracking GHG Greenhouse Gases HG Hydrogen Generating INV Total investment of the abatement
technology or of the technology used in the reference scenario
MAC Marginal Abatement Cost MBtu Million British thermal units Mt Million tonnes MUS$ Million dollars
O&M Operation and Maintenance
OMC Annual operations and maintenance cost of the abatement technology or of the technology used in the reference scenario
r Discount rate
REV Annual revenue generated by the abatement technology or by the
technology used in the reference scenario t Lifetime of the technology
REFERENCES
AES Eletropaulo, Tarifa de energia elétrica. AES Ele-tropaulo, São Paulo (2014). Available at: <https:// www.aeseletropaulo.com.br/poder-publico/ prazos-e-tarifas/conteudo/tarifa-de-energia-eletrica>. (Ac-cessed: August 12, 2014). (In Portuguese).
Brasil, Ministério de Minas e Energia, Empresa de Pesquisa Energética, Plano Decenal de Expansão de Energia 2022. MME/EPE, Brasília (2013). (In Portuguese).
Brasil, Ministério da Ciência, Tecnologia e Inovação, Fatores de Emissão de CO2 pela geração de ener-gia elétrica no Sistema Interligado Nacional do Brasil. MCTI, Brasília (2014). Available at:
<http://www.mct.gov.br/index.php/content/view/7 2764.html>. (Accessed: August 11, 2014). (In Portuguese).
Brown S. M., The drive for refinery energy effi-ciency. Petroleum Technology Quarterly Refining, Autumn, 45-55 (1999).
Bulasara, V. K., Uppaluri, R. and Ghoshal, A. K., Re-vamp study of crude distillation unit heat ex-changer network: Energy integration potential of delayed coking unit free hot streams. Applied Thermal Engineering, 29, 2271-2279 (2009). Castelo Branco, D. A., Szklo, A., Gomes, G., Borba,
B. S. M. C. and Schaeffer, R., Abatement costs of CO2 emission in the Brazilian oil refining sector. Applied Energy, 88, (11), 3782-3790 (2011). Chan, W. N., Quantificação e redução de emissões de
gases de efeito estufa em uma refinaria de petró-leo. Master Thesis, Universidade Estadual de Cam-pinas (2006). (In Portuguese).
CONCAWE, Impact of product quality and demand evolution on EU refineries at the 2020 horizon. CO2 emission trend and mitigation options. Re-port No. 8/08. CONCAWE, Brussels, (2008). Available at: <http://www.concawe.be/content/ default.asp? PageID=577>. (Accessed: August 11, 2014).
CONCAWE, The potential for application of CO2 capture and storage in EU oil refineries. Report No. 7/11. CONCAWE, Brussels, (2011). <https:// www.concawe.eu/content/default.asp?PageID=56 9>. (Accessed: June 11, 2014).
Corrêa, E. C., Energy Performance Management in PETROBRAS Refineries. In: V Latin American Carbon Forum, Santo Domingo, Dominican Re-public (2010).
Elkamel, A., Ba-Shammakh, M., Douglas, P. and Croiset, E., An Optimization approach for inte-grating planning and CO2 emission reduction in the petroleum refining industry. Ind. Eng. Chem. Res., 47(3), 760-776 (2008).
FIESP, Federação das Indústrias do Estado de São Paulo, Especialistas defendem gás natural a preço justo durante 14º Encontro Internacional de Energia da Fiesp. FIESP, São Paulo (2014). Available at: <http://www.fiesp.com.br/noticias/especialistas- defendem-gas-natural-a-preco-justo-durante-14o-encontro-internacional-de-energia-da-fiesp/>. (Ac-cessed: June 4, 2014). (In Portuguese).
Freund, P., Chapter 1, Introduction, Carbon Dioxide Capture and Storage. Intergovernmental Panel on Climate Change. Cambridge University Press, New York, (2005).
Climate Change. Cambridge University Press, New York, (2005).
Gary, J. H., Handwerk, G. E., Kaiser, M. J., Petro-leum Refining: Technology and Economics. Fifth Edition, CRC Press, Boca Raton (2007).
Global CCS Institute, Projects. Global CCS Insti-tute, Docklands (2014). Available at: <http://www. globalccsinstitute.com/projects/browse>. (Accessed: August 22, 2014).
Gouvello, C., Soares Filho, B. S., Schaeffer, R., Alves, F. J., Alves, J. W. S., Brazil Low-Carbon: Country Case Study. The World Bank, Washing-ton DC (2010).
Holmgren, K. and Sternhufvud, C., CO2-emission reduction costs for petroleum refineries in Swe-den. Journal of Cleaner Product, 16(3), 385-394 (2008).
Hydrocarbon Publishing Company, Refinery CO2 Management Strategies. Hydrocarbon Publishing Company, Southeastern (2010).
IEA, International Energy Agency, World Energy Outlook 2013. OECD/IEA, Paris, (2013a).
IEA, International Energy Agency, Technology Roadmap: Carbon capture and storage 2013. OECD/IEA, Paris (2013b). Available at: <http:// www.iea.org/publications/freepublications/public ation/technology-roadmap-carbon-capture-and-storage-2013.html>. (Accessed: August 3, 2014.) Interministerial Committee on Climate Change, Na-tional plan on climate change. Government of Brazil, Brasília (2008). Available at: <http:// www.mma.gov.br/estruturas/208/_arquivos/nation al_plan_208.pdf>. (Accessed: June 29, 2014). IPCC, Intergovernmental Panel on Climate Change,
Climate Change 2007: Synthesis Report. IPCC, Geneva (2007).
Johansson, D., Rootzén, J., Berntsson, T. and Johnsson, F., Assessment of strategies for CO2 abatement in the European petroleum refining industry. Energy, 42, 375-386 (2012).
Johansson, D., System studies of different CO2 miti-gation options in the oil refining industry: Post-combustion CO2 capture and biomass gasifica-tion. Ph.D. Thesis, Chalmers University of Tech-nology (2013).
Joly, M., Refinery production planning and schedul-ing: The refining core business. Brazilian Journal of Chemical Engineering, 29(2), 371-384 (2012). Kesicki, F., Marginal abatement cost curves for
pol-icy making – expert-based vs. model-derived curves. UCL Energy Institute, London (2011). Available at: <http://www.homepages.ucl.ac.uk/ ~ucft347/Kesicki_MACC.pdf>. (Accessed: July 08, 2014).
Kuramochi, T., Ramírez, A., Turkenburg, W. and Faaij, A., Comparative assessment of CO2 capture technologies for carbon-intensive industrial pro-cesses. Progress in Energy and Combustion Sci-ence, 38(1), 87-112 (2012).
MacLean, J. P., Bittensky, J. S., Colvert, J. H., Pro-cess for improving power recovery from re-generation gas under turndown conditions. United States Patent No. 4, 539, 303 (1985).
Melien, T., Economic and Cost Analysis for CO2 Capture Costs in the CO2 Capture Project Scenar-ios. Carbon Dioxide Capture for Storage in Deep Geologic Formations. Chapter 3, Elsevier Sci-ence, Amsterdam (2005).
Mello, L. F., Pimenta, R. D. M., Moure, G. T., Pra-via, O. R. C., Gearhart, L., Milios, P. B., Melien, T., A technical and economical evaluation of CO2 capture from FCC units. Energy Procedia, 1, 117-124 (2009).
Nordrum, S., Lieberman, D., Colombo, M., Gorski A. and Webb, C., Assessment of greenhouse gas mitigation options and costs for California petro-leum industry facilities: The shape of things to come. Energy Procedia, 4, 5729-5737 (2011). Petrick, M. and Pellegrino, J., The potential for
re-ducing energy consumption in the refining indus-try. Report No. ANL/ESD/TM-158. Argonne Na-tional Laboratory, Lemont (1999).
PETROBRAS, Petróleo Brasileiro S.A., Sustainability report 2013. PETROBRAS, Rio de Janeiro (2014a). Available at: <http://www.petrobras.com.br/en/ society-and-environment/sustainability-report/>. (Accessed: June 27, 2014).
PETROBRAS, Petróleo Brasileiro S.A., Replan Re-finery Energy Study. Technical Report, PETRO-BRAS, Paulínia (2014b).
Plesu, V., Bumbac, G., Iancu, P., Ivanescu, I. and Popescu, D. C., Thermal coupling between crude distillation and delayed coking units. Applied Thermal Engineering, 23, 1857-1869 (2003). Proops, K. R., EII Analysis Methodology: Gap
Analy-sis vs World’s Best EII. HSB Solomon Associ-ates LLC, Dallas (2010). Available at: <http:// solomononline.com/documents/Whitepapers/EII_ AM_WWW.pdf>. (Accessed: September 12, 2013). Reddy, S., Vyas, S., Recovery of carbon dioxide and
hydrogen from PSA tail gas. Energy Procedia, 1(1), 149-154 (2009).
Rootzén, J., Kjärstad, J. and Johnsson, F., Prospects for CO2 capture in European industry. Management of Environmental Quality, 22(1), 18-32 (2011). Saggese, D., Integrated Assessment of CO2
São Paulo, Política Estadual de Mudanças Climáti-cas. LEI Nº 13.798, de 9 de novembro de 2009. Diário Oficial do Estado de São Paulo, 119(209), 1-20 (2009). (In Portuguese).
Simmonds, M., Hurst, P., Wilkinson, M. B., Watt, C. and Roberts, C. A., A study of very large scale post combustion CO2 capture at a refining & petro-chemical complex. Greenhouse Gas Control Tech-nologies, 1, 39-45 (2003).
Statoil, CO2 Masterplan Mongstad (English Sum-mary). Statoil, Stavanger (2009). Available at: <http://www.statoil.com/no/newsandmedia/news/ 2009/downloads/masterplan%20mongstad%20en glish%20summary.pdf>. (Accessed: August 22, 2014).
Straelen, J., Geuzebroek, F., Goodchild, N., Protopa-pas, G., Mahony, L., CO2 capture for refineries, a practical approach. International Journal of Green-house Gas Control, 4, 316-320 (2010).
Szklo, A. S., Schaeffer, R., Fuel specification, energy consumption and CO2 emission in oil refineries. Energy, 32(7), 1075-1092 (2007).
Valino, C. M., Irizar, I. C., Bascones, A. A., Heins, A., Toccaceli, S., Improving crude unit heat inte-gration. Petroleum Technology Quarterly, 13(2), 107-111 (2008).