Distribution of aggregate income in Portugal from 1995 to 2000 within a
SAM (Social Accounting Matrix) framework. Modelling the household
sector.
Susana Maria G. Santos
Instituto Superior de Economia e Gestão Departamento de Economia
Unidade de Estudos sobre a Complexidade em Economia Universidade Técnica de Lisboa
Rua Miguel Lupi, 20, 1200-781 Lisboa, Portugal, Tel. 351 21 392 59 53
Fax: 351 21 392 28 08 E-mail: [email protected].
Abstract
Aggregated Social Accounting Matrices (SAMs) will be constructed for the Portuguese economy from 1995 to 2000, based on the country’s national accounts statistics. The economic flows associated with households, enterprises, government and other institutions will be analysed, as well as their evolution, whilst accounting multipliers will be calculated to facilitate the study of the effects resulting from changes in household income. Therefore, SAMs are modelled and structural path analysis will be used for the decomposition of the calculated multipliers. At the end, the general guidelines will be established for following the study of income distribution and poverty in Portugal.
Key Words: Social Accounting Matrix; Income distribution. JEL Classification: D57; H31; O52
CONTENTS
1. Introduction ... 1
2. The Portuguese SAM Structure and the importance of the household sector... 1
3. The SAM Modelling 3.1. Methodology ... 8
3.2. Evaluation with changes in household income… ... 13
4. Concluding remarks ...19
References ... 21
Appendixes – SAMs (1995-2000) ... 23
– Description of the SAM cell contents ... 29
– Figure 1A: Accounting multipliers and additional extragroup and intergroup components from 1995 to 2000 ... 33
1. INTRODUCTION
The Social Accounting Matrix, usually known as SAM, is the working instrument used in this paper1 to study the effects on the economy of changes in the income of Portuguese households from 1995 to 2000.
Compiled from the Portuguese System of National Accounts (SNA), the SAMs constructed for the Portuguese economy from 1995 to 2000 can be seen as its matrix representation, showing the entire circular flow of income.
As will be seen in section 2, the SAM is a square matrix in which the entries made in rows specify incomes or receipts, whilst the entries made in columns specify outlays or expenditures. Its design was established with the intention of emphasising the household institutional sector and, in its treatment, attention was centred on analysing the households’ expenditures and receipts.
Section 3 shows that the SAM can be understood as a general equilibrium data system, the modelling of which will help to quantify and analyse the effects of exogenous shocks or changes introduced into the households’ receipts. At the same time, the whole network through which some influences or effects of exogenous shocks are transmitted will be identified and partly specified through the use of structural path analysis. This analytical technique was introduced into a SAM framework by Defourny and Thorbecke (1984), being used to analyse intersectoral linkages between the individual accounts of the SAM by means of the paths along which effects travel. The technique is seen as an alternative to the so-called traditional decomposition of multipliers, defined by Stone (1985) and Pyatt and Round (1985), which is also used here.
Section 4 ends the article with some concluding remarks.
2. THE PORTUGUESE SAM STRUCTURE AND THE IMPORTANCE OF THE HOUSEHOLD SECTOR
Based on the works of Graham Pyatt and his associates (Pyatt, 1988, 1991a; Pyatt and Roe, 1977; Pyatt and Round, 1985) and on the author’s own previous experience (Santos, 1999,
1 Based on the author’s papers presented to the Economic Policies in the New Millennium Conference, the
Department of Economics Seminar and the Input-Output and General Equilibrium: Data, Modelling and Policy analysis Conference, which were held respectively at the University of Coimbra on 16 April 2004, at the Higher
Institute of Economics and Business Administration (Lisbon) on 6 July 2004 and at the Free University of Brussels on 2-4 September 2004.
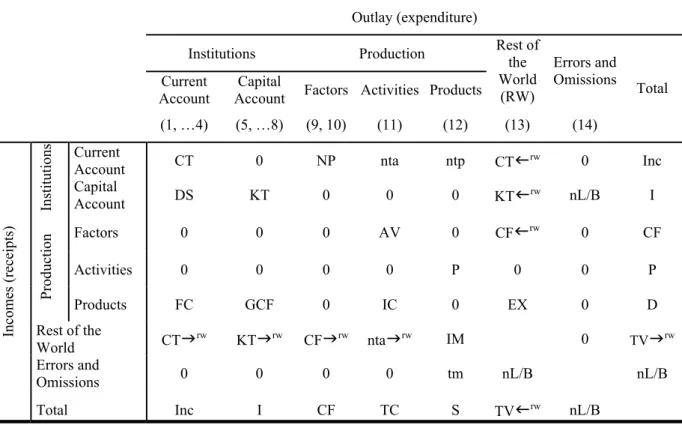
2001, 2003a, 2003b), the constructed SAMs (see the Appendixes), compiled from the Portuguese System of National Accounts, have the basic structure that is shown in Table 1. Table 1. Basic Portuguese SAM
Outlay (expenditure) Institutions Production
Current Account
Capital
Account Factors Activities Products Rest of the World (RW) Errors and Omissions (1, …4) (5, …8) (9, 10) (11) (12) (13) (14) Total Current
Account CT 0 NP nta ntp CTIrw 0 Inc
In stitu tio ns Capital Account DS KT 0 0 0 KTIrw nL/B I Factors 0 0 0 AV 0 CFIrw 0 CF Activities 0 0 0 0 P 0 0 P Product io n Products FC GCF 0 IC 0 EX 0 D Rest of the World CTJrw KTJrw CFJrw ntaJrw IM 0 TVJrw Errors and Omissions 0 0 0 0 tm nL/B nL/B Incom es (receipts) Total Inc I CF TC S TVIrw nL/B
Note: account numbers are shown in brackets Key:
AV = (gross) added value2 KT = capital transfers
CF = compensation of factors nL/B = net lending/borrowing3 CT = current transfers NP = national product4
D = aggregate demand nta = other net taxes on production DS = (gross) domestic saving ntp = net taxes on products
EX = exports P = production value
2 In accordance with the SNA’s production account, this is equal to GDP at market prices minus net indirect
taxes (on products and production) (Santos 2003a, pp. 11-12).
3 This has the opposite mathematical sign to the net lending/borrowing of the SNA’s capital account, which
considers capital transfers as uses of that capital (Santos 2003a, pp. 15-16).
4 In accordance with the SNA’s primary distribution of income accounts, this is equal to gross national income
minus taxes on production and imports received by national institutions, net of subsidies paid by national institutions (Santos 2003a, pp. 12-13).
FC = final consumption S = aggregate supply GCF = gross capital formation TC = total costs I = aggregateinvestment / investment funds tm = trade margins IC = intermediate consumption TV = transactions value
IM = imports … J rw = … to the rest of the world Inc = aggregate income5 … I rw = … from the rest of the world
Because the National Accounts were the information source from which the SAMs were constructed, almost all their (non-financial6) flows are included in them. The European System of National and Regional Accounts in the European Community of 1995 - ESA 95, which is based on the 1993 version of the United Nations System of National Accounts - SNA 93, made it possible, in a more direct way than before (SNA 68), to construct aggregated SAMs that are in perfect harmony with this.
Centring our attention on institutions, it is possible in Figure 1 to see how the incomes (receipts) and the outlays (expenditures) were distributed among Portuguese institutions between 1995 and 2000.
From this same figure, it is also clear that the households lead other institutions in terms of total and current incomes and outlays, although their relative importance in terms of capital incomes and outlays is much less important, as is also shown by Table 2.
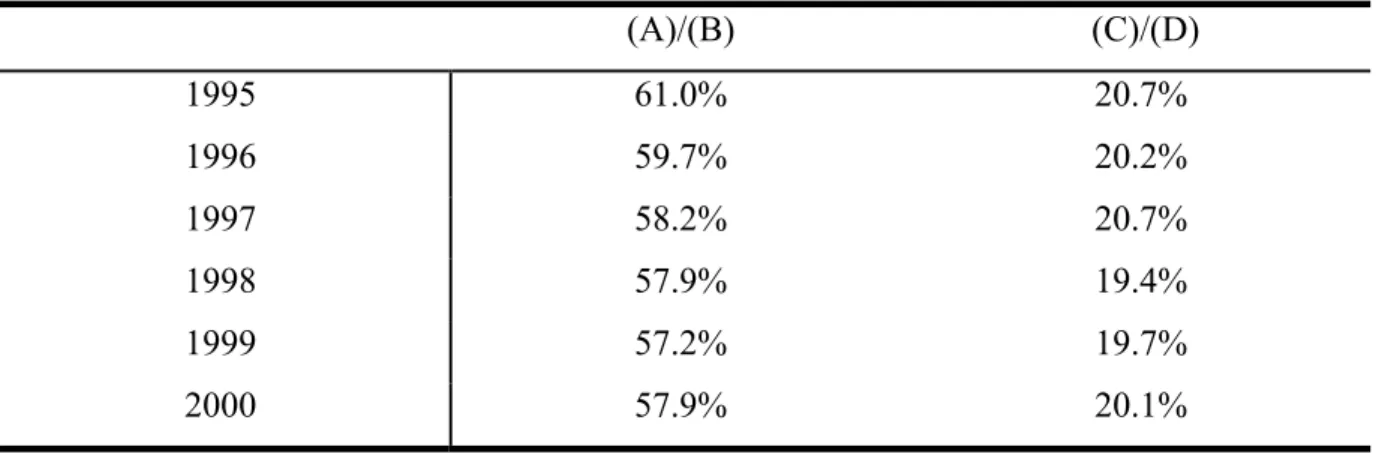
Therefore, aggregate household income was more than half of total aggregate income, although its relative importance decreased, especially from 1995 to 1999. On the other hand, aggregate household investment/investment funds was less than a quarter of the total and its relative importance also decreased, especially from 1995 to 1998. These decreases would only have been relative if the average growth rates had not been as shown in Table 3.
5 In accordance with the SNA’s secondary distribution of income accounts, the redistribution of income in kind
and the use of disposable income accounts, this is equal to gross national income plus current transfers within national institutions and current transfers from the rest of the world. Or, alternatively, it is equal to gross disposable income plus current transfers within national institutions and current transfers to the rest of the world (Santos 2003a, pp. 13-15).
6 In a previous work (Santos, 1999), financial flows, reflecting financial activities in capital accounts (King
1981), were also included. When SAMs began to be constructed with data from the European System of National and Regional Accounts in the European Community of 1995 (ESA 95), this proved to be impossible due to a lack of available information.
Table 2. Evolution of the relative importance of household current and capital income/expenditure (A)/(B) (C)/(D) 1995 61.0% 20.7% 1996 59.7% 20.2% 1997 58.2% 20.7% 1998 57.9% 19.4% 1999 57.2% 19.7% 2000 57.9% 20.1% Source: Portuguese SAMs (Appendixes)
Key:
(A) Aggregate household income (current receipts/expenditure of households) (B) Total aggregate income (total current receipts/expenditure)
(C) Aggregate household investment funds/investment (capital receipts/expenditure of households)
(D) Total aggregateinvestment/investment funds (total current receipts/expenditure)
Table 3. Average growth rates (between 1995 and 2000) of total and household receipts and expenditure
Aggregate household income
(current receipts/expenditure of households) 6.7% Total aggregate income
(total current receipts/expenditure) 7.8% Aggregate householdinvestment funds/investment
(capital receipts/expenditure of households) 8.9% Total aggregateinvestment/investment funds
(total current receipts/expenditure) 9.6%
Source: Portuguese SAMs (Appendixes)
As a matter of fact, the total amounts (of aggregate income and aggregate investment/investment funds) grew at a higher rate than the household amounts.
Figure 1. Distribution of incomes (receipts) and outlays (expenditures) among Portuguese Institutions from 1995 to 2000
Source: Portuguese SAMs (Appendixes) Current Receipts
(compensation of factors + net indirect taxes + current transfers, within the economy and from the rest of the world = aggregate
income) 0,0% 10,0% 20,0% 30,0% 40,0% 50,0% 60,0% 70,0% 1995 1996 1997 1998 1999 2000 Capital Receipts
(capital transfers, within the economy and from the rest of the world = investment funds - saving - net lending/borrowing)
0,0% 10,0% 20,0% 30,0% 40,0% 50,0% 60,0% 70,0% 1995 1996 1997 1998 1999 2000 Total Receipts 0,0% 10,0% 20,0% 30,0% 40,0% 50,0% 60,0% 70,0% 1995 1996 1997 1998 1999 2000 Current Expenditure
(final consumption + current transfers, within the economy and to the rest of the world = aggregate income - saving)
0,0% 10,0% 20,0% 30,0% 40,0% 50,0% 60,0% 70,0% 1995 1996 1997 1998 1999 2000 Total Expenditure 0,0% 10,0% 20,0% 30,0% 40,0% 50,0% 60,0% 1995 1996 1997 1998 1999 2000
Households Enterprises Government Others
Capital Expenditure
(gross capital formation + capital transfers, within the economy and to the rest of the world = investment)
0,0% 10,0% 20,0% 30,0% 40,0% 50,0% 60,0% 1995 1996 1997 1998 1999 2000
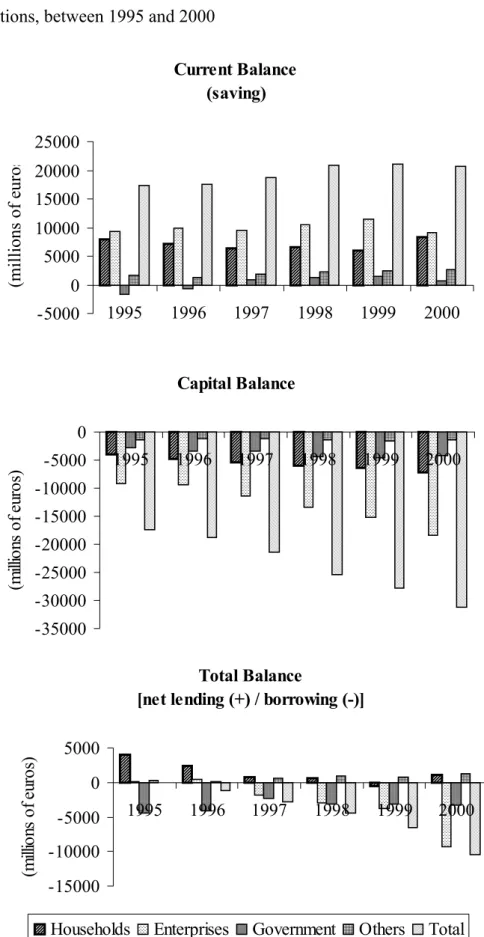
The position of Portuguese institutions in terms of the balance between receipts and expenditure can be seen in Figure 2, where households show a positive current balance, i.e. saving, although the capital balance is negative, as it is for all other institutions. The total balance of households was always positive, except in 1999, although its value has shown a significant decrease. We can therefore say that, generally speaking, Portuguese households have tended to enjoy financing ability although this ability has begun to decrease. This may be an aspect to explore in any attempt made to reduce the observed increase in the net borrowing of the Portuguese economy, shown by the last (total) column for each year in the bottom graph, whose approximate share in the GDP7 was: 0% in 1995; 1.3% in 1996; 3% in 1997; 4.5% in 1998; 6.1% in 1999 and 9.1% in 2000.
7 Approximate GDP (in millions of euros) = Added value + other net taxes on production + net taxes on products
(does not include net taxes on products that are receipts from European Union institutions, which are included in imports) = 86,211 in 1996; 92,857 in 1997; 100,815 in 1998; 107,901 in 1999 and 115,361 in 2000.
Figure 2. Balances between receipts and expenditures of the Portuguese economy and its institutions, between 1995 and 2000
Source: Portuguese SAMs (Appendixes) Current Balance (saving) -5000 0 5000 10000 15000 20000 25000 1995 1996 1997 1998 1999 2000 (millions of euro s Capital Balance -35000 -30000 -25000 -20000 -15000 -10000 -5000 0 1995 1996 1997 1998 1999 2000 (m ill ion s of e ur os ) Total Balance
[net lending (+) / borrowing (-)]
-15000 -10000 -5000 0 5000 1995 1996 1997 1998 1999 2000 (m ill ion s of e ur os )
As the beginning of an ambitious project for studying income distribution and poverty in Portugal, we will study the effects on aggregate household income and aggregate investment/investment funds resulting from changes in their current and capital receipts.
The SAM will be modelled in keeping with this aim, for the six years of our series.
3. THE SAM MODELLING 3.1. Methodology
In keeping with the work of G. Pyatt and A. Roe (1977), G. Pyatt and J. Round (1985) and J. Defourny and E. Thorbecke (1984), the base methodology of the multipliers and their decomposition will be used, considering the current and capital accounts of households, as well as the production accounts, as endogenous.
Table 4. SAM in endogenous and exogenous accounts
Expenditures
Endogenous Exogenous
Sum Sum Total
Endogenous N n X x yn
Exogenous L l R r yx
Receipts
Total y’n y’x
Key:
- Endogenous accounts in the Portuguese SAMs, see the Appendixes (number of the accounts in brackets): current and capital accounts of households (1 and 5); factors of production (9 and 10); activities (11) and products (12).
- Exogenous accounts in the Portuguese SAMs: current and capital accounts of enterprises or non-financial corporations (2 and 6), government (3 and 7), and other institutions or financial corporations and non-profit institutions serving households (4 and 8); the rest of the world (13); and errors and omissions (14).
-
L = leakages from endogenous into exogenous accounts-
X = injections from exogenous into endogenous accounts From Table 4, it can be written thatyn = n + x (1)
yx = l + r (2)
The amount that the endogenous accounts receive is equal to the amount that they spend. In other words, in aggregate terms, total injections from the exogenous into the endogenous accounts
,
i.e. the column sum of “x”, are equal to total leakages from the endogenous into the exogenous accounts, i.e. considering i’ to be the unitary vector (row), the column sum of “1” is: x * i’ = l * i’. (3)a) Deduction of the accounting multipliers In the structure of Table 4, if the entries in the N matrix are divided by the corresponding total expenditures, a corresponding matrix (squared) can be defined of the average expenditure propensities of the endogenous accounts within the endogenous accounts or of the use of resources within those same accounts. Calling this matrix An, it can be written that An = N*ŷn -1 (4)
N = An* ŷn (5)
Considering equation (1), yn = An*yn + x (6)
Therefore, yn = (I-An)-1* x = Ma * x. (7)
We thus have the equation that gives the total receipts of the endogenous accounts (yn), by multiplying the injections “x” by the matrix of the accounting multipliers: Ma = (I-An)-1. (8)
On the other hand, if the entries in the L matrix are divided by the corresponding total expenditures
,
a corresponding matrix (non squared) can be defined of the average expenditure propensities of the endogenous accounts within the exogenous accounts or of the use of resources from the endogenous accounts within the exogenous accounts. Calling this matrix Al, it can be written that Al = L*ŷn-1 (9)L = Al* ŷn (10)
Thus, l = Al * yn = Al * (I-An)-1* x = Al * Ma * x. (12)
So, with the accounting multipliers, the impact of changes in receipts is analysed at the moment, assuming that the structure of expenditure in the economy does not change. This type of methodology allows for a static analysis to be made, assuming also that there is excess capacity, prices remain constant and the production technology and resource endowment are given.
To have an idea about the level of veracity of the calculated accounting multipliers, a test was carried out in accordance with such a methodology, for the beginning of our series. In order to do this, accounting multipliers were first calculated from the Portuguese SAM for 1995, whilst the changes that really occurred from 1995 to 1996 were also considered, i.e. the “x” vector of the Portuguese SAM for 1996, and the new vector of receipts of the endogenous accounts (yn) was calculated. From this, and with the aid of the matrices of average
expenditure propensities (An and Al) for 1995, the endogenous part of the SAM was
re-calculated for 1996, where the value of aggregate household income showed a percentage difference in relation to the real SAM values of 1.12%, whilst the difference in investment/investment funds was 29.62%. The corresponding percentage difference, i.e. the difference between the calculated and the real total values, was 1.12% for account 9 (labour), 2.20% for account 10 (capital), 1.54% for account 11 (activities), and 1.53% for account 12 (products).
In previous studies (Santos, 1999, 2003b), lower differences were obtained, probably due to a higher level of disaggregation of the SAM accounts.
Taking into account these results and the assumptions referred to before, we will analyse our results in an indicative fashion.
b) Decomposition of the accounting multipliers
Accounting multipliers can be decomposed if we consider the An matrix and two other
ones with the same size (Bn - with the diagonal of An, whilst all the other elements are null -
and Cn - with a null diagonal, but with all the other elements of An). In this way, it can be
written that
An = Bn + Cn. (13)
yn = Bn * yn +Cn * yn + x = [I – (I - Bn)-1 *Cn]-1 * (I - Bn)-1 * x . 8 (14)
Therefore: Ma = [I – (I - Bn)-1 *Cn]-1 * (I - Bn)-1 = M3*M2*M1. (15)
The accounting multiplier matrix is thus decomposed into multiplicative components, each of which relates to a particular kind of connection in the system as a whole (Stone, 1985)9. - The intragroup or direct effects matrix, which represents the effects of the initial exogenous
injection within the groups of accounts into which it had originally entered, i.e.:
M1 = (I - Bn)-1. (16)
- The intergroup or indirect effects matrix, which represents the effects of the exogenous injection into the groups of accounts, after its repercussions have completed a tour through all the groups and returned to the one which they had originally entered. In other words, if we consider “t” to be the number of groups of accounts (five in the present study):
M2 = {I - [(I - Bn)-1 *Cn ]t}-1. (17)
- The extragroup or cross effects matrix, which represents the effects of the exogenous injection
,
when it has completed a tour outside its original group without returning to it, or, in other words, when it has moved around the whole system and ended up in one of the other groups. Thus, if we consider “t” to be the number of groups of accounts:M3 = {I + [(I - Bn)-1 *Cn ] + [(I - Bn)-1 *Cn ]2 + … + [(I - Bn)-1 *Cn ]t-1} (18)
The decomposition of the accounting multiplier matrix can also be undertaken in an additive form, as follows:
Ma = I + (M1 - I) + (M2 - I) * M1 + (M3 - I) * M2* M1. (19)
Where I represents the initial injection and the remaining components the additional effects associated, respectively, with the three components described above (M1, M2 and M3).
Defourny and Thorbecke (1984) introduced an alternative to the above decomposition, namely structural path analysis, which makes it possible to identify and quantify the links between the pole (account) of origin and the pole (account) of destination of the impulses resulting from injections. According to this technique, the accounting multiplier is considered
8
yn = An*yn + x = Bn*yn + Cn*yn + x ⇔ yn - Bn*yn = Cn*yn + x ⇔ yn = (I-Bn)-1* Cn * yn + (I-Bn)-1 *x ⇔ yn - (I-Bn)-1 *
Cn * yn = (I-Bn)-1 *x ⇔ [I - (I-Bn)-1 * Cn] * yn = (I-Bn)-1 * x ⇔ yn = [I - (I-Bn)-1 * Cn]-1 * (I-Bn)-1 * x.
9 For a detailed deduction and explanation of these components, see, for example, Stone (1985, pp. 156-162);
as a “global influence”, which is decomposed into a series of “total influences”. These, in turn, are decomposed into “direct influences” multiplied by the “path multiplier”:
= = ∑
(
)
= ∑(
)
= → = → → n p D p j i n p T p j i G j) (i ji I I I *Mp ma 1 1 (20) Where:maji is the (j,i)th element of the Ma (accounting multipliers) matrix, which quantifies the
full effect of a unitary injection xj on the endogenous variable yj; G
j) (i
I → is the Global Influence of pole i on pole j;
p is the nth elementary path - the arc linking two different poles, oriented in the direction of the expenditure, located between i and j, with i being the pole of origin of the elementary path 1 (the first) and j the pole of destination of the elementary path n (the last);
T j)
(i p
I → is the Total Influence transmitted from i to j along the elementary path p;
D j)
(i p
I → is the Direct Influence of i on j transmitted along the elementary path p, which measures the magnitude of the influence transmitted between its two poles through the average expenditure propensity;
Mp is the Multiplier of the path p, or the path Multiplier, which expresses the extent to which the influence along elementary path p is amplified through the effects of adjacent feedback circuits10:
∆ ∆ = p
Mp (21)
where: ∆ = the determinant of matrix I-Anof the structure represented by the SAM,
∆p = the determinant of the submatrix of I-Anobtained by removing the row
and the column associated with the poles of the elementary path p.
10 A circuit is a path for which the first pole (pole of origin) coincides with the last pole (pole of destination)
3.2. Evaluation with changes in household income a) Effects of changes in household current income
In keeping with what was seen before, the items that can be changed in household current receipts (the items in row 1 of the X matrix, presented in Table 4 or cells (1,2), (1,3), (1,4) and (1,13), of the SAMs (in the Appendixes, see also the description of the cell contents) are: 1. social benefits other than social transfers in kind from non-financial corporations,
government, financial corporations, non-profit institutions serving households and the rest of the world;
2. social transfers in kind from government and non-profit institutions serving households; 3. non-life insurance claims from financial corporations and the rest of the world;
4. miscellaneous current transfers from non-financial corporations, government and the rest of the world;
Average expenditure propensities show that households spent a unit of their current receipts as follows (column 1 of An and Al matrices):
1995 1996 1997 1998 1999 2000 - Current transfers within households, to
government, other institutions and the rest of
the world……….. 0.15 0.15 0.15 0.15 0.15 0.15 - Gross savings ………... 0.10 0.09 0.07 0.07 0.06 0.08 - Final consumption ………... 0.75 0.76 0.77 0.78 0.79 0.77 Therefore, three quarters or more of a unit of household current receipts go towards final consumption. Its relative share increased from 1995 to 1999, recording a slight decrease in 2000, but nonetheless always changing by the same amount as the decrease (increase in 2000) in gross savings. The current transfers, within households, to government, other institutions and the rest of the world, remained unaltered in the expenditure structure of Portuguese households in the period studied.
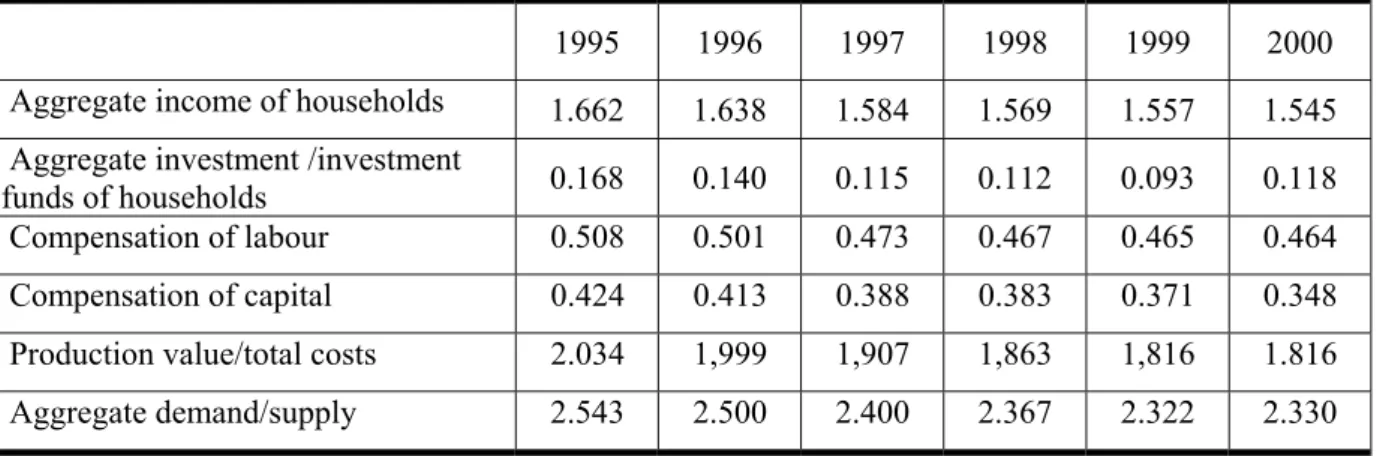
These values can be understood as reflecting the direct influence of a unitary change in the (above-described) household current receipts, whereas the global influence is quantified by the values of the accounting multipliers and their components, as shown in Tables 5, 6 and 7.
Table 5: Global influences of unitary changes in the exogenous current receipts of households 1995 1996 1997 1998 1999 2000
Aggregate income of households 1.662 1.638 1.584 1.569 1.557 1.545
Aggregate investment /investment
funds of households 0.168 0.140 0.115 0.112 0.093 0.118
Compensation of labour 0.508 0.501 0.473 0.467 0.465 0.464
Compensation of capital 0.424 0.413 0.388 0.383 0.371 0.348
Production value/total costs 2.034 1,999 1,907 1,863 1,816 1.816
Aggregate demand/supply 2.543 2.500 2.400 2.367 2.322 2.330
Source: Portuguese accounting multiplier matrices (Ma) from 1995 to 2000.
Apart from the effect on the aggregate income of households, where 1 is the initial injection of income, the greatest effects of unitary changes in the current receipts of households were felt on production values and aggregate demand, reflecting the great importance of final consumption for the total current outlays of households, as noted earlier.
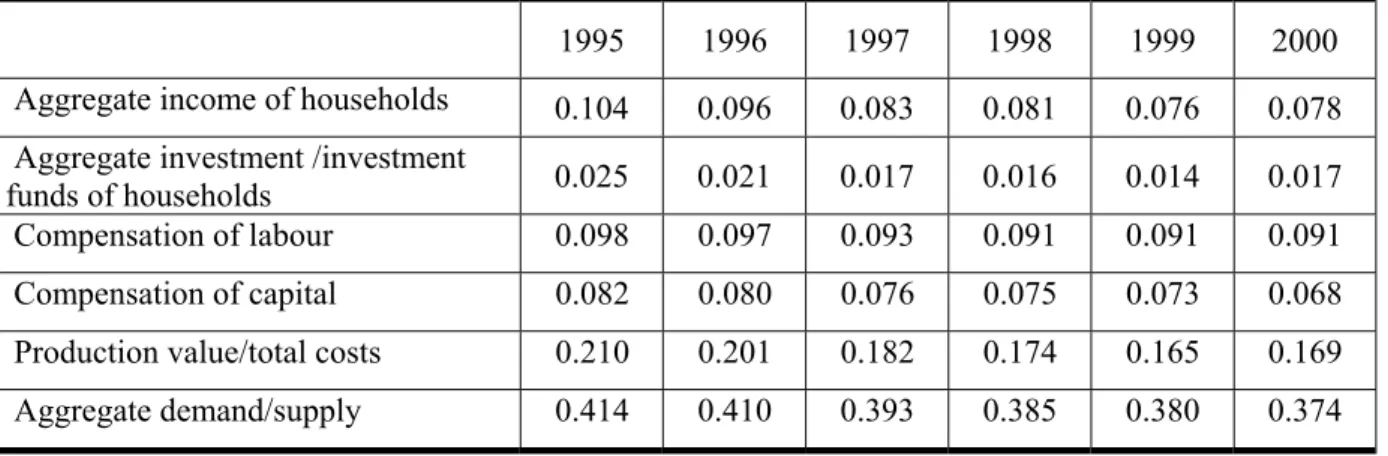
On the other hand, the predominance of additional extragroup influences, shown by Table 6, means that most of the repercussions originating from the current account of households (1) do not return to it, with the additional intergroup influences, shown by Table 7, representing those repercussions that do in fact return. Additional intragroup effects were felt only at the level of the aggregate income of households, with a constant value of 0.005. In turn, the positive values of all these influences represent changes that have the same mathematical sign as the initial change – for instance, increases in the exogenous current receipts of households will result in increases in the items presented in the rows of Tables 5, 6 or 7.
Table 6: Additional extragroup influences of unitary changes in the exogenous current receipts of households
1995 1996 1997 1998 1999 2000
Aggregate income of households 0.552 0.537 0.495 0.483 0.476 0.462
Aggregate investment /investment
funds of households 0.143 0.119 0.098 0.096 0.079 0.102
Compensation of labour 0.410 0.404 0.380 0.376 0.374 0.373
Compensation of capital 0.342 0.333 0.311 0.308 0.299 0.280
Production value/total costs 1.824 1.798 1.725 1.688 1.652 1.647
Aggregate demand/supply 2.129 2.090 2.007 1.982 1.943 1.957
Table 7: Additional intergroup influences of unitary changes in the exogenous current receipts of households
1995 1996 1997 1998 1999 2000
Aggregate income of households 0.104 0.096 0.083 0.081 0.076 0.078
Aggregate investment /investment
funds of households 0.025 0.021 0.017 0.016 0.014 0.017
Compensation of labour 0.098 0.097 0.093 0.091 0.091 0.091
Compensation of capital 0.082 0.080 0.076 0.075 0.073 0.068
Production value/total costs 0.210 0.201 0.182 0.174 0.165 0.169
Aggregate demand/supply 0.414 0.410 0.393 0.385 0.380 0.374
Source: Additional intergroup effects matrices ((M2-I)*M1) from 1995 to 2000.
The general decrease in the global influence (and its components) from 1995 to 2000, sometimes with a slight increase in 2000, is in keeping with what was seen in Tables 2 (see also the three left hand graphs of Figure 1A, in the Appendix), namely the decrease in the relative share of aggregate household income in total aggregate income.
b) Effects of changes in household capital income
The items that can be changed in household capital income (the items in row 5 of the X matrix, presented in Table 4, or cells (5,7), (5,8), (5,13) and (5,14), of the SAMs) are:
1. investment grants from government and the rest of the world;
2. (other) capital transfers from financial corporations and the rest of the world; 3. net lending.
As was seen before, average expenditure propensities show that households spent a unit of their (now) capital receipts as follows (column 5 of An and Al matrices):
1995 1996 1997 1998 1999 2000 - Gross Capital Formation……….. 1.13 1.14 1.08 1.13 1.12 1.14 - Capital taxes and (other) capital transfers to
government……….. 0.01 0.01 0.06 0.01 0.01 0.01 - Acquisitions minus disposals of non-produced
non-financial assets and (other) capital
The predominance of gross capital formation is evident, with a slight fluctuation from 1995 to 2000. Once again, the direct influence of a unitary change in the (now capital) receipts of households was most noted in the products account (12).
Table 8 shows the global influences of a similar change.
Table 8: Global influences of unitary changes in the exogenous capital receipts of households 1995 1996 1997 1998 1999 2000
Aggregate income of households 0.853 0.837 0.727 0.735 0.718 0.713
Aggregate investment /investment
funds of households 1.087 1.071 1.053 1.053 1.043 1.055
Compensation of labour 0.661 0.663 0.595 0.609 0.605 0.612
Compensation of capital 0.551 0.546 0.487 0.499 0.483 0.460
Production value/total costs 2.645 2.642 2.398 2.428 2.363 2.396
Aggregate demand/supply 3.307 3.304 3.018 3.085 3.021 3.075
Source: Portuguese accounting multiplier matrices (Ma) from 1995 to 2000.
Therefore, apart from the effect on the investment funds/aggregate investment of households, where 1 is the initial injection of income, the greatest effects of unitary changes in the capital receipts of households were felt in production values and aggregate demand, just as in the case of current receipts, but now with higher values, reflecting the large share of gross capital formation in the total capital outlays of households.
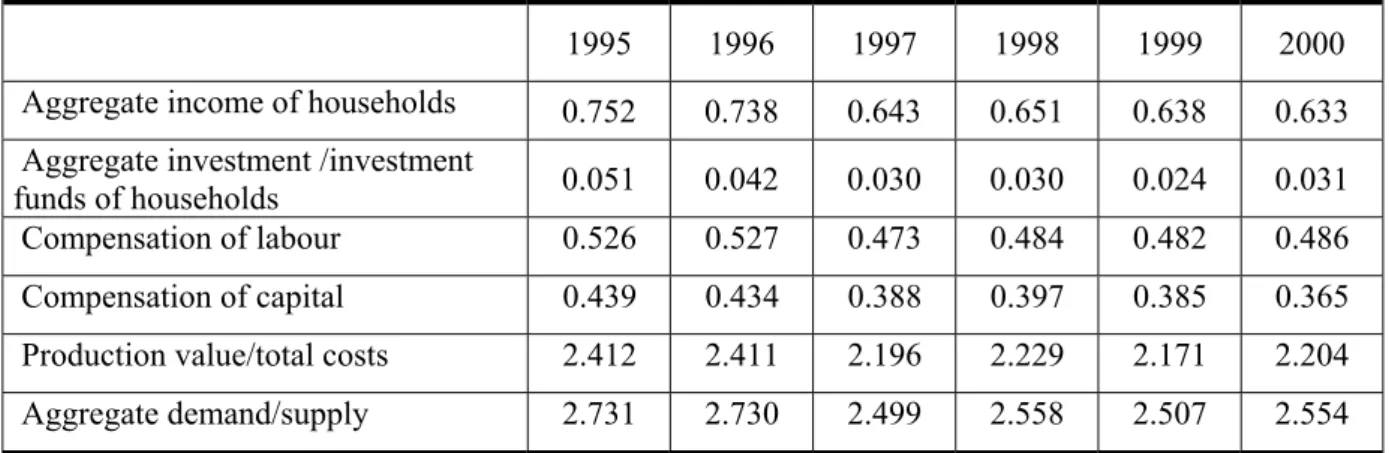
Table 9: Additional extragroup influences of unitary changes in the exogenous capital receipts of households
1995 1996 1997 1998 1999 2000
Aggregate income of households 0.752 0.738 0.643 0.651 0.638 0.633
Aggregate investment /investment
funds of households 0.051 0.042 0.030 0.030 0.024 0.031
Compensation of labour 0.526 0.527 0.473 0.484 0.482 0.486
Compensation of capital 0.439 0.434 0.388 0.397 0.385 0.365
Production value/total costs 2.412 2.411 2.196 2.229 2.171 2.204
Aggregate demand/supply 2.731 2.730 2.499 2.558 2.507 2.554
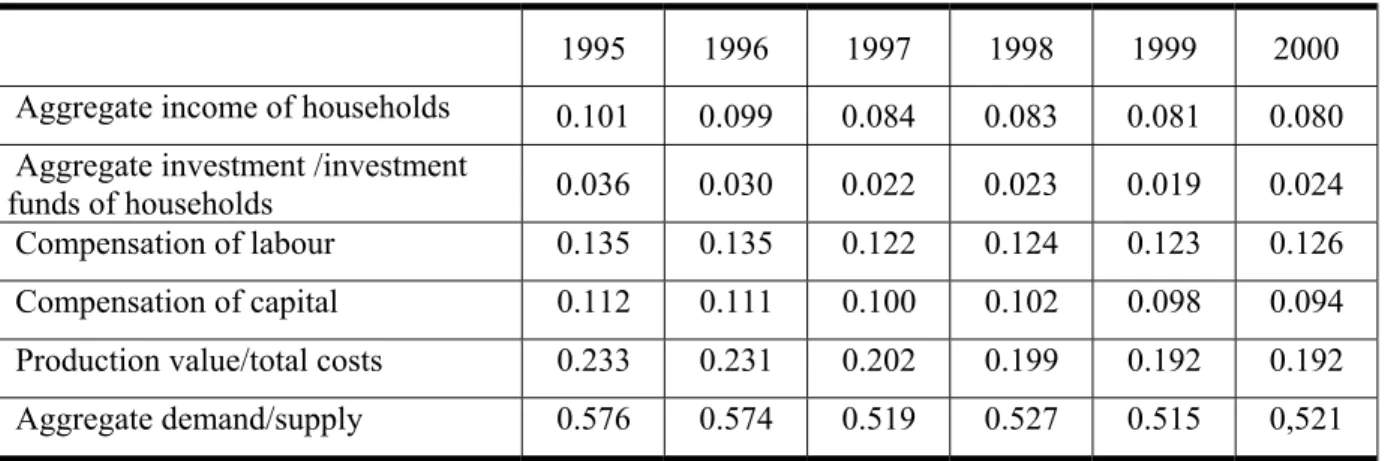
Table 10: Additional intergroup influences of unitary changes in the exogenous capital receipts of households
1995 1996 1997 1998 1999 2000
Aggregate income of households 0.101 0.099 0.084 0.083 0.081 0.080
Aggregate investment /investment
funds of households 0.036 0.030 0.022 0.023 0.019 0.024
Compensation of labour 0.135 0.135 0.122 0.124 0.123 0.126
Compensation of capital 0.112 0.111 0.100 0.102 0.098 0.094
Production value/total costs 0.233 0.231 0.202 0.199 0.192 0.192
Aggregate demand/supply 0.576 0.574 0.519 0.527 0.515 0,521
Source: Additional intergroup effects matrices ((M2-I)*M1) from 1995 to 2000.
Once again, we have positive values for all the additional influences and a predominance of extragroup influences, as can be seen in Tables 9 and 10, meaning that most of the repercussions originating from the capital account of households (5) do not return to it.
As was seen in the case of changes in household current income, and also in the case of household capital income, there is a general decrease in the global influence (and its components) from 1995 to 2000, sometimes with a slight increase in 2000 - see also the three right hand graphs of Figure 1A, in the Appendix.
c) Network of linkages between endogenous accounts
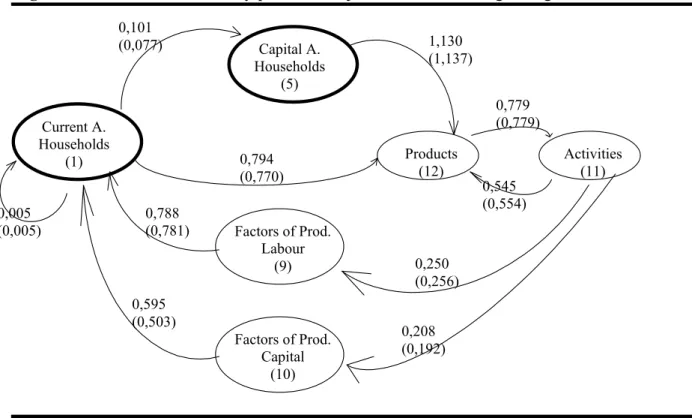
Figure 3 helps us to understand the importance of the additional extragroup influences of changes taking place in the current or capital accounts of households (Tables 6 and 9), as well as the values of the global influences (Tables 5 and 8) of changes in the current and capital receipts of households on production accounts (9-12).
Considering the importance of final consumption for households, the cells (12,1) of the accounting multiplier matrices (Ma) were decomposed, from 1995 to 2000, through structural
0,101 (0,077) 1,130 (1,137) 0,794 (0,770) 0,779 (0,779) 0,545 (0,554) 0,250 (0,256) 0,595 (0,503) 0,788 (0,781) 0,005 (0,005) 0,208 (0,192)
Figure 3. Network of elementary paths and adjacent circuits linking endogenous accounts
Note: This outline represents only the paths whose poles of origin and destination are the endogenous accounts of our model.
Source: An (average expenditure propensity) matrices, calculated from the Portuguese SAMs
for 1995 and 2000 (values in brackets)
Table 11: Structural path analysis of the global influences on aggregate demand of unitary changes in the exogenous current receipts of households
1995 1996 1997 1998 1999 2000 Accounting Multiplier 2.543 2.500 2.400 2.367 2.322 2.330 T 1 12) (1 I → 0.337 0.283 0.220 0.222 0.181 0.237 T 2 12) (1 I → 2.206 2.216 2.180 2.145 2.141 2.093 D 1 12) (1 I → 0.115 0.097 0.078 0.081 0.067 0.087 D 2 12) (1 I → 0.749 0.762 0.774 0.778 0.790 0.770 Mp 2.944 2.909 2.817 2.756 2.711 2.718
Source: Portuguese accounting multiplier matrices (Ma) from 1995 to 2000.
Capital A. Households (5) Current A. Households (1) Factors of Prod. Labour (9) Factors of Prod. Capital (10) Products (12) Activities (11)
As can be seen from Figure 3, path 1, represented by the arc above, links account 1 to account 12 through account 5, while path 2 makes the same link, but in this case directly. The total influence of the first is significantly lower than that of the second, whilst the high values of the path multipliers show that the most important influences are those of adjacent feedback circuits, a feature that is in keeping with what was noted in relation to the amounts of the additional extragroup and intergroup influences.
A general decrease can be noted here in all the influences from 1995 to 2000, sometimes with a slight increase in 2000. Positive values can also be noted.
4. CONCLUDING REMARKS
The SAM approach has shown itself to be a practical working instrument of considerable value as an accounting framework that includes all non-financial transactions within the economy and thereby provides a quantitative basis for analysis.
It was possible to see that Portuguese aggregate household income amounted to more than half of the total aggregate income of Portugal and that the relative share of the former in the latter decreased from 1995 to 2000, with the average growth rates in that period being lower for household current and capital income than for the total.
Changes in social benefits and transfers, non-life insurance claims and miscellaneous current transfers (current incomes), received by households, mostly affected aggregate demand through final consumption and the production value in direct and global terms. Almost the same effect was produced by changes in investment grants and (other) capital transfers (capital incomes), but this time through gross capital formation. In the case of such impacts, additional extragroup effects predominated, meaning that most of the repercussions of those changes do not return to the account where they were originally felt, and that the additional intergroup effects represent those repercussions that do return (additional intragroup effects were not felt). This fact was confirmed by the high values of the calculated path multipliers for the impact of a unitary change in households’ current receipts (account 1) on the products account (12).
In all the experiments carried out with the built model, the effects had the same mathematical sign as the initial change and their amounts were, generally speaking, less
important in 2000 than in 1995 but revealing a stable tendency (shown by the various tables and graphs presented).
Therefore, the SAM-based study that was carried out has made it possible to describe some structural features of the Portuguese economy from 1995 to 2000 with an emphasis on households. Through its modelling with the use of accounting multipliers, it was possible to set limits for the quantitative impact (i.e. the limits within which the impact could be noted) of various types of interventions relating to household income on the economy as a whole, with their importance for production accounts and the stability of these limits being evident.
Despite its limiting assumptions, the SAM can be understood as a useful working instrument for improving our basic knowledge of all socio-economic mechanisms, as well as for constructing short-term scenarios involving changes in certain flows that it represents. Besides the test on the veracity of the results, undertaken in this study, many others could be undertaken, involving other years, to confirm the usefulness of the SAM. Other studies could also be undertaken, changing, for instance, the position of the dividing line between endogenous and exogenous accounts (using the words of Stone, 1981) or the expenditure structure.
We hope that the present study has been a good starting point for a study that we plan to carry out into income distribution and poverty in Portugal, using the SAM11. The next stage will be the disaggregation of the household sector, identifying the poor, and research into other modelling methodologies (based on SAMs), with less limiting assumptions.
11 The set of articles about the special issue “Accounting for poverty and income distribution analysis”,
published in June 2003 in Vol. 15(2) of Economic Systems Research, and, in a more indirect way, the book by Duchin, F. (1998) “Structural Economics: Measuring Changes in Technologies, Lifestyles, and the Environment” (New York, Oxford University Press) have been useful guides.
REFERENCES
Defourny, J. and Thorbecke, E. (1984) Structural Path Analysis and Multiplier Decomposition within a Social Accounting Matrix Framework. The Economic Journal, 94, 111-136.
Khan, H. A. and Thorbecke, E. (1989) Macroeconomic Effects of Technology Choice: Multiplier and Structural Path Analysis within a SAM Framework. Journal of Policy Modeling, 11, 131-156.
Khan, H. A. (1997) Technology systems and technological dualism in a Social Accounting Framework. In H. A. Khan, Technology, Energy and Development: The South Korean Transition (pp. 28-60). Cheltenham, U.K. and Lyme, U.S.: E. Elgar.
King, B. (1981) What is a SAM? A Layman's Guide to Social Accounting Matrices, World Bank Staff Working Paper No. 463. USA, The World Bank.
Pyatt, G. (1988) A SAM Approach to Modeling. Journal of Policy Modeling, 10, 327-352. Pyatt, G. (1991a) Fundamentals of Social Accounting. Economic Systems Research, 3,
315-341.
Pyatt, G. (1991b) SAMs, the SNA and National Accounting Capabilities, Review of Income and Wealth, 37, 177-198.
Pyatt, G. and Roe, A. (1977) Social Accounting for Development Planning with special reference to Sri Lanka. Cambridge: Cambridge University Press.
Pyatt, G. and Round, J. (1985) Accounting and Fixed Price Multipliers in a Social Accounting Matrix Framework. In Pyatt, G. and Round J. (coord.) Social Accounting Matrices. A Basis for Planning (pp. 186-206). Washington, US: The World Bank. Also in Economic Journal 89 (356), 1979 (pp. 850-873).
Pyatt, G. and Thorbecke, E. (1976) Planning Techniques for a Better Future. Geneva: International Labor Office.
Round, J. (2003) Constructing SAMs for Development Policy Analysis: Lessons Learned and Challenges Ahead. Economic Systems Research, 15, 161- 183.
Santos, S. (1999) The Social Accounting Matrix as a working instrument for defining economic policy. Its application to Portugal during the period 1986-90, with emphasis on the agroindustrial sector (only available in Portuguese). Higher Institute of Economics and Business Administration, Ph.D. Dissertation, Lisbon.
Santos, S. (2001) The importance of the Social Accounting Matrix. Its application to Portugal during the period 1990-95. Higher Institute of Economics and Business Administration, Department of Economics Seminar, Lisbon.
Santos, S. (2003a) Quantitative analysis of the economic flows between Portugal and the other European Union Member States and Institutions in 1997. Higher Institute of Economics and Business Administration, Centre of Research on European and International Economics, Working Paper No. 2/03, Lisbon.
Santos, S. (2003b) Social Accounting Matrices for Portugal in 1998-99. Modelling the effects of changes in government receipts and expenditure, Higher Institute of Economics and Business Administration, Working Paper No. 07/2003/Department of Economics/Research Unit on Complexity in Economics, Lisbon.
Stone, R. (1985) The Disaggregation of the Household Sector in the National Accounts. In Pyatt, G. and Round J. (coord.) Social Accounting Matrices. A Basis for Planning (pp. 145 -185). Washington, US: The World Bank.
Thorbecke, E. (1985) The Social Accounting Matrix and Consistency-Type Planning Models. In Pyatt, G. and Round J. (coord.) Social Accounting Matrices. A Basis for Planning (pp. 207-256). Washington, US: The World Bank.
Thorbecke, E. (2001) The Social Accounting Matrix: Deterministic or Stochastic Concept? Institute of Social Studies, Conference in Honour of Graham Pyatt’s retirement, The Hague, Netherlands.
Description of the SAM cell contents
Row Col. Contents
1 1 Social benefits other than social transfers in kind and miscellaneous current transfers within households
1 2 Social benefits other than social transfers in kind and miscellaneous current transfers from non-financial corporations to households
1 3 Social benefits other than social transfers in kind, social transfers in kind and miscellaneous current transfers from government to households
1 4 Social benefits other than social transfers in kind received by households from financial corporations and non-profit institutions serving households; social transfers in kind from non-profit institutions serving households to households; non-life insurance claims from financial corporations to households; adjustment for the change in the net equity of households in pension funds
1 9 Wages and salaries plus imputed social contributions received by the households
1 10 Gross mixed income plus net property income received by the households 1 13 Social benefits other than social transfers in kind, non-life insurance
claims and miscellaneous current transfers received by households from the rest of the world
2 2 Miscellaneous current transfers within non-financial corporations
2 3 Miscellaneous current transfers from government to non-financial corporations
2 4 Non-life insurance claims and miscellaneous current transfers from financial corporations to non-financial corporations
2 9 Imputed social contributions received by non-financial corporations 2 10 Gross operating surplus plus net property income received by
non-financial corporations
2 13 Non-life insurance claims received by non-financial corporations from the rest of the world
3 1 Current taxes on income, wealth, etc., employees’ social contributions, social contributions by self-employed and non-employed persons and miscellaneous current transfers received by government from households 3 2 Current taxes on income, wealth, etc., and miscellaneous current transfers
received by government from non-financial corporations
3 3 Current transfers and miscellaneous current transfers within government 3 4 Current taxes on income, wealth, etc. paid by financial corporations and
non-profit institutions serving households to government; non-life insurance claims paid by financial corporations to government; miscellaneous current transfers from financial corporations and non-profit institutions serving households to government
3 9 Imputed social contributions received by general government plus employers’ actual social contributions received by social security funds 3 10 Gross operating surplus plus net property income received by general
Row Col. Contents
3 11 Other taxes on production net of subsidies (on production)
3 12 Taxes on products paid by the national institutions net of subsidies (on products) received by the same institutions
3 13 Current international cooperation and miscellaneous current transfers received by government from the rest of the world
4 1 Employees’ social contributions, social contributions by self-employed and non-employed persons and net non-life insurance premiums received by financial corporations from households; miscellaneous current transfers from households to non-profit institutions serving households 4 2 Net non-life insurance premiums received by financial corporations from
financial corporations; miscellaneous current transfers from non-financial corporations to non-financial corporations and non-profit institutions serving households
4 3 Net non-life insurance premiums received by financial corporations from government; miscellaneous current transfers from government to non-profit institutions serving households
4 4 Net life insurance premiums paid by financial corporations and non-profit institutions serving households to financial corporations; non-life insurance claims paid by financial corporations to themselves and to non-profit institutions serving households; miscellaneous current transfers from financial corporations to non-profit institutions serving households and within the latter
4 9 Imputed social contributions received by financial corporations and non-profit institutions serving households
4 10 Gross operating surplus plus net property income received by financial corporations and non-profit institutions serving households
4 13 Net non-life insurance premiums and non-life insurance claims received by financial corporations from the rest of the world
5 1 Gross savings of households
5 7 Investment grants and other capital transfers from local government to households
5 8 Other capital transfers from financial corporations to households
5 13 Investment grants and other capital transfers from the rest of the world to households
5 14 Net lending (-)/borrowing (+) of households 6 2 Gross savings of non-financial corporations
6 7 Investment grants and other capital transfers from government to non-financial corporations
6 8 Other capital transfers from social security funds to non-financial corporations
6 13 Investment grants and other capital transfers from the rest of the world to non-financial corporations
6 14 Net lending (-)/borrowing (+) of non-financial corporations 7 3 Gross savings of government
Row Col. Contents
7 5 Capital taxes and other capital transfers received by government from households
7 6 Other capital transfers from non-financial corporations to government 7 7 Investment grants and other capital transfers within central government 7 8 Other capital transfers from financial corporations and non-profit
institutions serving households to government
7 13 Investment grants and other capital transfers from the rest of the world to government
7 14 Net lending (-)/borrowing (+) of government
8 4 Gross savings of financial corporations and non-profit institutions serving households
8 6 Other capital transfers from non-financial corporations to financial corporations
8 7 Investment grants and other capital transfers from government to non-profit institutions serving households
8 8 Other capital transfers within financial corporations
8 13 Investment grants from the rest of the world to non-profit institutions serving households
8 14 Net lending (-)/borrowing (+) of financial corporations and non-profit institutions serving households
9 11 Compensation of employees paid by the activities
9 13 Compensation of employees paid by the rest of the world (from non-resident employers)
10 11 Gross operating surplus of activities
10 13 Property income paid by the rest of the world 11 12 Output of goods and services
12 1 Actual household final consumption 12 3 Actual government final consumption
12 5 Gross Capital Formation by the enterprises classified in the household institutional sector
12 6 Gross Capital Formation by non-financial corporations 12 7 Gross Capital Formation by government
12 8 Gross Capital Formation by financial corporations and non-profit institutions serving households
12 11 Intermediate consumption
12 13 Exports plus direct purchases in domestic market by non-residents and the c.i.f./f.o.b. adjustment
13 1 Net non-life insurance premiums and miscellaneous current transfers received by the rest of the world from households; direct purchases abroad by residents
Row Col. Contents non-financial corporations
13 3 Net non-life insurance premiums, current international cooperation, miscellaneous current transfers and social benefits other than social transfers in kind received by the rest of the world from government
13 4 Net non-life insurance premiums received by the other countries of the rest of the world from financial corporations and non-profit institutions serving households; non-life insurance claims received by the rest of the world from financial corporations
13 5 Acquisitions minus disposals of non-produced non-financial assets and other capital transfers from households to the rest of the world
13 6 Acquisitions minus disposals of non-produced non-financial assets and other capital transfers from non-financial corporations to the rest of the world
13 7 Acquisitions minus disposals of non-produced non-financial assets, investment grants and other capital transfers from government to the rest of the world
13 8 Acquisitions minus disposals of non-produced non-financial assets from financial corporations to the rest of the world
13 9 Compensation of employees received by the rest of the world (paid to non-resident employees)
13 10 Property income received by the rest of the world
13 11 Minus other subsidies on production received, by activities, from the institutions and other countries of the European Union
13 12 Imports plus the part of taxes on products received by the institutions of the European Union net of the subsidies (on products) received from the same institutions
14 13 Net lending of the rest of the world /Net borrowing of the Portuguese economy
Figure 1A: Accounting multipliers and additional extragroup and intergroup components from 1995 to 2000
Total Accounting Multipliers (current account of households)
0,000 0,500 1,000 1,500 2,000 2,500 3,000 1995 1996 1997 1998 1999 2000
Total Accounting Multipliers (capital account of households)
0,000 0,500 1,000 1,500 2,000 2,500 3,000 3,500 1995 1996 1997 1998 1999 2000
Accounting Multipliers Componentes (current account of households)
- Aditional extragroup effects
0,000 0,500 1,000 1,500 2,000 2,500 1995 1996 1997 1998 1999 2000
Accounting Multipliers Componentes (capital account of households)
- Aditional extragroup effects
0,000 0,500 1,000 1,500 2,000 2,500 3,000 1995 1996 1997 1998 1999 2000
Accounting Multipliers Componentes (capital account of households)
- Aditional intergroup effects
0,000 0,100 0,200 0,300 0,400 0,500 0,600 0,700 1995 1996 1997 1998 1999 2000 Agreg.Inc.Hous. Agreg.Inv.Hous. Comp.Labour Comp.Capital Prod.V./Tot.Cos Agreg.D/S
Accounting Multipliers Componentes (current account of households)
- Aditional intergroup effects
0,000 0,200 0,400 0,600
1995 1996 1997 1998 1999 2000
Source: Portuguese accounting multiplier matrices (Ma) from 1995 to 2000 and
their components (additional intergroup effects ((M2-I)*M1) and additional